Degraded Heap, Multiple Starts and Confusing Messages

Hello Bob, I would appreciate your help please. Sorry, this is a bit long winded, but hopefully it contains relevant information.

Our IoTaWatt was bought from the first available batch in the UK, along with one 20A and three 100A current transformers (circa October 2017). From this setup, the daily energy figures for solar generation, import, export, house usage, Immersun diversion (hot water) and the used solar generation are recorded on EmonCMS.org.

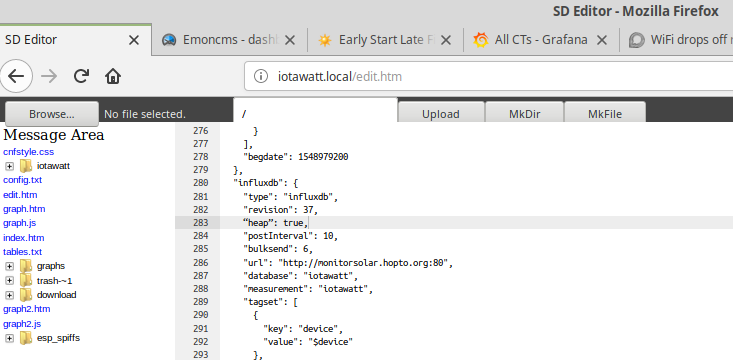
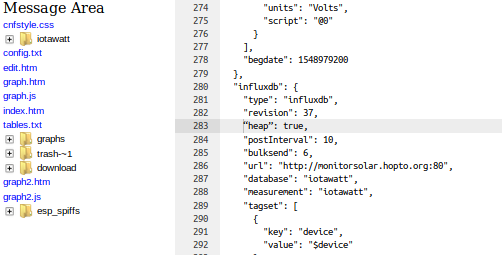
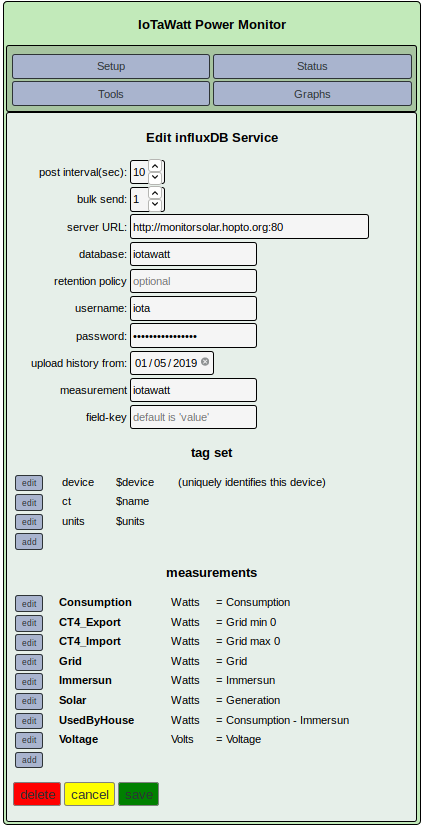
When the option to post to PVoutput became available it was successfully started in mid February 2019 (East & West 4.000kW Live Outputs). Later when posting to influxDB / Grafana option occurred, it was also initiated as an educational exercise.

On 4/29/19 @ 12:56:52z our village had an hour long Power failure followed by several short false starts.

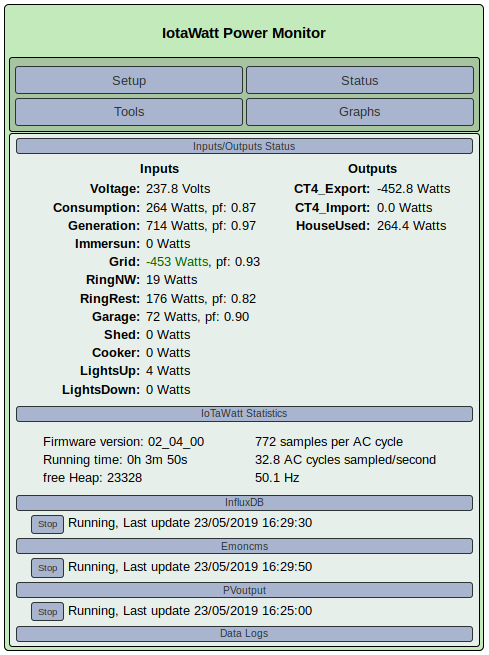
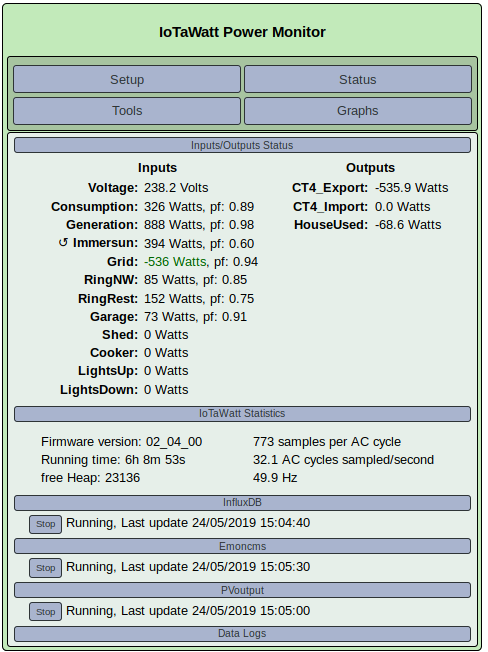
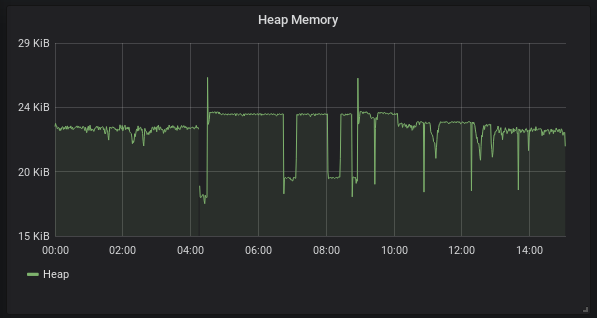
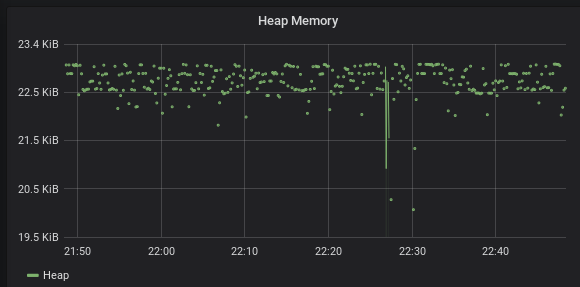
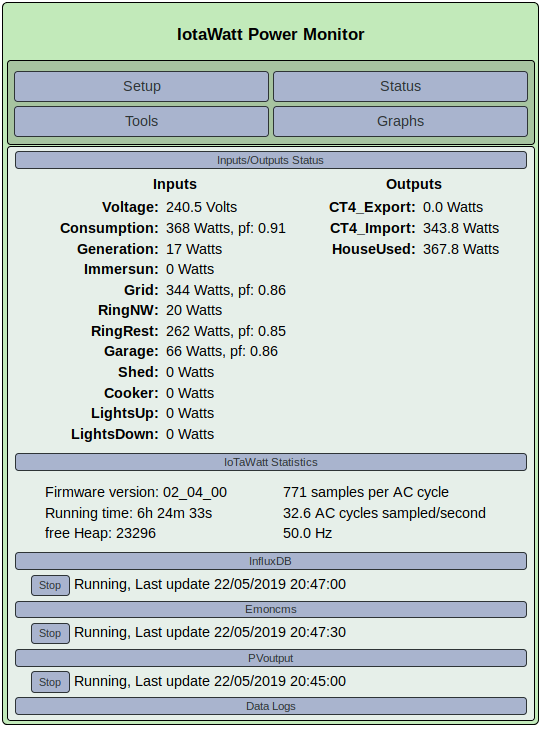
A while later it was noticed that the Running Time shown in the IoTaWatt Status window unexpectedly indicated a recent start up. Investigation of the iotamsgs.txt message log revealed that on ā€œ5/01/19 @ 08:47:22z Heap memory has degraded below safe minimum, restartingā€ and this problem had occurred around 28 times by 07:11:07z on 5/12/19.


IoTaWatt Message Log.txt (9.6 KB)
Copy of iotamsgs_txt.txt (546.1 KB)

In an attempt to identify the issue, several aspects were investigated:

  1. No extra wifi traffic found on channel 1
  2. No changes made to location of wifi equipment since IoTaWatt first started
  3. No known recent change to wifi signal strength
  4. The IoTaWatt unit displays a pulsating green indicator.

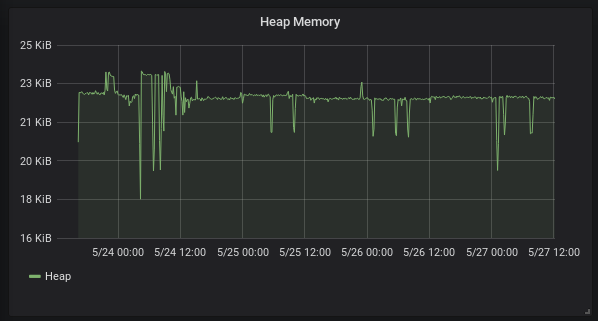
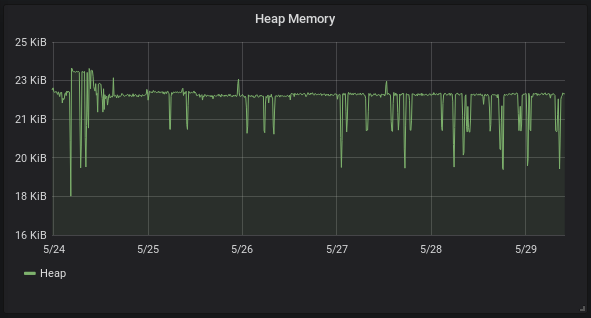
In case the issue related to the number of uploads being performed i.e. EmonCMS + PVOutput + InfluxDB, the following changes have been carried out and consequences noted:

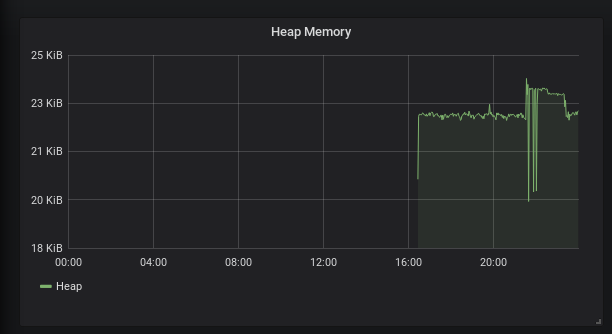
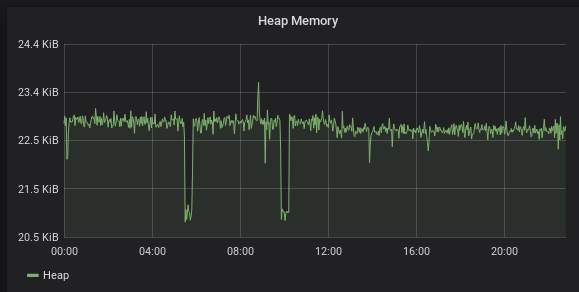
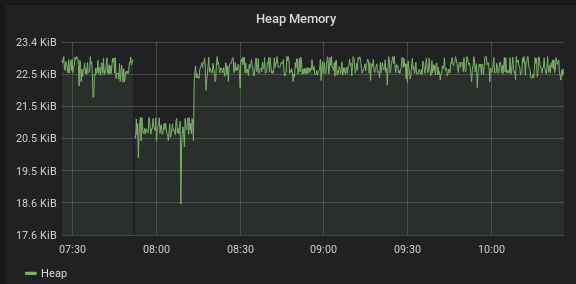
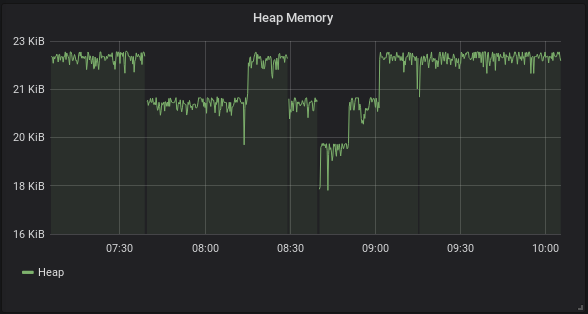
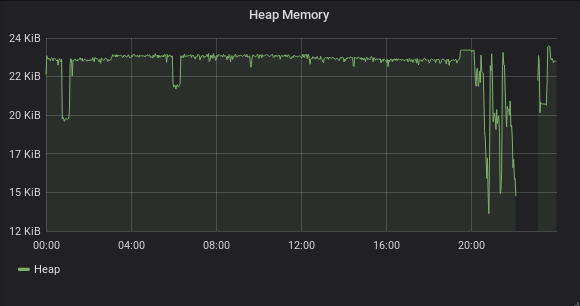
a) InfluxDB posting stopped (posting to EmonCMS + PVOutput continued). The ā€˜Heapā€™ problem went away.
b) InfluxDB posting restarted. The ā€˜Heapā€™ problem reappeared.
c) PVOutput posting stopped (posting to EmonCMS + InfluxDB continued). PVOutput showed no further updates. The ā€˜Heapā€™ problem persists.
d) Posting to PVOutput started again about a day later.

Finally, from a mechanical engineer of senior years use to working with gears, threads and metals, thank you Bob and all those who have helped to create a very useful and versatile energy monitoring tool.

Hello @OddJob,

I itā€™s been awhile. Like they say, no news s good news. Looking at that log is a trip down memory lane.

Looks as if your IoTaWatt run straight through March and did a routine six week restart.

Then the wheels came off the wagon when you started using influx. I will admit that my primary home unit does all of EmonCMS, PVoutput and influx, and I do occasionally get a heap degraded restart. But maybe once a month. Every 2-12 hours is a problem.

First, I donā€™t think it has anything to do with the vintage of the unit. It seems to have been brought on by influx.

Looking at your status display after 6 hours the heap is still healthy. So it must crash because of some stimulus. Because Iā€™ve had a bout with this issue, there is an undocumented diagnostic feature that can be used to add an available heap measurement to your influxDB measurements. To use it, you add the Json object ā€œheapā€:true to the influx configuration.

This involves editing your config.txt file with the file manager app. If you make a mistake and cause your config.txt to be invalid Json, your IoTaWatt wonā€™t boot and you will need to remove the Sd card to fix it on another computer. I always use a Json lint program to check a config after I edit it.

Here is an excerpt from one of my config.txt that is monitoring heap:

ā€œinfluxdbā€: {
ā€œtypeā€: ā€œinfluxdbā€,
ā€œrevisionā€: 50,
ā€œheapā€: true,
ā€œpostIntervalā€: 10,
ā€œbulksendā€: 1,

If you donā€™t want to edit the config.txt file, you can post it in a PM and Iā€™ll do it.

Once itā€™s been setup, there will be a measurement called ā€œheapā€ with your tagset and having a field ā€œvalueā€ equal to the average available heap during the period since the last heap measurement.

Doing this and then plotting the heap measurement might shed some light on this issue. The restarts will be apparent (at least to me) and the heap usually degrades in noticeable steps.

Hello Bob, thanks for a suggested way forward and guidance info but I would appreciate a little more help please.
Having inserted ā€œheapā€: true, how do I save the modified file and then send it to the IoTaWatt? If I click on the ā€˜Uploadā€™ tab (see attachment) will this achieve both requirements?


Michael

Hi Michael,
Looks as if you are almost there. There is some limited info on the Ace editor in the documentation at File Manager and Editor ā€” IoTaWatt 02_03_20 documentation

But at this point, all you need to do is hit ctrl-S to save the file. After you save it, the easiest way to cause it to take effect is to restart the IoTaWatt.

Hello Bob, It would appear Iā€™m not quite out of the woods yet. I saved the file as suggested, and restarted IoTaWatt but things seem to have gone backwards. The saved config.txt file shows
txt
and the message log
IoTaWatt Message Log 2.txt (9.6 KB)
Further guidance please.
Michael

iā€™m looking at the quotes arountd ā€œheapā€ and they donā€™t appear to be the same as the other quotes. I suspect this wouldnā€™t pass Json Lint either. Can you send me the file in a PM and Iā€™ll check it out?

Well spotted - Iā€™ve redone the quotes and IoTaWatt has burst back into life, thank you.


I did try using Json Lint with the 10 lines starting from ā€œinfluxdbā€ ā€¦ but didnā€™t understand the result as it complained about the first line which I knew you had already OKed.
Anyway, thanks again.
Lets see what the Heap figures reveal.
Michael

Good. Letā€™s let that cook through a couple of degrades, then if you can plot the heap, Iā€™ll take a look.

You have to cut and paste the entire file for Json lint, or recognize the boundaries of an individual object.

Status window along with Yesterdayā€™s and todayā€™s Heap info from Grafana

Heap%2024_05 Heap%2023_05
Latest iotamsgs.txt log
iotamdgs_txt.txt (560.9 KB)
Happy hunting :grinning:
Michael

Thanks, I can see the two restarts pretty clearly and the log verifies that. The heap goes way up after restart before all of the web server services start and allocate buffers.

Whatā€™s interesting here is the 4K troughs that precede each restart. The influx service builds a maximum 4K payload, so that correlates to your influx experiments. Problem is that heap has to get below 10K to trigger the restart, and it doesnā€™t get that low here.

So something is going on to eat more heap. Iā€™m looking at the periodic spikes that seem to happen with some regularity about every 80 minutes or so. Thereā€™s nothing in IoTaWatt with those characteristics.

It could be something unrelated happening on the WiFi network that are causing the low level ESP to react to something. I do see that in my systems, although not with this kind of regularity. If that happens coincident with the influx service trying to send a large buffer load, it could dip below the 10K minimum.

Can you post your IoTaWatt influx setup display? Iā€™d like to get an idea how many measurements there are.

Also, can you reduce bulksend to 1 to reduce the size of the ordinary posts? Iā€™m curious if that increases the MBTF.

The IoTaWatt to influx setup taken after the bulk send is reduced in size to 1


I restarted IoTaWatt just after midnight today (25th) resulting in this Heap Memory graph
Heap%20Memory%20for%2025th
N.B. Iā€™m not aware of any domestic aspect associated with the dips around 05:30 and 10:00.
The last hours Heap Memory graph looks like
Last%20hour%20on%2025th
Finally the latest iotamsgs_txt.txt
iotamsgs_txt.txt (563.0 KB)
Although the reduced bulk send appears to have improved things on the Heap front, do you wish to try something else?

Thanks,
Iā€™d like to let it run for at least a couple of days this way to see if the heap degrades.

Your influx configuration will generate a pretty large payload for each 10 second interval. So if it has to catch up for any reason, it will quickly generate those 4K buffers.

There are a couple of things that I have on the todo list for influx that may help here, but the more data I have before going there, the more likely it will be optimal.

First, I can adjust the maximum buffer size depending on load. Most users donā€™t have all three web services running with a lot of data. The Emoncms service has a similar maximum buffer size, so if communications are interrupted, they both start to use their maximum buffer size to upload history. Double whammy. Doing something to monitor total aggregate buffer size would help that.

Another thing that would be huge would be to compress the data to influx. The line protocol is very verbose, and contains a ton of repetition. Influx is supposed to support compressed input, so I would need to write a compression algorithm for the ESP8266 - and the act of compressing chews memory, so thatā€™s not going to be an immediate solution.

Please post the results after the weekend.

An Intermediate Update.
Out of curiosity I have a look to check for any unwanted restarts on IoTaWatt and also look at the current Heap Memory graph using different viewing time periods e.g.
3%20Hour%20Window
On this 3 hour graph I noticed the vertical dark line just before the start of the lower heap figures. On investigation I found the the last high level figure is 22.800KIB at 07:51:15 whilst the start of the lower level figure of 20.517KIB occurs at 07:52:30. When looking at 07:51:45, a heap level figure is not shown i.e. there is a blank space where the figure is expected!
I donā€™t know if this observation is meaningful but thought Iā€™d bring it to your attention.
Pending further change requests in the mean time, I will post the longer term Heap Memory graphs later.

That is interesting. The heap measurement is added to each payload that is sent to influx, but unlike the ordinary measurements, which are timestamped when they were taken, the heap measurement is timestamped with the time it is sent to influx. So when there is a gap, it indicates that there was an interruption in sending data to influx.

That is consistent with requiring larger buffers to upload a backlog.

Sorry, it takes me a while to get there, but Iā€™ve managed to export the heap data from Grafana. Maybe it will show if the data was available or not.
grafana export Step Change Data.ods (35.3 KB)

Iā€™ve had another look at the Grafana export capabilities from the heap graph and found that a 2 hour window provides data at 10 second intervals. Starting at 2019-05-26T07:51:50+01:00 in the following data, there are three heap values shown as NULL which tie in with the vertical dark line mentioned at post 13.
grafana export 2h window better data.ods (31.1 KB)

Good News - There have been no heap problems since deliberately restarting IoTaWatt just after midnight on 25/05/2019 as shown in
IoTaWatt Message Log 27_05.txt (9.6 KB)
This next Heap Memory graph covers several days and includes some of the information provided in earlier graphs.
Several%20Days%20Heap%20Memory
I investigated the three ā€˜blipsā€™ on the RHS and found that the the vertical dark line just before the start of the lower heap figures was present in each case. The exported CSV data for these blips shows some heap figures are missing, in the same way that I pointed out in post 13. There does not seem to be a timing consistency with the position of the blips.

Heap Memory since Last IoTaWatt retart
Heap%20Memory%20from%20last%20IoTaWatt%20restart
Recent Heap Memory Graph
3h%20window%2020_05
The vertical dark line is due to the absence of Heap data as mentioned earlier.

OK @OddJob,

It looks like itā€™s fairly stable now with bulk send = 1. I wouldnā€™t rule out a low heap event if you have an outage that causes both Emoncms and influx to try to upload a lot of backlog simultaneously, but it will recover.

This data has been helpful, and Iā€™ve gone over more data from one of my home systems that has had a few heap restarts over the past few months. It also is running three web services.

Iā€™ve got a punch list of things I want to do to both increase available heap and reduce simultaneous demand. Iā€™ll try to get that into the next release. In the meantime, if this problem starts happening with greater frequency, please give me a shout out and keep that influx heap monitor running if you can.

Iā€™m glad to have been of help in a small way. Keeping the influx heap monitor running is not a problem. Please let me know if you want me to change/try something else to see what its effect will be.

Hello Bob
There appears to have been a spate of ā€˜Heap memory has degraded below safe minimumā€™ occurrences recently - iotamsgs.txt message log.
IoTaWatt Message Log 04_07.txt (17.2 KB)
That said, I would like to offer the following observations regarding the ā€˜PVoutput: Fatal responseā€™ entry:
a) The first indication that something had changed occurred when the PVoutput energy consumption values stopped just before sunrise.
b) The IoTaWatt status window still showed PVOutput as operational i.e. it could be stopped by clicking on ā€˜Stopā€™, however doing so had no effect.
c) It appeared as though something had locked up.
d) Whilst trying to figure out what was going on, a short power interruption caused the IoTaWatt to Restart and successfully send data the Emoncms, InfluxDB and PVoutput.

Our village has suffered quite a few very short voltage drops/outages (lasting one or more seconds) recently, some of which can be observed on the voltage graph.

This peculiar heap memory issue occurred yesterday (03/07/19) evening. Heap%20Memory%20profile%2003-07-19
Michael

Thank you for posting. Your episode helps to complete the picture In an ongoing investigation of what happened with PVoutput. Your first problem coincides to the minute with a couple of other failures in various places around the world, as does the second which also coincides with a scheduled outage of the PVoutput service. I expect your system is running now and has uploaded all of the historical data.

Clearly there needs to be some improvement in the error handling. The more I understand about what happened the more likely I can do a thorough job of addressing it. There are other issues with heap, but they are exacerbated by the PVoutput issues here and recovery of influx and EmonCMS at the same time. Iā€™m working on that as well.

1 Like