My influxDB instance on a local Rpi has been running flawlessly. I’ve had three IoTaWatt posting to it for more than a week (plus a week worth of history) and all is well.
So now I’ve started to get familiar with using grafana to produce some visualizations. First I setup a free personal hosted account at grafana labs. I linked it to my influx data base, and for the past day or so have been working through their excellent documentation to explore the capabilities.
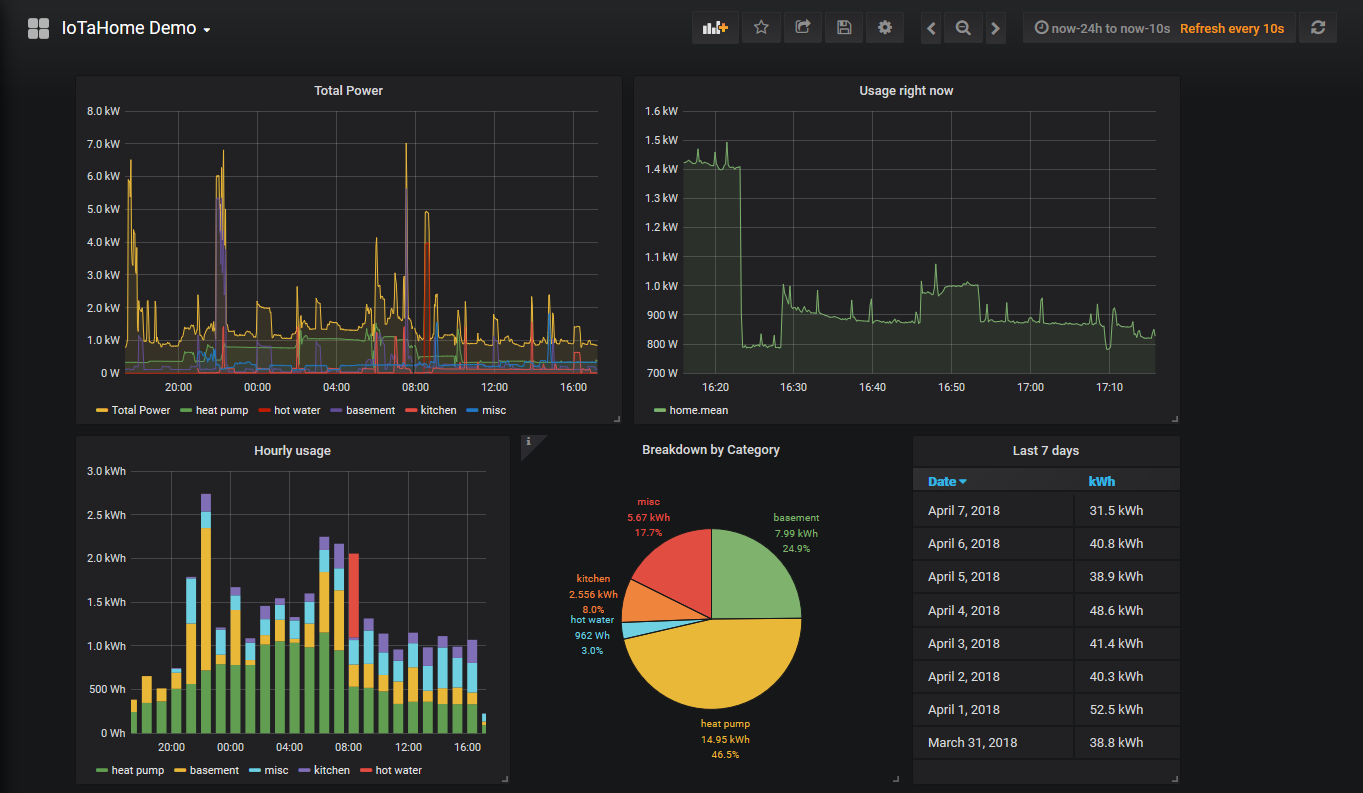
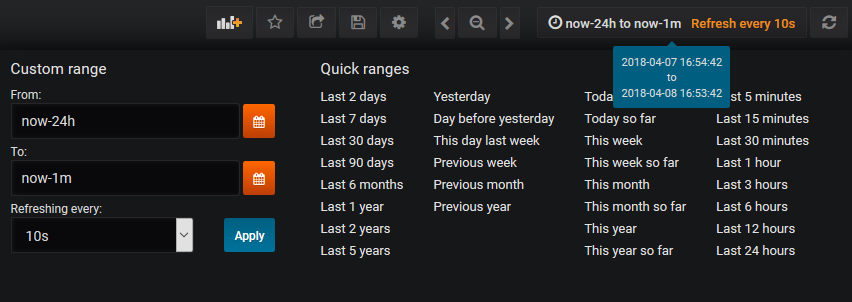
I’ve played with overlayed line graphs, real time usage, stacked usage, pie chart breakdown, and tables of daily usage. The “last 7 days” has a time override to lock that in, as does the “usage right now” to keep the window of the last hour, but all of the other graphics are driven off the range menu in the upper right dropdown:
You can see that there are a lot of choices there, and a custom setting so if you want to know how much power your air conditioner used the last week of august, you can just click the calendars in the custom range.
Response is quick, especially given that the influx data is uploaded as just watts every ten seconds and there’s a lot of integrating to get kWh. In fact it’s so fast that I suspect they are storing the values time weighted like the IoTaWatt so that the integrals can be calculated without actually reading all those data points.
This is the direction I intend to pursue for general web support of IoTaWatt. Haven’t decided whether to put together a Rpi home kit or make a hosted server available, or both. I’ll be working on some standardized naming conventions and packaged dashboards over the next couple of weeks.
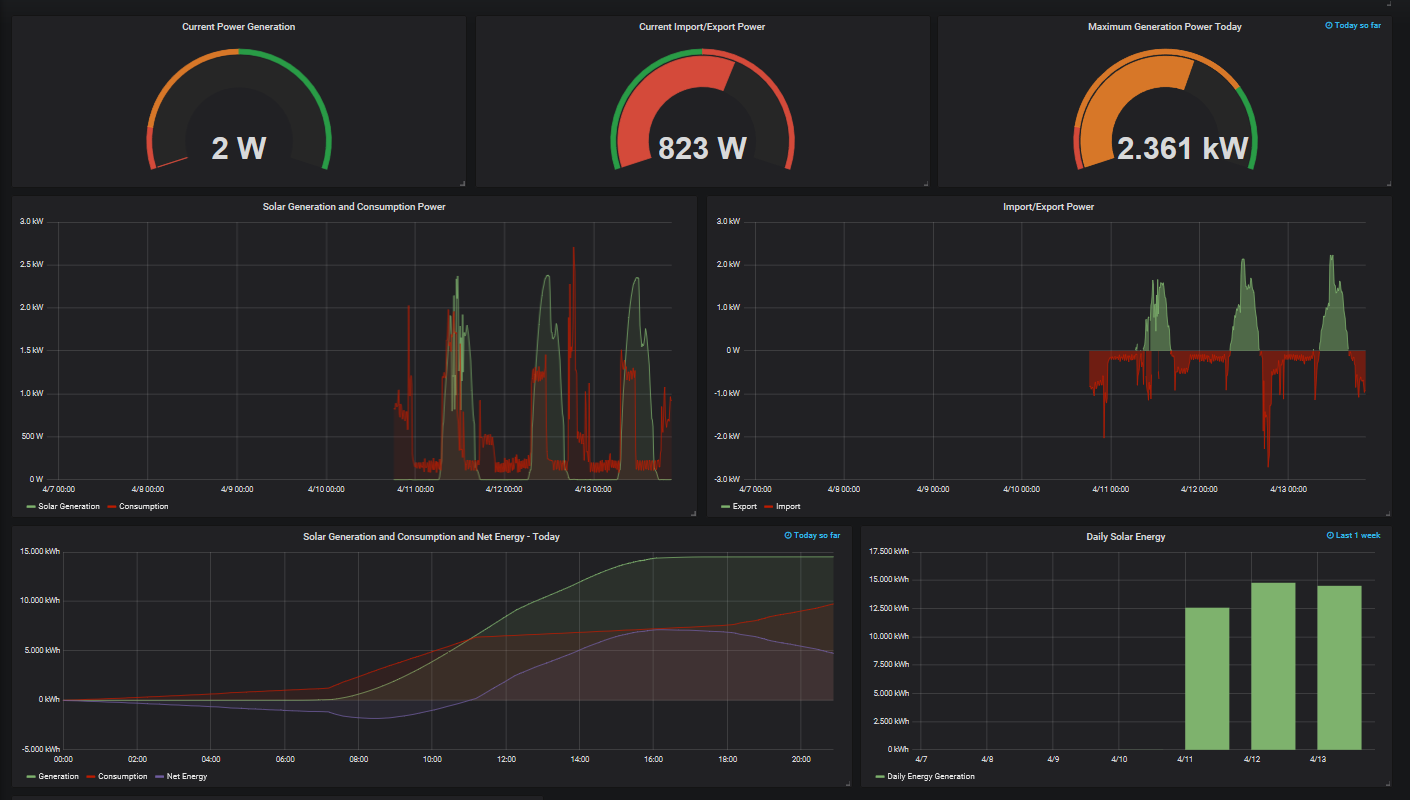
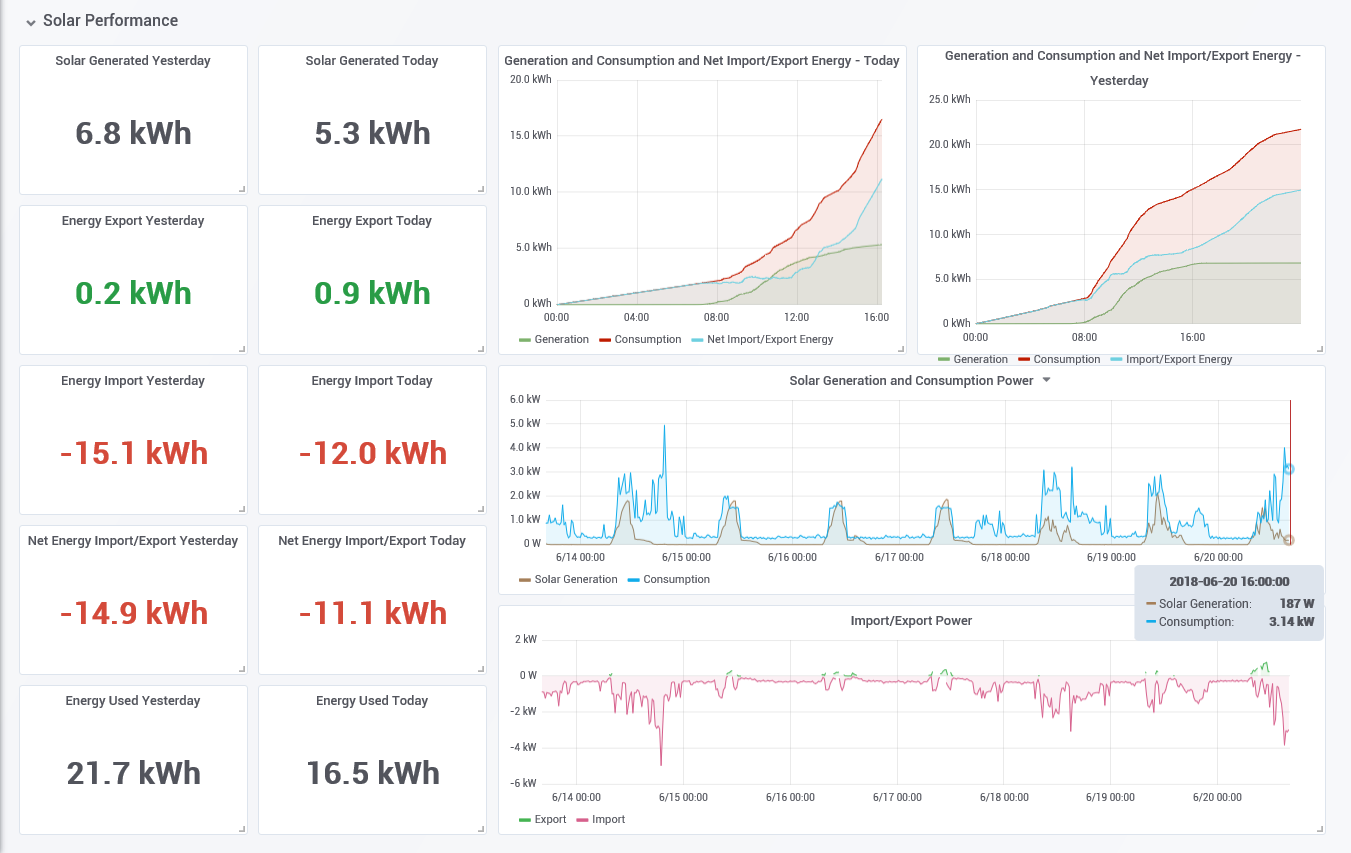
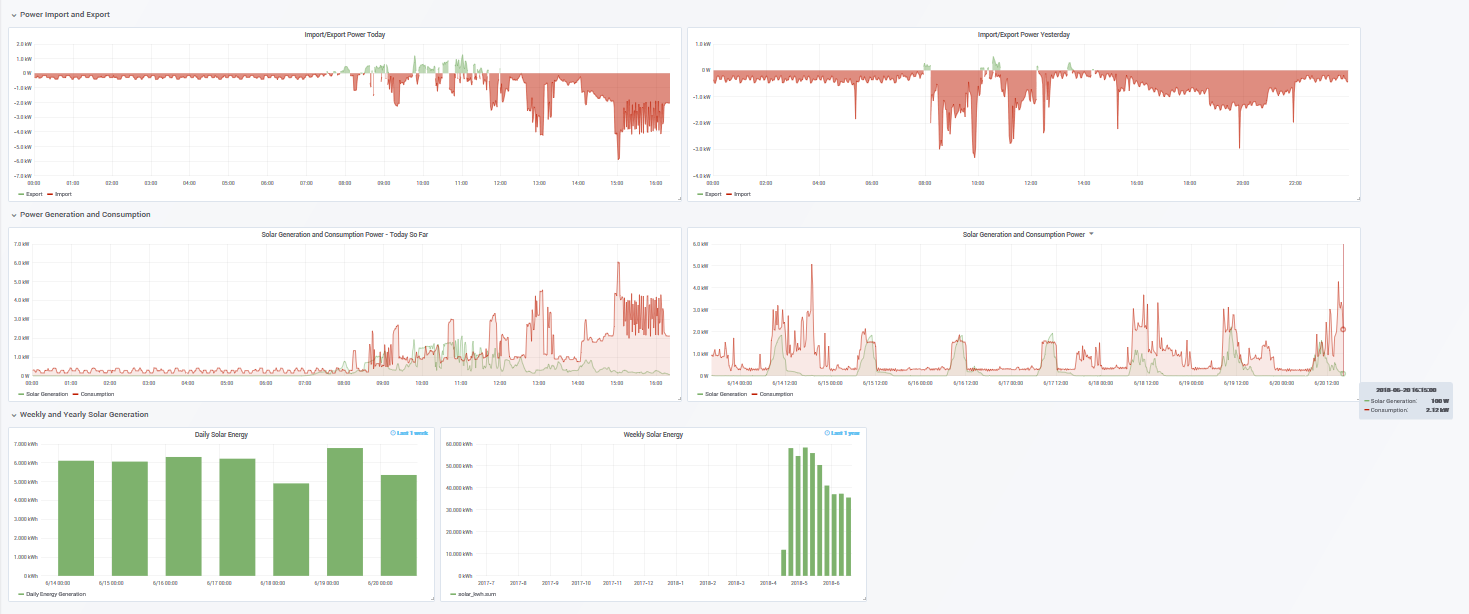
Soon I’ll get a solar user uploading to influx and develop a custom dashboard for that.
A first attempt at a solar dashboard with more to come, need to collect some more data. I am using the 02_03_04 beta software and it has been working well. I am running a local version influxdb and grafana on a Rpi and it is surprisingly fast. Will move to a hosted server when I get more serious.
Would be good to see other efforts to share ideas.
Uploading a month of history from two IoTaWatt during testing I was getting 240 measurements/sec and the rPi didn’t seem to be the bottleneck. Both IoTaWatt were uploading at their max rate.
That’s the ALPHA software. Heads up, it’s going to change over the next couple of days and break your setup.
The good news is that with the new release, you can easily upload your data again in the new format.
I have been watching the post on influxdb structures so was aware that I will need to rework this.
Was focusing more on what would be useful views to include in a dashboard and the beta version lets me easily do a lot more than before. Next version looks even better.
@overeasy@Giraffe Any chance you can share your dashboard code? I am getting started with Grafana and pushing my energy data to influxdb. Perhaps it can be posted in a git repo?
Not sure what you are looking for. I build the dashboards with their pretty easy GUI by defining a new dashboard, adding panels and editing the panels to specify the data to be graphed. Under the hood but visible are queries of influx that feed the individual panels. I’m no guru with this type of stuff, yet I found it was pretty easy to get basic results with a few hours of fooling with it.
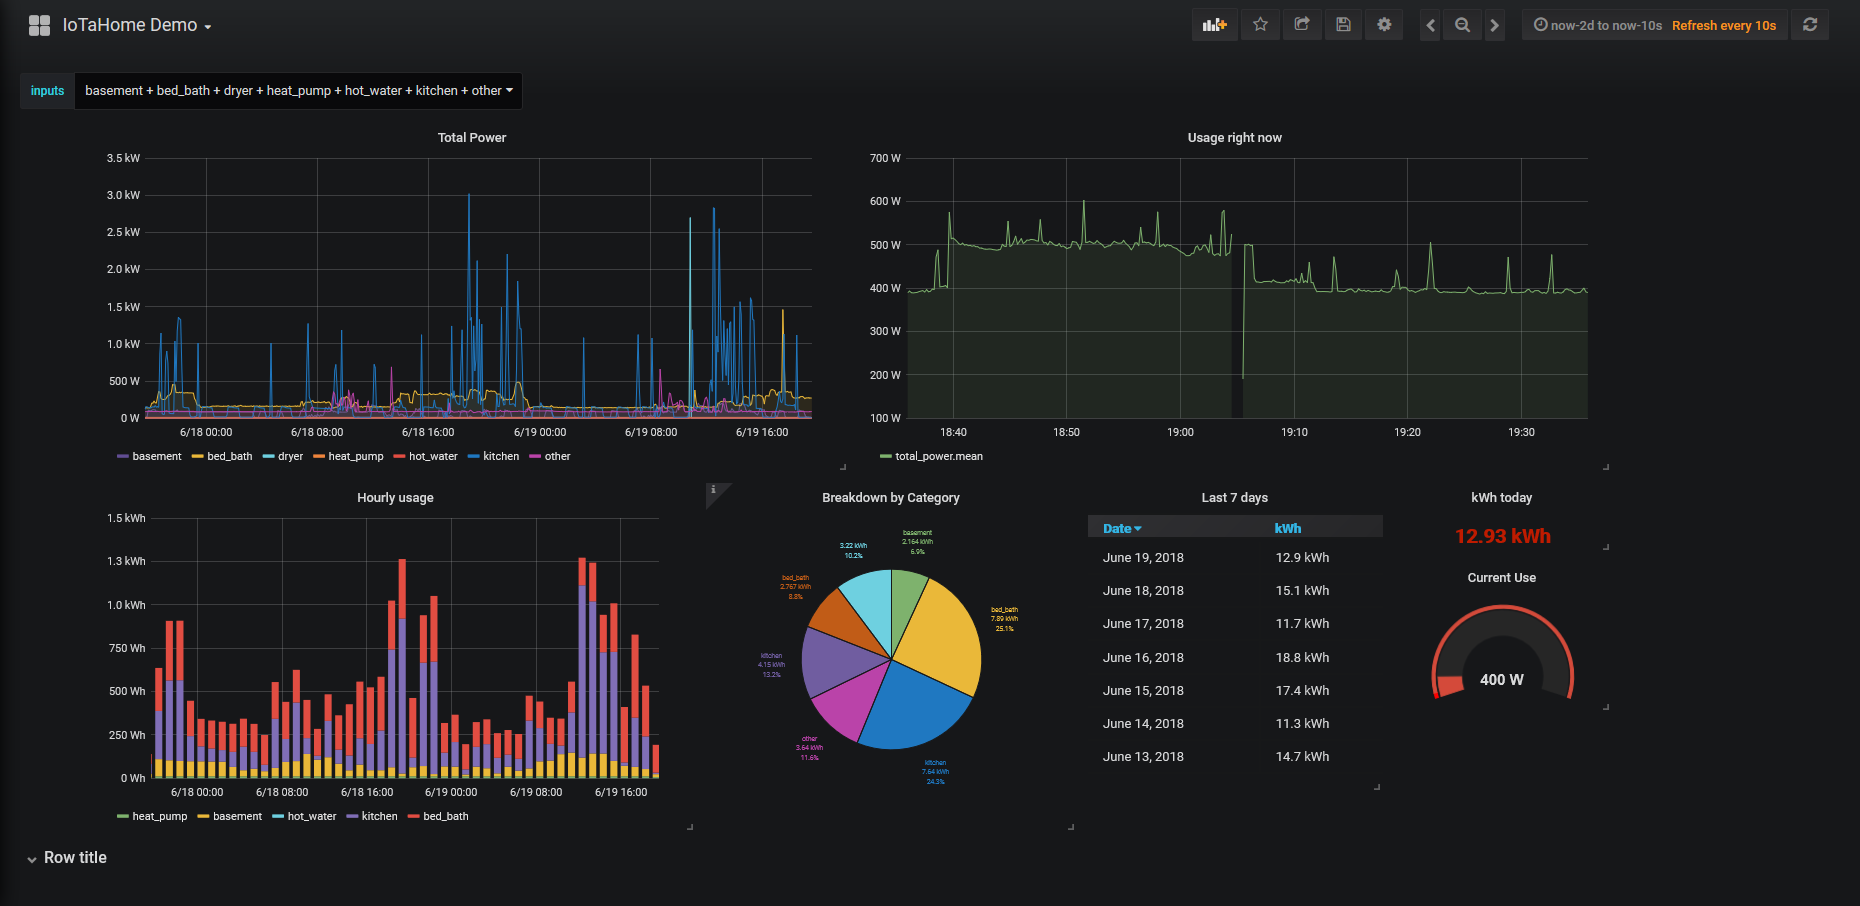
By way of context, I upload IoTaWatt data to an instance of influx on a local Raspberry Pi. I have created a free grafana account at grafana.com and link that to my influxDB instance using my home IP and a port mapped to the influx query port.
Now if you still want code, Grafana will output it’s internal dashboard definition in Json, so here is that file: IoTaHome Demo-1529450490310.json (22.8 KB)
@Giraffe
HI, How can you do field “export” and “import” to "New Iotawatt Solar Main-1529475592662.json " ? this is a difference, is it possible ?
tku
stef
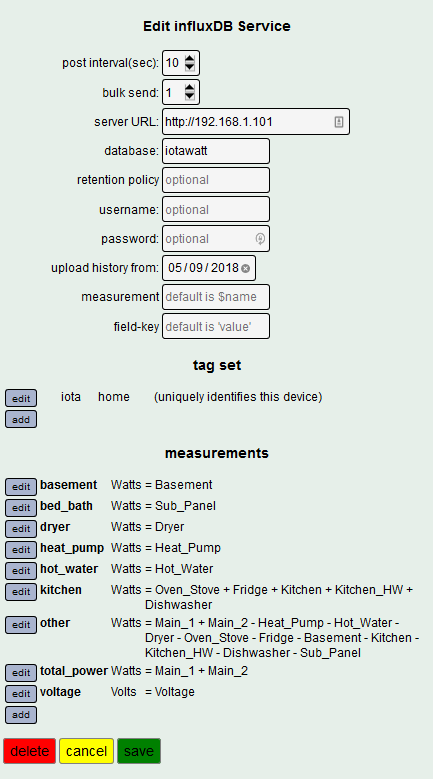
I created a measurement in the iotawatt sent to influxDB that is the difference between total solar kWh and total load kWh. This is actually the net kWh and can be positive or negative depending on whether you are importing or exporting.
In Grafana I sum all the values > 0 only (must be export) and then sum all values < 0 (must be import).
You can see the import and export (+ and -) of the net energy in the import and export graph. I just use the >0 and <0 to give different colours.
Hello, thank you for your answer, I understand better. My problem is that the solar power measure is achieved through another system than iotawatt. With a TICKscript maybe? But I’m novice…
ps:I lovely your dashbord, great job.
Maybe can be done in TICK script if you have both the inputs in influxDB. I have tried using TICK script but found it really difficult (impossible) others that are familiar may be able to achieve the outcome.
Does anyone have any updated Grafana dashboards that they would be willing to share? I was surprised that there weren’t any templates in the Dashboards | Grafana Labs