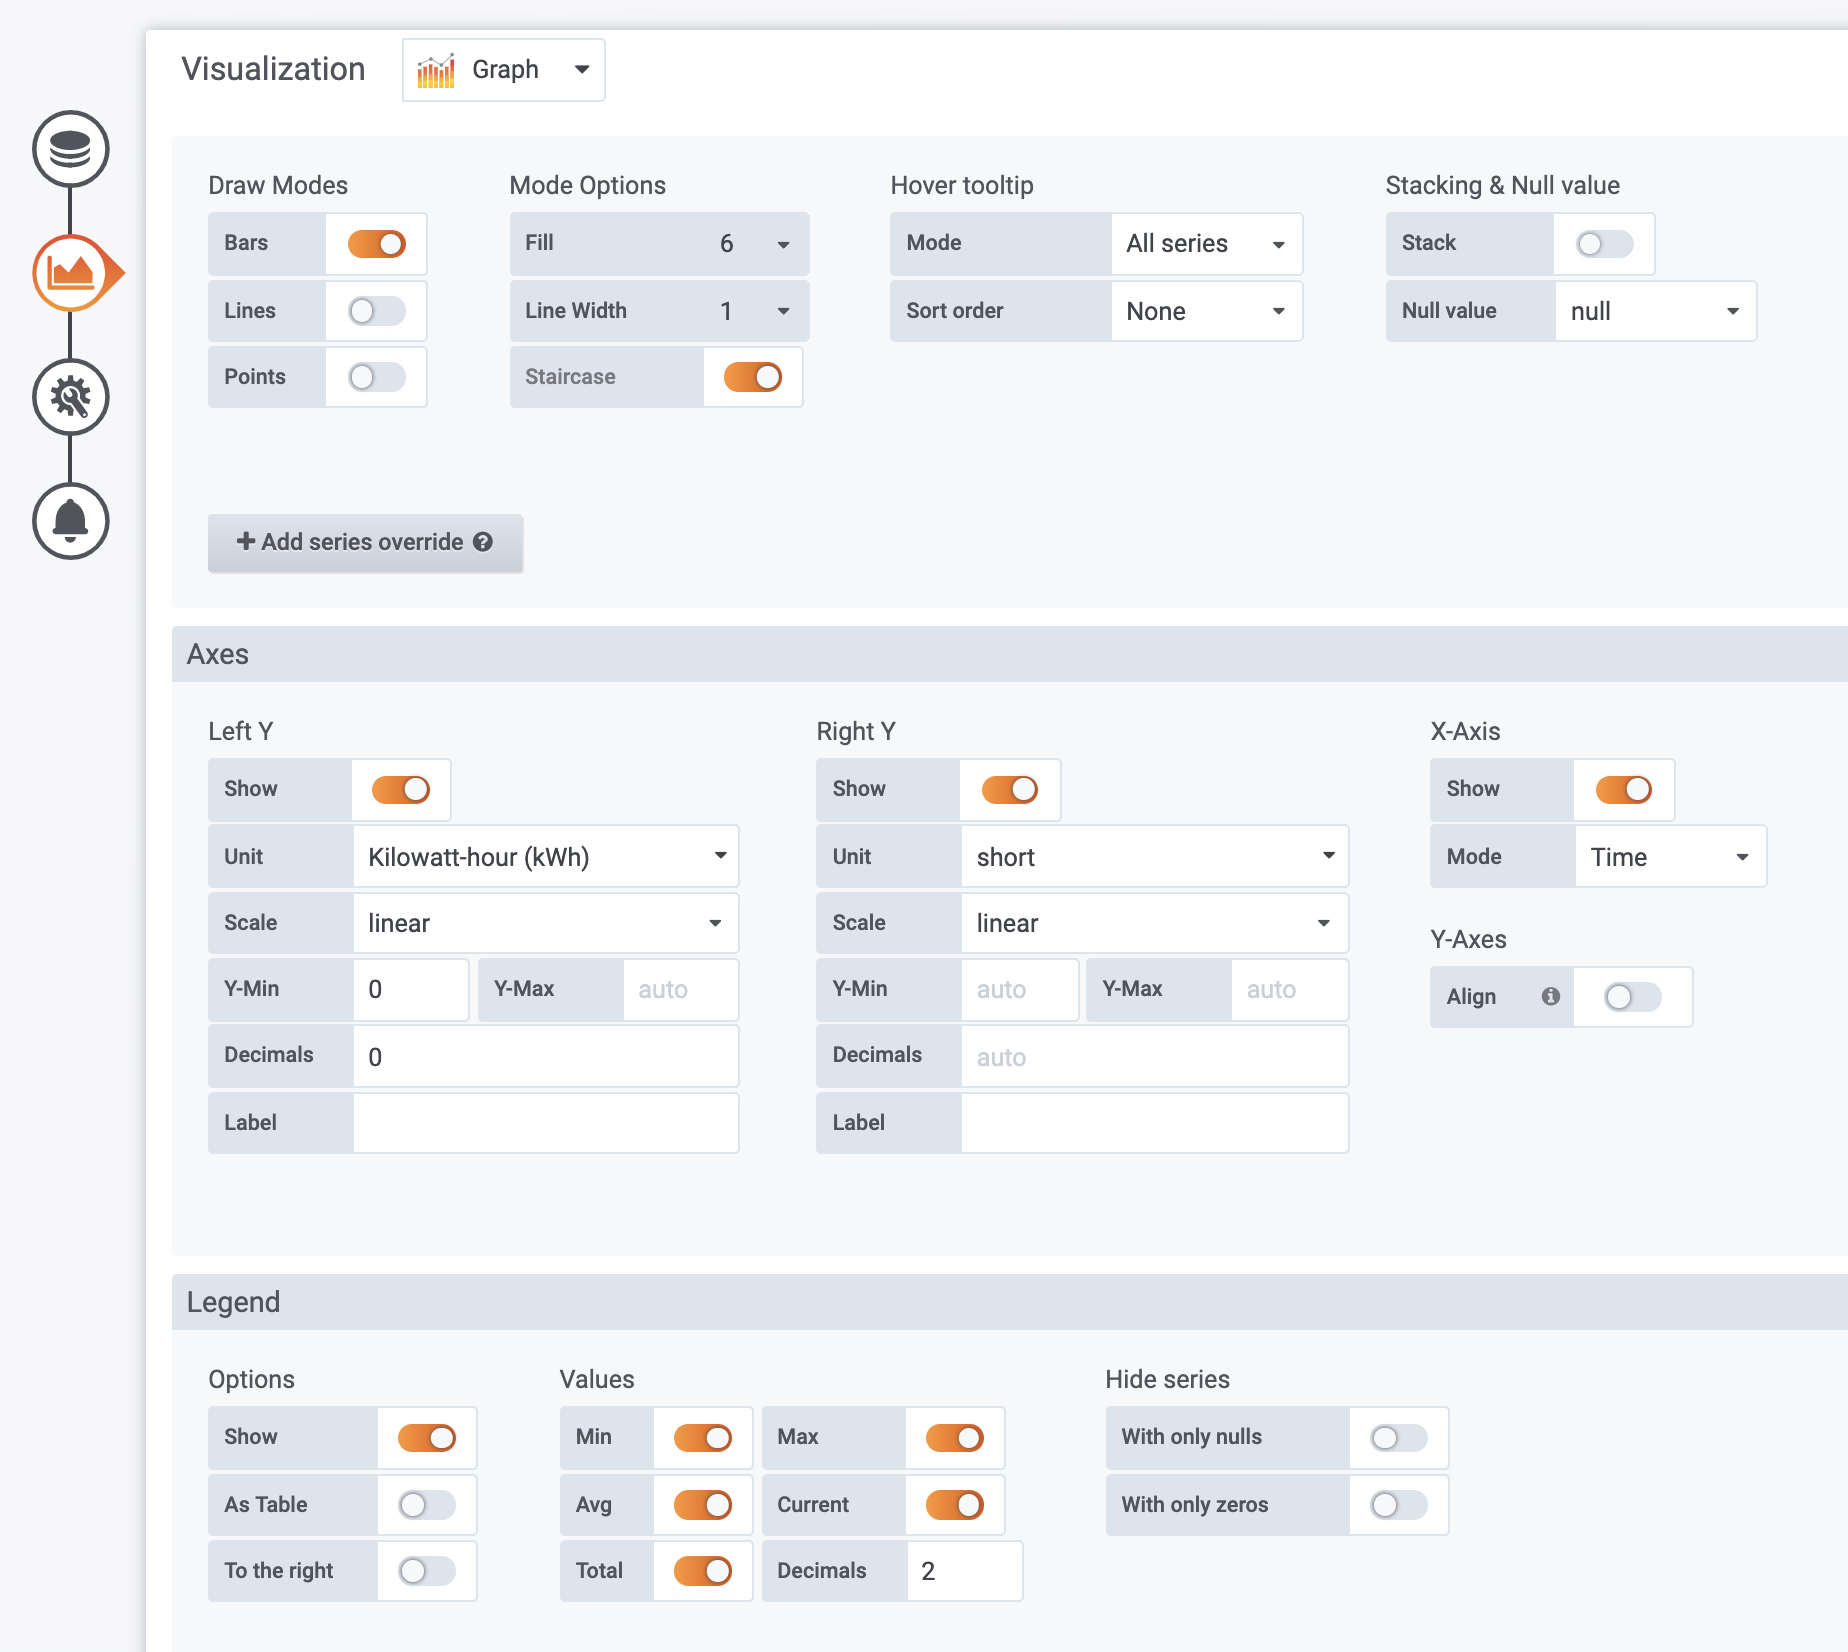
Hi Bob, I like your Grafana Dashboard. How did you create the table with the kWh per day and the pie chart?
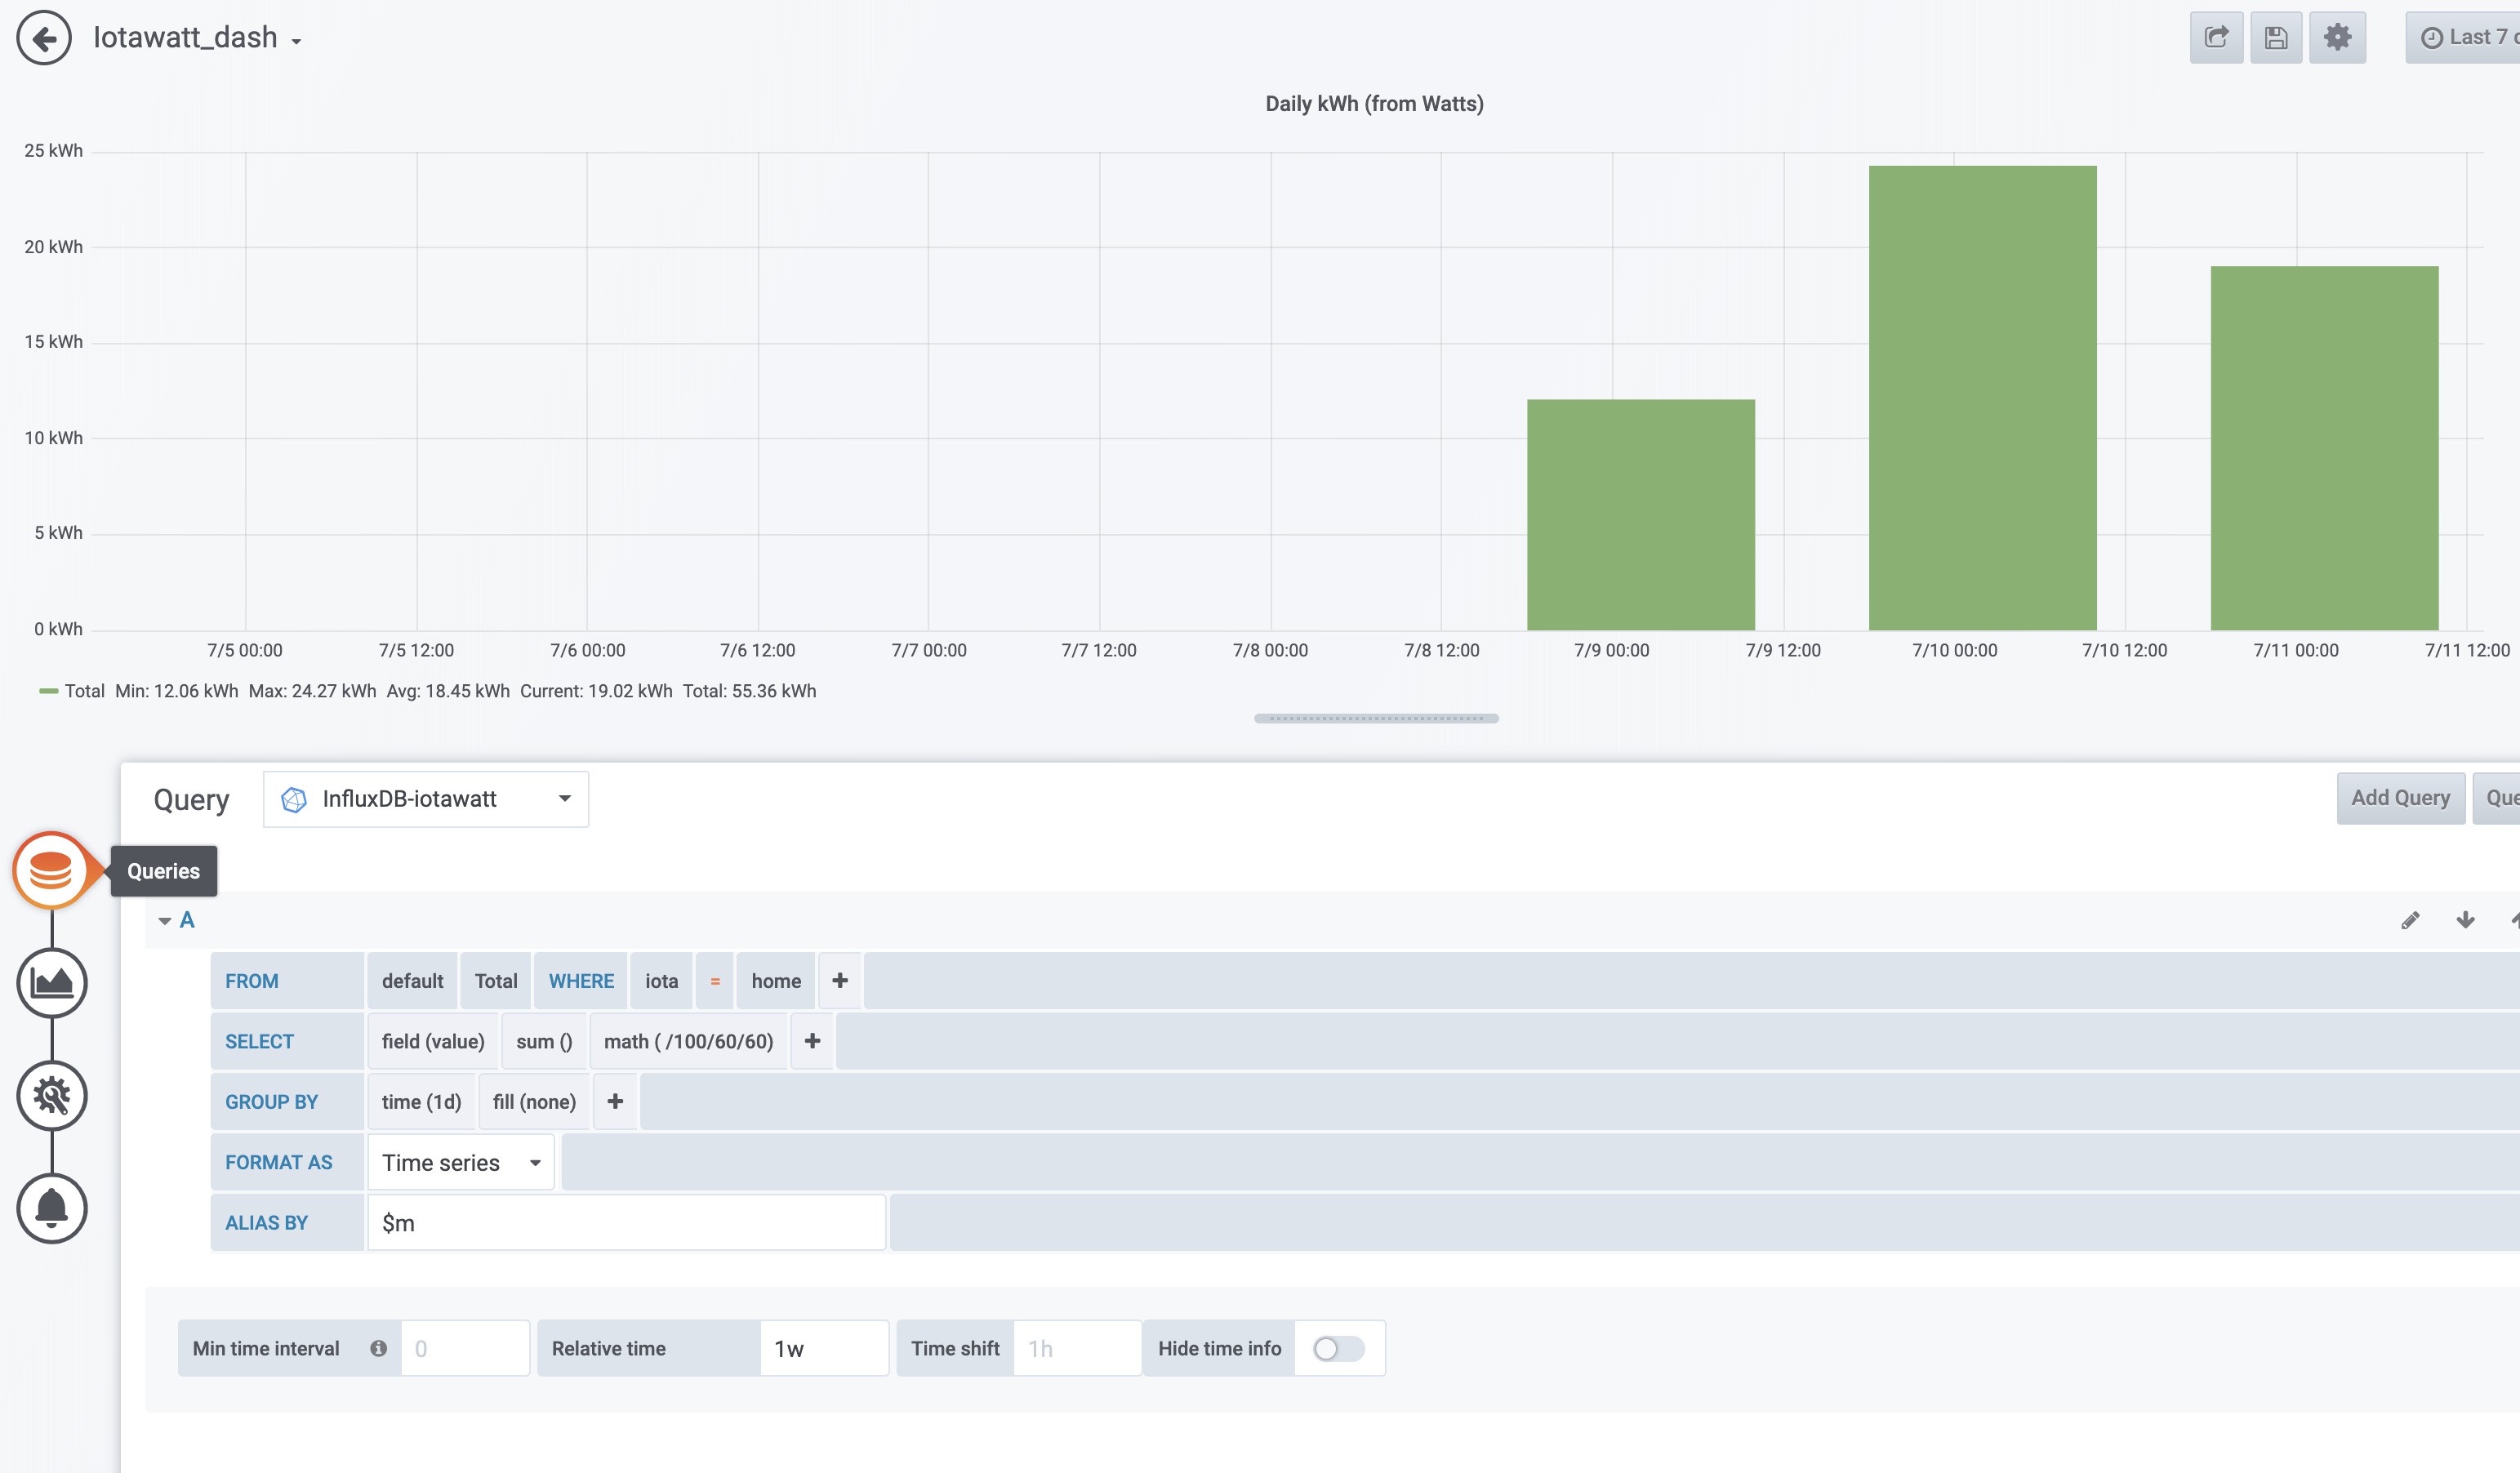
Here’s the kWh/day panel:
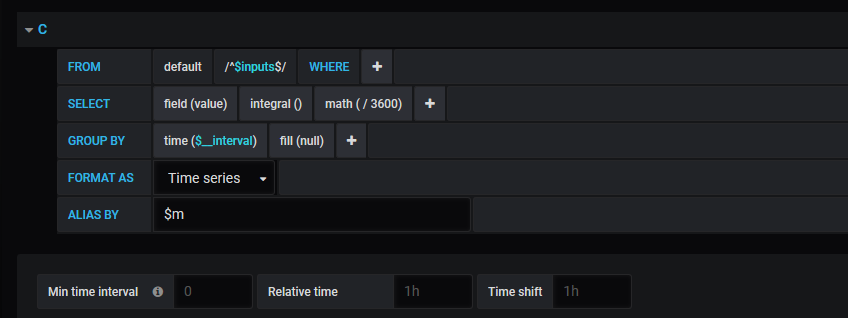
For the pie chart, I had to install a plugin, which I think I got from the grafana site. Here is the query:
That’s all I remember. Right now my influxDB instance is running on a Rpi on my LAN and I use the free grafana from grafana labs. The cable company swapped out my modem a few weeks ago and I haven’t had time to reestablish the path to the database, so while the database is updating on the LAN, grafana can’t query it.
There are some pretty good influx users on the forum. You should try to hook up with them. Way better at it than I am.
1 Like
Bob, thanks for supplying this example. Is your ‘total_power’ input sent from the IoTaWatt to InfluxDB as watts, Wh, or kWh?
When I try to use my “total_power” input which I setup to send as ‘watts’, I get no data points in Grafana when ‘integral()’ is selected.
Values will populate if I select “sum()” or “mean()” but the values seem to be incorrect.
Hello Sky,
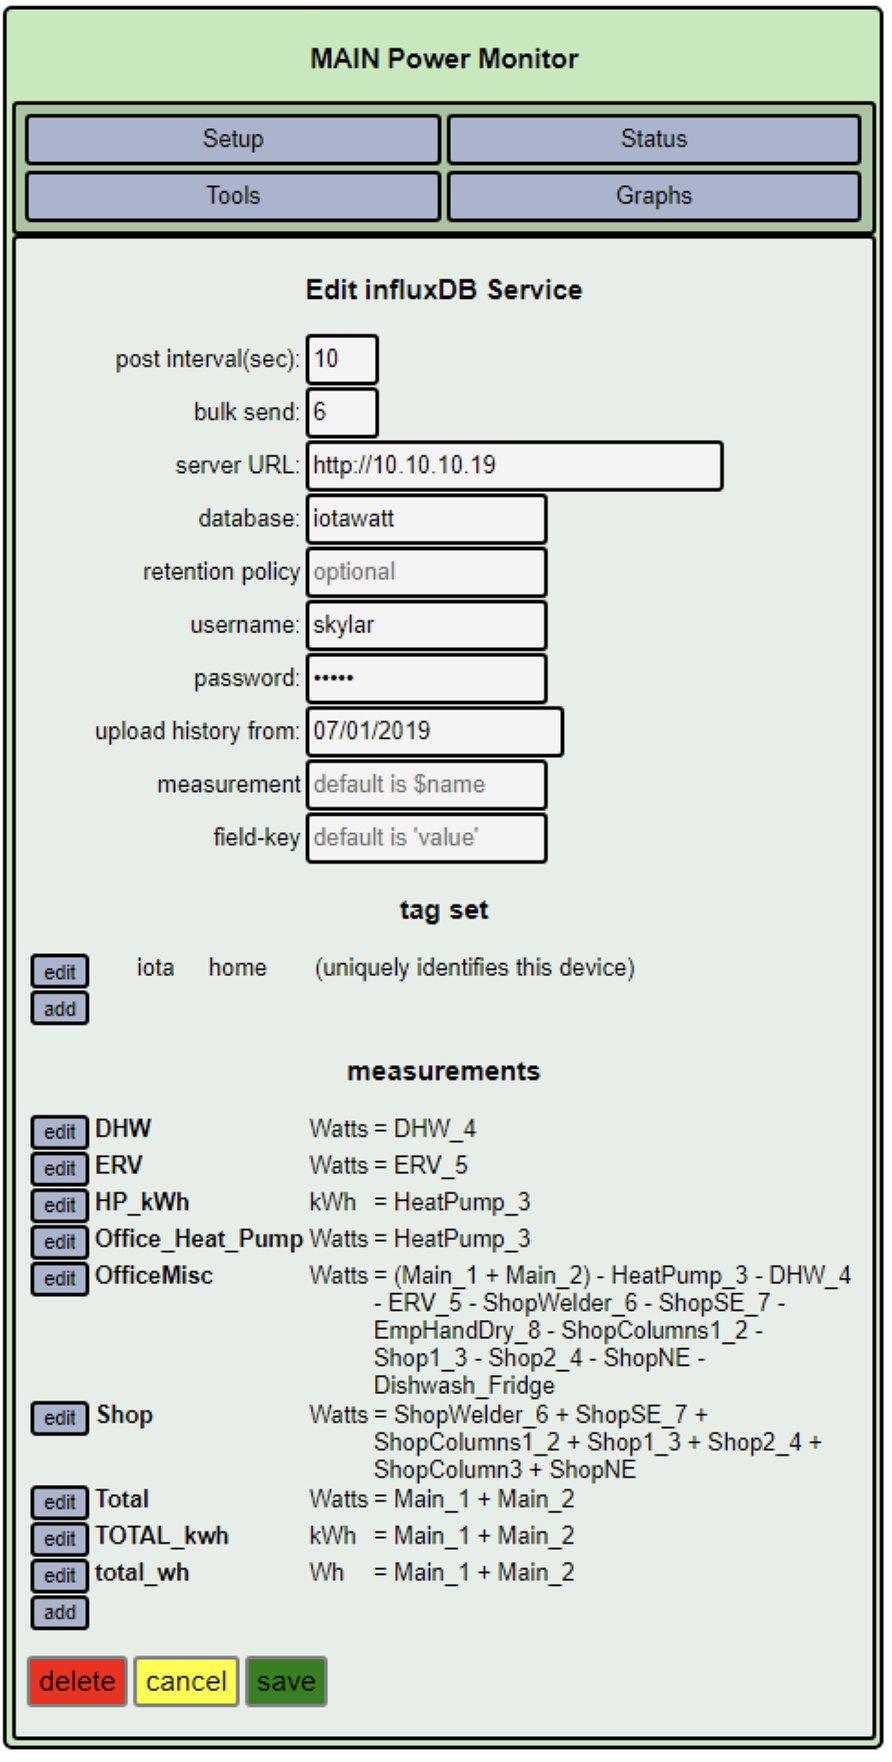
The units are specified in the influxDB service setup. Could you post a screenshot of that please, obfuscating the password if you are using that option?
Bob,
Thank you for the quick reply! I’ve attached an image of influxDB service as I have it configured. My “Total” measurement (Watts) is equivalent to “total_power” in your example.
OK,
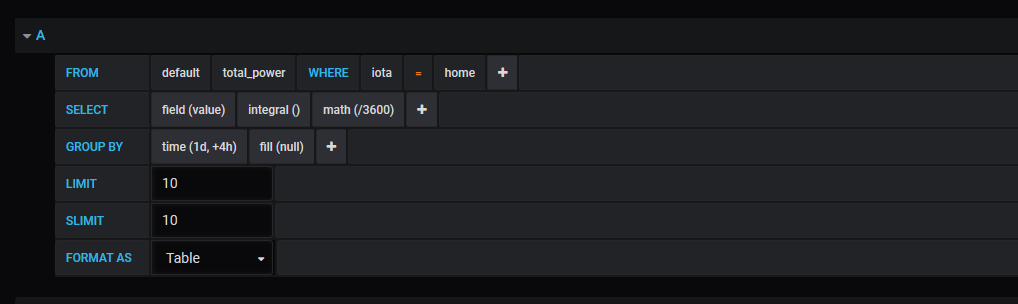
You refer to a “total_power” measurement. That’s what I called it in my example, but you call it just “Total”. Is that the measurement that you are trying to integrate to kWh? Can I see the grafana query?
Stepping back from that for a second, by integrating power over the group interval (hours, days, weeks…) you seem to be trying to get the total energy (kWh) for each interval. So looking at what you are sending to influx, “TOTAL_kwh” is actually the kWh used in the measurement (post) interval. It’s not a cumulative total. So if you sum() that you will get total kWh for each group interval. If you are grouping by day, you will get the total kWh for each day.
Doing that, you should probably sum the total_wh and divide by 1000 to get maximum precision.
Yes, I am trying to use the “Total” measurement which is using Watts as the unit. Is your “total_power” example using Watts, Wh, or kWh?
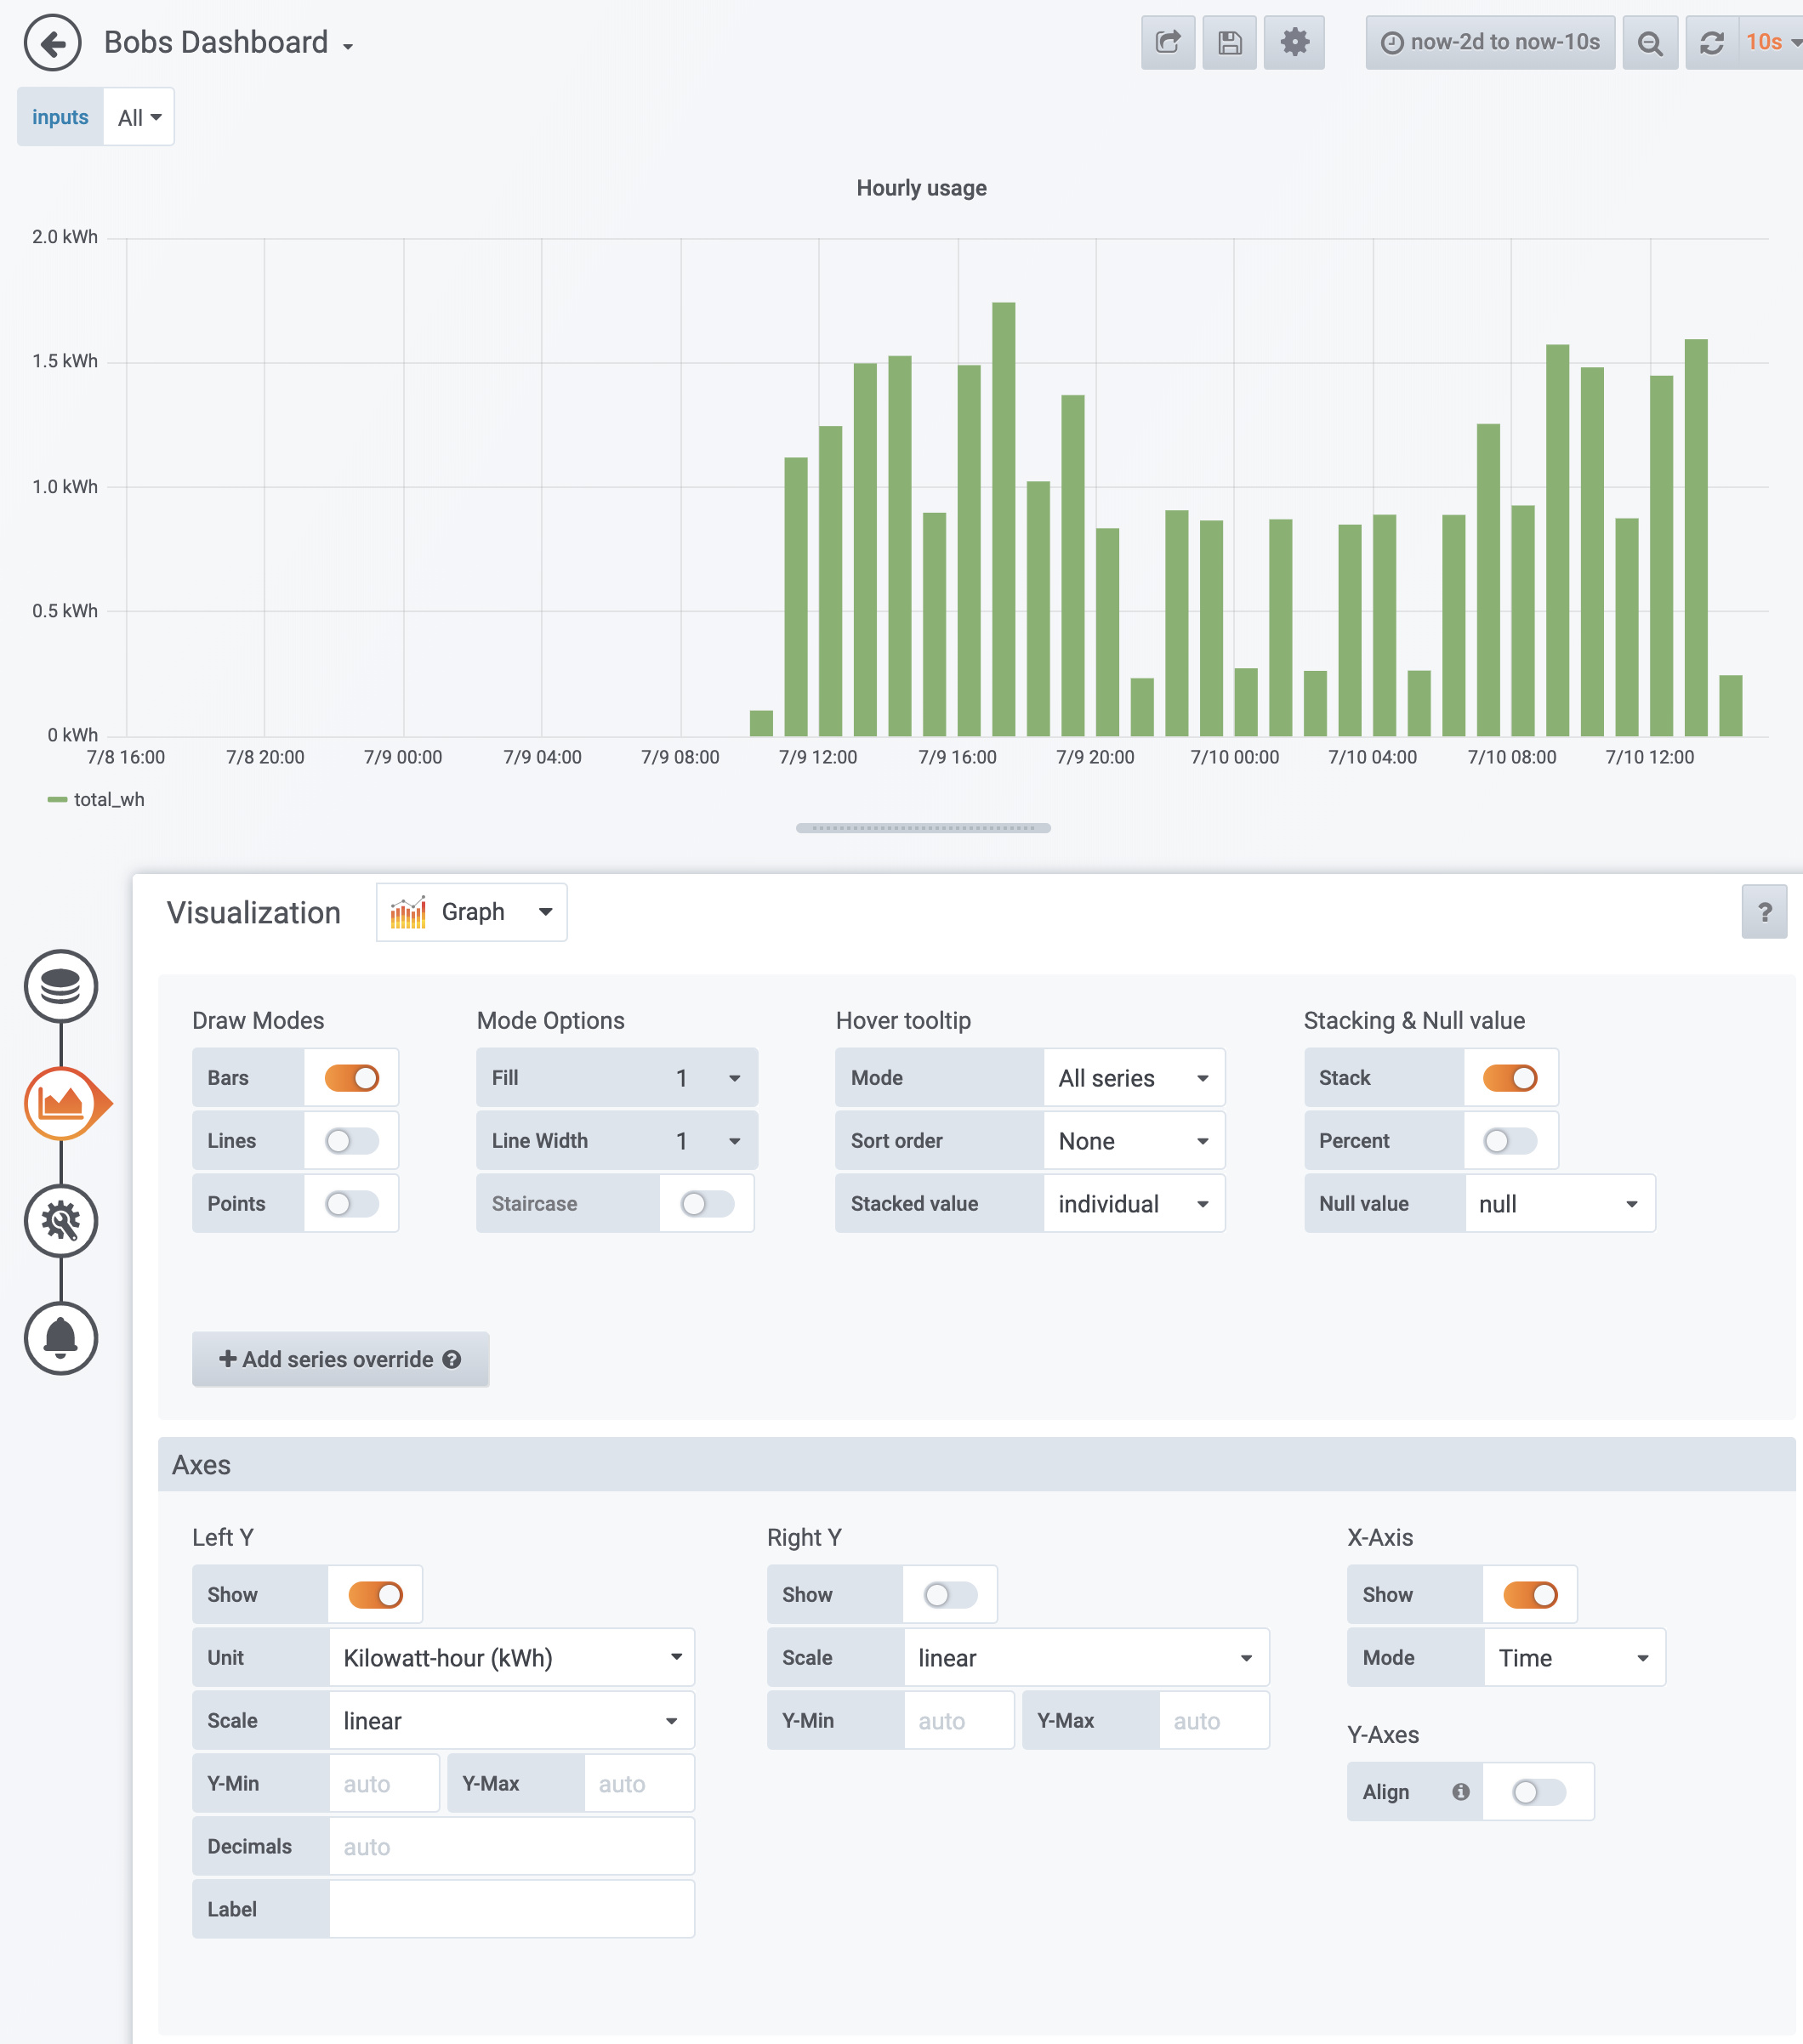
Below is a screenshot of the “hourly usage” from your dashboard template. When I try to use my “Total” measurement input (Watts) in an attempt to copy your example, “No Data Points” are returned. Is it not possible for Grafana to ‘group’ hourly, daily, monthly, or yearly kWh from a measurement input that sends only Watts?

Below is an example showing the results when I use the total_Wh version of the input and use sum() divided by 1000. This seems to return reasonable results.
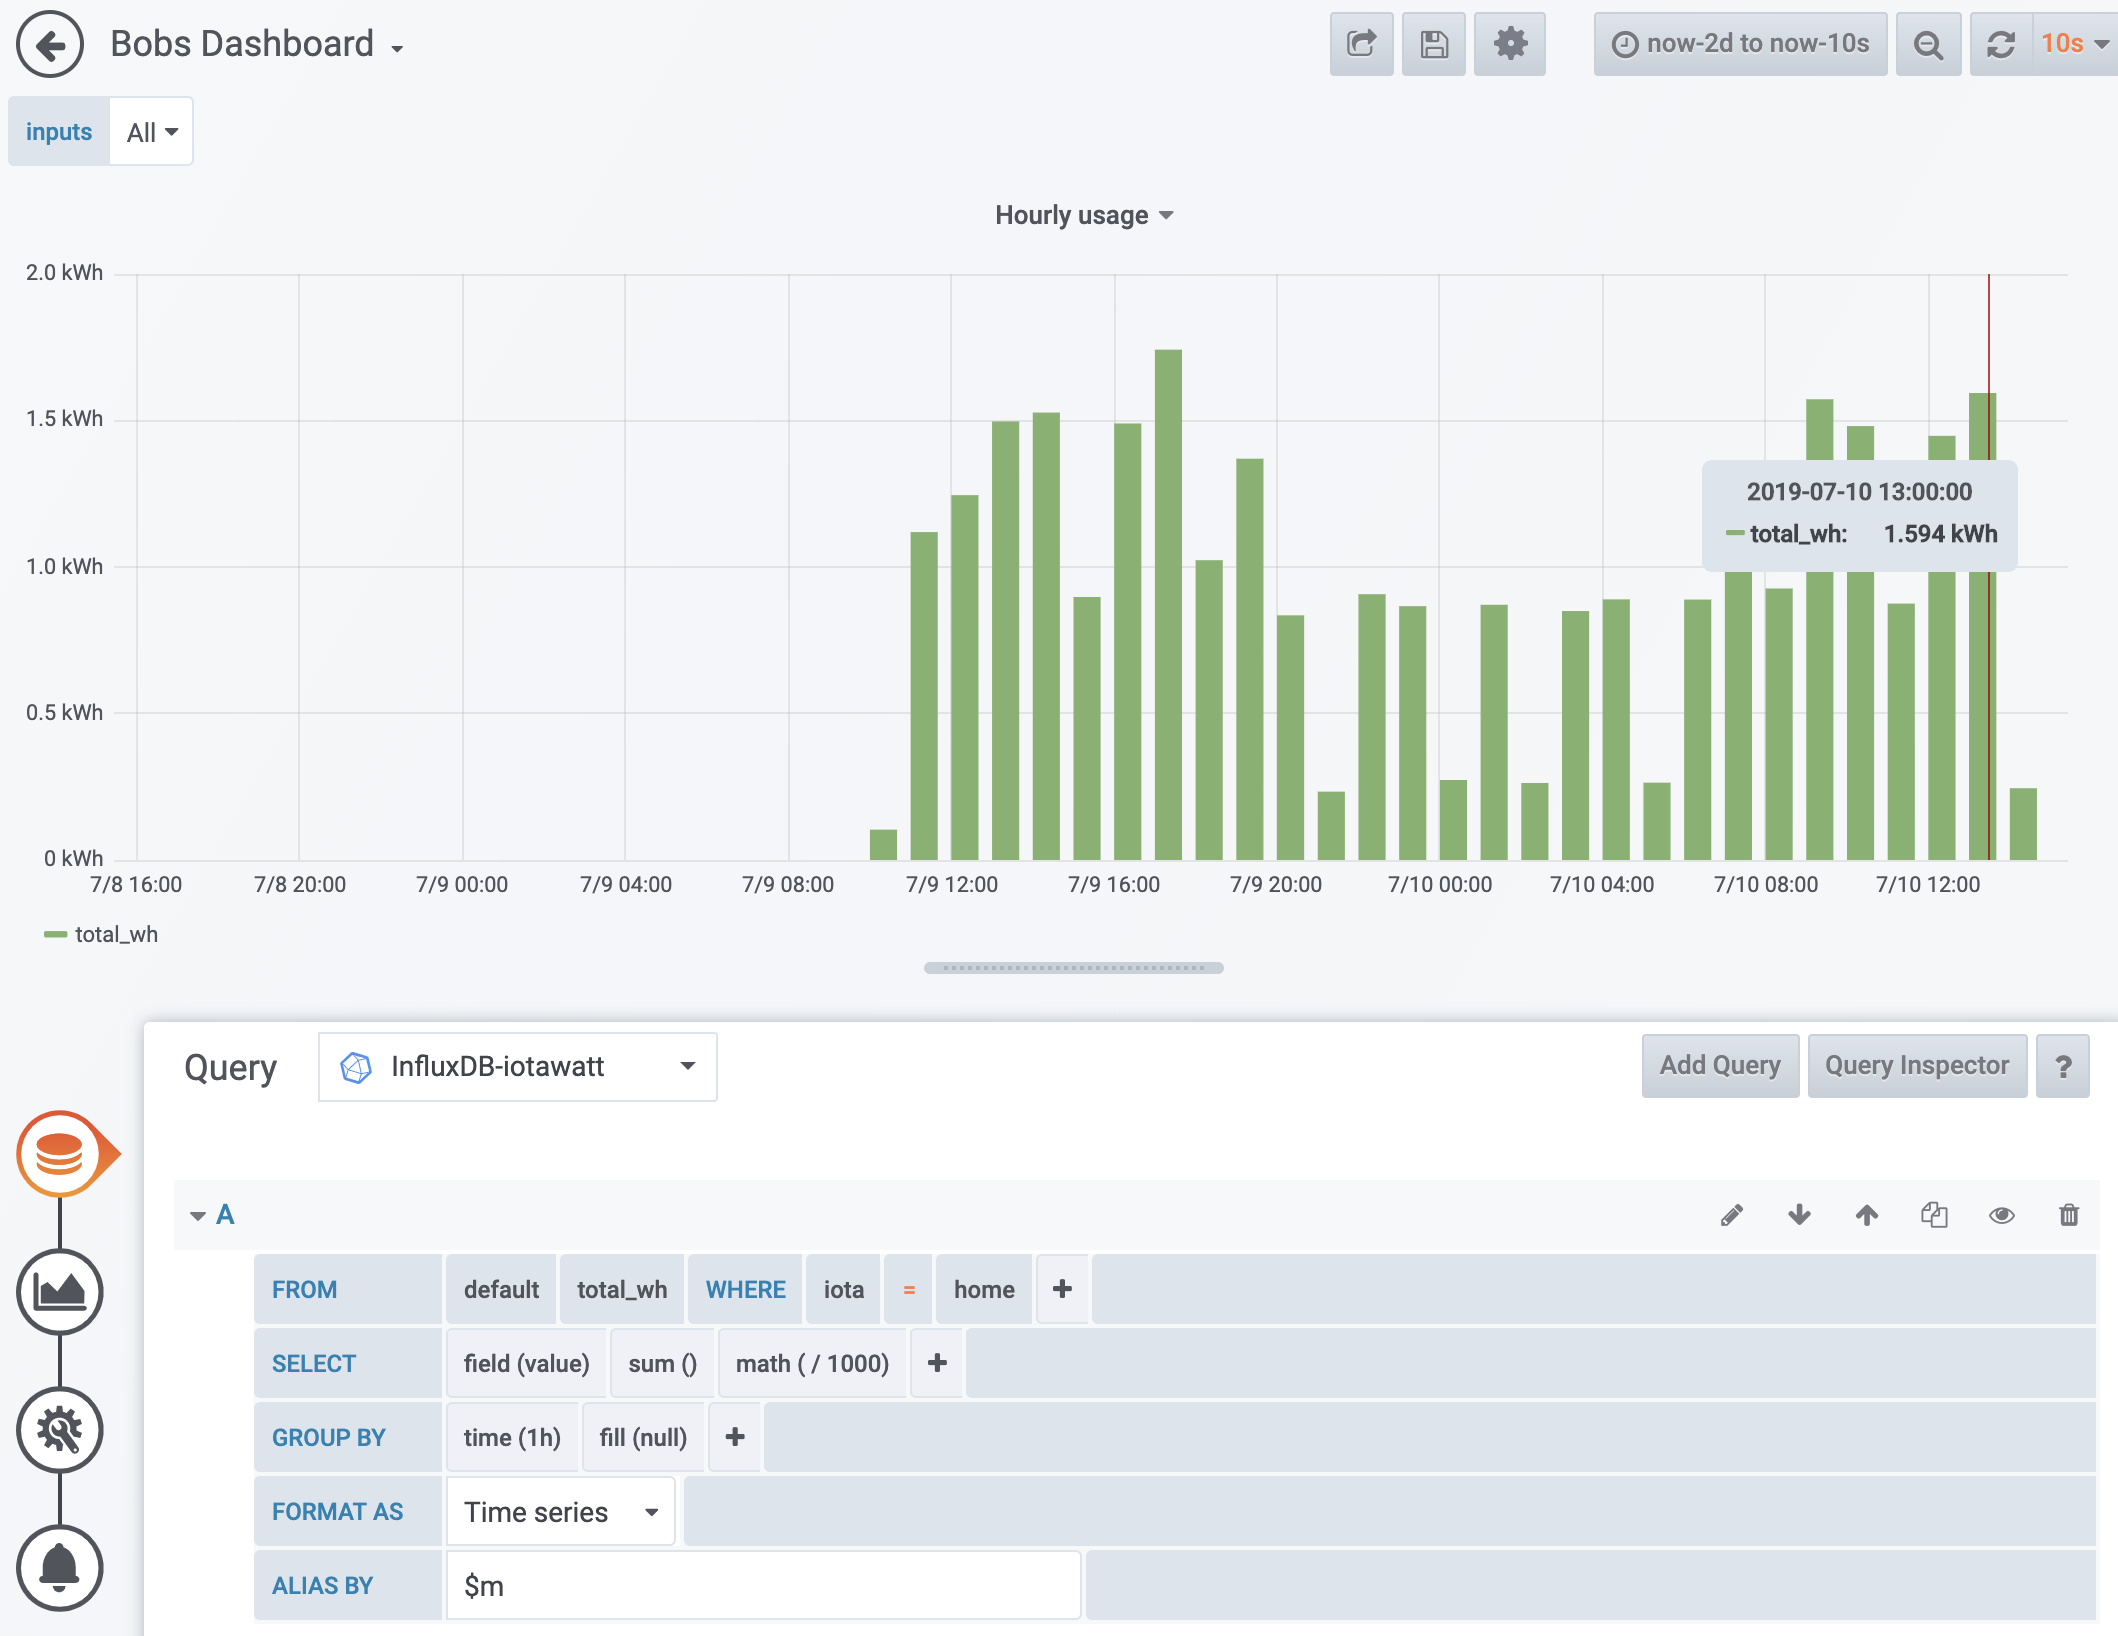
I set the Y-axis units to kWh.
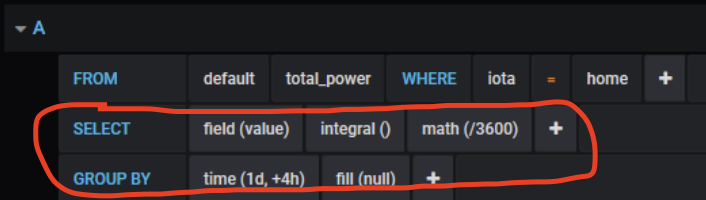
You are correct. This is what I am trying to achieve. I was just trying to copy your example and I am unclear what is going on. I am trying to wrap my head around why in your example you are grouping by (1d,+4h) using integral(), and dividing by 3600.
Thanks for your assistance. This is my first attempt at diving into Grafana so pretty clueless:)
Not sure what’s going on there. I’ll just throw out a few things I notice and see if you can put that together.
- My total_power is in watts.
- It appears your influx feed is working OK because the Wh measurements are OK.
- The example that I posted was a table, not a graph. It had a 7 day timeframe and listed the kWh each day for the last 7 days. You appear to be trying to use it in a graph, which is fine, but if I read it correctly the time window is “today”, which I think is since the prior midnight. You are grouping by day, so maybe that’s why there is no data returned in the query.
The grouping (1d,+4h) has something to do with my trying to match it up with an Emoncms display that was skewed by my time zone. Don’t remember the details.
Integral integrates Watts over time, in this case seconds, to produce Ws (Watt-seconds).
Dividing by the number of seconds in an hour (/3600) converts that to Wh.
My cable service is undergoing a wide area outage now, so I’ll probably not be on the air the rest of the evening. Hopefully, it will be up in the morning.
Bob,
I can’t seem to get any graphs to work using ‘integral()’, but when I ‘sum()’ the watts measurement and divide by 360000 or math(100/60/60) the kWh/day graph results appear to be very close to the results in emoncms and the iotawatt graphing tool, so I have no reason to complain. I also tested measurements that are being sent in Wh and kWh and all of the results are in alignment when I use sum(). If this method is working, should I be concerned that I am unable to figure out how to use integral()?
It’s seems academic at this point, so if you are happy with your alternate method, that’s what counts. If you are curious, I’d use the influx data viewer to see if you have a series called Total and what is in there. Then maybe if there is data, change the query in grafana to remove the integral and math and see if you can just plot the Total data points for a few hours.
1 Like