InfluxDb issues

The devices decided to update to the version 02_03_16.
Since that moment I get
10/05/18 11:55:40 influxDB: last entry query failed: -11

I tried to start/stop but no changes.
I also tried to reboot it…

PS:influxDb side is ok, the other iotawatt is reporting correctly

10/05/18 13:15:36 EmonService: Start posting at 10/5/18 13:15:30
10/05/18 13:15:42 influxDB: last entry query failed: -11
10/05/18 13:15:42 influxDB: Stopped. Last post 10/5/18 00:00:00
10/05/18 13:15:59 influxDB: started.
10/05/18 13:16:06 influxDB: last entry query failed: -11
10/05/18 13:16:06 influxDB: Stopped. Last post 10/5/18 00:00:00
10/05/18 13:16:12 influxDB: started.
10/05/18 13:16:19 influxDB: last entry query failed: -11
10/05/18 13:16:19 influxDB: Stopped. Last post 10/5/18 00:00:00
10/05/18 13:16:53 influxDB: started.
10/05/18 13:17:00 influxDB: last entry query failed: -11
10/05/18 13:17:00 influxDB: Stopped. Last post 10/5/18 00:00:00
10/05/18 13:17:06 influxDB: started.
10/05/18 13:17:09 influxDB: started.
10/05/18 13:17:16 influxDB: last entry query failed: -11
10/05/18 13:17:16 influxDB: Stopped. Last post 10/5/18 00:00:00
10/05/18 13:19:31 influxDB: started.
10/05/18 13:19:32 influxDB: last entry query failed: -14
10/05/18 13:19:32 influxDB: Stopped. Last post 10/5/18 00:00:00
10/05/18 13:20:48 influxDB: started.
10/05/18 13:20:55 influxDB: last entry query failed: -11
10/05/18 13:20:55 influxDB: Stopped. Last post 10/5/18 00:00:00
10/05/18 13:24:41 influxDB: started.
10/05/18 13:24:48 influxDB: last entry query failed: -11
10/05/18 13:24:48 influxDB: Stopped. Last post 10/5/18 00:00:00
Log1.txt (17.7 KB)

I tried again to start…
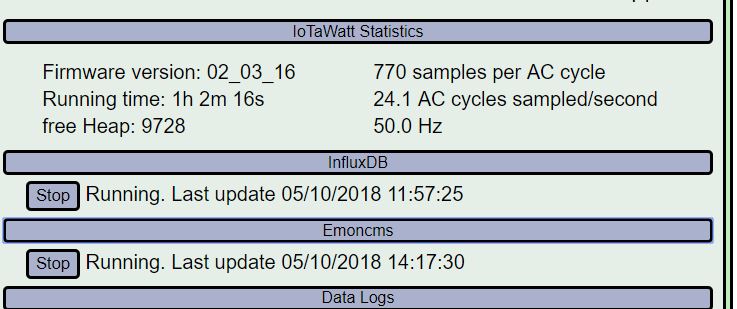
suddently it has started… but looks like that there is a heap issue…
It uploads… low heap… restart it continues…

10/05/18 14:18:41 influxDB: started.
10/05/18 14:18:42 EmonService: Start posting at 10/5/18 14:18:40
10/05/18 14:18:43 influxDB: Start posting from 10/5/18 12:25:35
10/05/18 14:19:16 Heap memory has degraded below safe minimum, restarting.

** Restart **

SD initialized.
10/05/18 12:19:17z Real Time Clock is running. Unix time 1538741957
10/05/18 12:19:17z Version 02_03_16
10/05/18 12:19:17z Reset reason: Software/System restart
10/05/18 12:19:17z Trace: 18:2, 18:3, 18:2, 18:3, 18:2, 18:3, 18:2, 18:3, 18:2, 18:3, 18:2, 18:3, 18:2, 18:3, 18:2, 18:3, 18:2, 18:3, 18:2, 18:3, 18:2, 18:3, 18:2, 18:3, 18:2, 18:3, 18:4, 18:5, 1:6, 1:3, 1:4, 1:5[21]
10/05/18 12:19:17z ESP8266 ChipID: 6902608
10/05/18 12:19:17z SPIFFS mounted.
10/05/18 14:19:18 Local time zone: 2
10/05/18 14:19:18 device name: pinguIW2, version: 3
10/05/18 14:19:21 Connecting with WiFiManager.
10/05/18 14:19:24 MDNS responder started
10/05/18 14:19:24 You can now connect to http://pinguIW2.local
10/05/18 14:19:24 HTTP server started
10/05/18 14:19:24 timeSync: service started.
10/05/18 14:19:24 statService: started.
10/05/18 14:19:24 WiFi connected. SSID pingu, IP 192.168.18.74, channel 6, RSSI -74db
10/05/18 14:19:24 Updater: service started. Auto-update class is ALPHA
10/05/18 14:19:25 dataLog: service started.
10/05/18 14:19:25 dataLog: Last log entry 10/5/18 14:19:15
10/05/18 14:19:25 historyLog: service started.
10/05/18 14:19:25 historyLog: Last log entry 10/5/18 14:19:00
10/05/18 14:19:27 Updater: Auto-update is current for class ALPHA.
10/05/18 14:19:29 EmonService: started. url:emoncms.org:80,node:pinguIW2,interval:10, unsecure GET
10/05/18 14:19:29 influxDB: started.
10/05/18 14:19:30 EmonService: Start posting at 10/5/18 14:19:10
10/05/18 14:19:30 influxDB: Start posting from 10/5/18 12:48:30
10/05/18 14:19:48 Heap memory has degraded below safe minimum, restarting.

** Restart **

SD initialized.
10/05/18 12:19:49z Real Time Clock is running. Unix time 1538741989
10/05/18 12:19:49z Version 02_03_16
10/05/18 12:19:49z Reset reason: Software/System restart
10/05/18 12:19:49z Trace: 18:2, 18:3, 18:2, 18:3, 18:2, 18:3, 18:2, 18:3, 18:2, 18:3, 18:2, 18:3, 18:2, 18:3, 18:2, 18:3, 18:2, 18:3, 18:2, 18:3, 18:2, 18:3, 18:2, 18:3, 18:2, 18:3, 18:4, 18:5, 1:6, 1:3, 1:4, 1:5[21]
10/05/18 12:19:49z ESP8266 ChipID: 6902608
10/05/18 12:19:49z SPIFFS mounted.
10/05/18 14:19:50 Local time zone: 2
10/05/18 14:19:50 device name: pinguIW2, version: 3
10/05/18 14:19:53 Connecting with WiFiManager.
10/05/18 14:19:58 MDNS responder started
10/05/18 14:19:58 You can now connect to http://pinguIW2.local
10/05/18 14:19:58 HTTP server started
10/05/18 14:19:58 timeSync: service started.
10/05/18 14:19:58 statService: started.
10/05/18 14:19:58 WiFi connected. SSID pingu, IP 192.168.18.74, channel 6, RSSI -74db
10/05/18 14:19:58 Updater: service started. Auto-update class is ALPHA
10/05/18 14:19:58 dataLog: service started.
10/05/18 14:19:58 dataLog: Last log entry 10/5/18 14:19:45
10/05/18 14:19:59 historyLog: service started.
10/05/18 14:19:59 historyLog: Last log entry 10/5/18 14:19:00
10/05/18 14:20:02 Updater: Auto-update is current for class ALPHA.
10/05/18 14:20:03 EmonService: started. url:emoncms.org:80,node:pinguIW2,interval:10, unsecure GET
10/05/18 14:20:03 influxDB: started.
10/05/18 14:20:04 EmonService: Start posting at 10/5/18 14:19:50
10/05/18 14:20:04 influxDB: Start posting from 10/5/18 13:00:10

Looks like two issues, both also existed before the update to 02_03_16:

The influx service is having difficulty querying the last entry in order to determine where to resume.

Heap appears to be degrading, possibly during influx bulk upload.

Can I see your influx configuration and your config.txt (with keys removed or by pm)

20181005_config.txt (8.3 KB)

That’s a huge configuration. I’ll need to simulate it and see where the heap is being consumed. You have said that you have another unit that is not experiencing problems. Could I see the config and log from that system please?

So I have 2 iotawatt pinguITW and pinguITW2.
The pinguITW2 is the one that got the 02_03_16 and I posted the config and log previously.
Before the update it was running since long time.

The pinguITW did not get the update (and for the moment I changed to not update),
there you have the requested info.
config_pinguITW.txt (8.5 KB)
20181005_pinguITW_log.txt (5.7 KB)

Without a doubt there are some problems here, but I am fairly certain they are not unique to 02_03_16. Both systems have issues. It’s true that by this log pingulTW.txt has been running since 9/1, and it appears to be logging and sending data to both influx and Emoncms, but there is a problem that started on 9/19 when it initiated an update to 02_03_14. That update is still pending. This is a problem that I have been struggling to diagnose. Update is waiting until all other HTTP users relinquish their use of the facility, but that never happens. Somewhere a usage token is being lost. I see this in systems that have a lot of WiFi failures, so I believe it is being lost in error recovery.

Both of these systems should have auto updated to 02_03_16 on 9/26, but they were both stuck in this lost HTTP token state. As it happens, system#2 finally restarted because of the heap problem and that’s when it upgraded to 03_03_16.

I will look first at the heap problems. Your influx configuration sends a huge amount of data to influx every 5 seconds. The influx updates are more than 10 times the size of an Emoncms update for the same data because they contain so much text. If I had the time, I would look into writing a compression algorithm to reduce the heap demand. These measurements would compress to maybe 10%-15% of the original size, but that will be a big project.

The errors with influx are primarily timeouts (5 seconds). I see that influx is on the local LAN and I’m curious what type of host. I run influx on my Emonpi and it eats up postings from 3 iotawatt posting at 10 second intervals with no such issues. It could also be a problem with large posts or responses in the query due to the long measurement names. I can check that.

Regardless of whether you allow updates to system#1, you should restart it. It may be that it won’t be able to sync with influx after that as well, but it needs to be done.

With the lost token on both of these systems, I may find new clues to how it’s happeneing, and if not, I may decide to change the way it’s done entirely because that was the culprit in Emoncms stopping for other users. I’ll get back to you later as I dig into this material.

In the meantime, I hope I have convinced you that it is not related to 02_03_16. This release contains other important updates that both fix problems and add required support for new units that are being manufactured as we speak. I don’t want to discourage users from subscribing to updates. While there is a problem here, it is not new, and if anything, more of a reason to stay on the latest release aas I work on these issues.

These are systems that are testing the limits of the firmware. They are posting unusually large transactions to both Emoncms and Influx, and doing it twice as often as most other users. As you push the boundaries of the ESP8266 I will do what I can to fix problems and expand capabilities, but in the end, it may come down to setting limits on what you can ask this IOT chip to do.

Thanks for the answer,
I temporarly stooped the update because I will leave for the week-end and I would like to avoid to have the device “blocked” :wink:

The influx database is in a docker ( samuelebistoletti/docker-statsd-influxdb-grafana/) located on a Synology DS718+.

It was again reporting regularly when it has stopped.
To revcover I had to ress restart and stop temporarly emoncmsreporting, also on this way I had some resets…

See the log 20181008_log.txt (48.8 KB)
20181008_iotamsgs.txt (145.5 KB)

I loaded your config to a test system and was able to upload to influx without the heap degradation, however when I accessed influx via the internet i did get the heap problem. This is a very complex problem because it appears the heap is being consumed at a lower level than the iotawatt firmware.

I have to say that this is a very large configuration. Posting even one 5 second interval generates more than 1400 characters of message body, which is kind of a magic number with the low level buffering. I can’t solve this quickly.

I would recommend that you reduce the number of measurements that you send to influx. Is there any reason why you need to keep track of power factors of everything? Notwithstanding the ongoing problems with local data logs being lost, you can get that information locally or from your EmonCMS postings. Reducing the size of the postings might resolve this issue.

I enabled the update on the other device and on this one when it starts to send the history from today it stops always with the data of 10:40:40…
20181008_pinguITW_log.txt (29.3 KB)

Regarding the sending, the issue you mention is somewhere related that you reach the maximal size of the physical Ethernet packet size sending? You may not change that it sends bigger packets (as we use wifi) ?
Or as alternative you can’t send it in 2 packets?

Overall I would like to get the peaks of current consumed, to know if sometimes I may reach the limits of the 40A per phase I have.
But with this comment I do not see why the 5 seconds has an influence on the size of the packet?

The last entry query is failing because of timeout. The response from that query can be as large as several K, and on my system, I discovered a problem with influx that was causing it to be 7K! That’s more than the ESP8266 can handle the way the influx support and HTTP are implemented. Bottom line is that it’s just too much for the current firmware to handle.

I bring up the physical ethernet packet size only because it does cause fragmentation of both the request and response, which requires buffering and flow control on many levels, some that I don’t have any control over. The problem where I brought that up was with a memory leak that could be caused by a problem with managing multiple buffers.

I spent a lot of time on this on Saturday, and came to the conclusion that the restart query needs to be broken down into a series of individual queries in order to support 30 or 40 different measurements. The response is just too big for the available heap. It can’t be Json parsed.

I would suggest that you remove the PF measurements and drop those measurements from your database.

This is beyond the purpose of IoTaWatt. It is not a power quality monitor. It is an energy monitor, designed to measure energy consumed. To the extent that you can get additional useful information, great, but designing to capture high resolution inrush currents isn’t a priority or even practical. I’m guessing that you are extracting watts and PF to try to get amps. That’s a long way around to get true amps and also requires rms voltage. Why not just output amps? That measurement is true rms amps and not influenced by any inaccuracy of phase shift from the derived reference.

I’m not saying that 5 second intervals influence packet size. My point is that one interval is huge and the aggregate data rate is very high with 5 second intervals.

On this case we could imagine to report measures of all 10 seconds, but transmit all 5 seconds half of the data…

I think at this point we’re talking past each other on this topic. There’s a lot going on right now with problems that are affecting multiple users. You are the only user reporting this issue. Safe to say I’m not going to be revisiting influx support for quite awhile.

I’m happy to continue to help you find a way around this problem by reducing the load, but I don’t want to get into a long discussion about how to change the influx support.

I removed all PF except the one from MAIN line… still hanging at 10:40:40

PS: Before version 02_03_16 this number of reports where working… I just hope that it will not continue to decrease while new versions are coming

That’s not true. The log showed heap problems before the 02_03_16 update.
You can set auto update to NONE.

No guarantees.

How to drop them from db?