I have my first IoTaWatt set up and I’m trying to figure out how to configure submetering. In my application, I have two sisters living in separate apartments sharing 200A service. The fight constantly over energy costs, blaming each other for running up the bill There are two load centers fed from the meter. Shared services (geothermal heat pump and hot water heater) and connected to the load center I call ‘Unit 2’. I have CT’s on that panel and the relevant circuits for shared things. I also have CT’s between the meter and the other load center I call ‘Unit 3’
What I need help with is creating a report that I can use to give the ladies to show them KwH on a daily/monthly/annual basis. I’d love to get fancy with the reports at some point to correlate degree days, geothermal system time, etc…but first things first. Right now, I’m struggling with the basics and need some pointers to get started with:
How to configure the Graph app on the IoTaWatt. It’s making some graphs, but I don’t know what I’m looking at.
If/how I should set up EMONcms instead. (I got started, but I don’t know what I’m doing with the inputs and feeds)
Where to find a simple, step by step setup guide for monitoring/metering in a way I can correlate to the bills. Since we’re billed in KwH…that’s a good start. Ideally, I’d like to translate that to $$$ because that’s all the ladies really care about.
Like the police, my first reaction is to stay away from domestic disputes
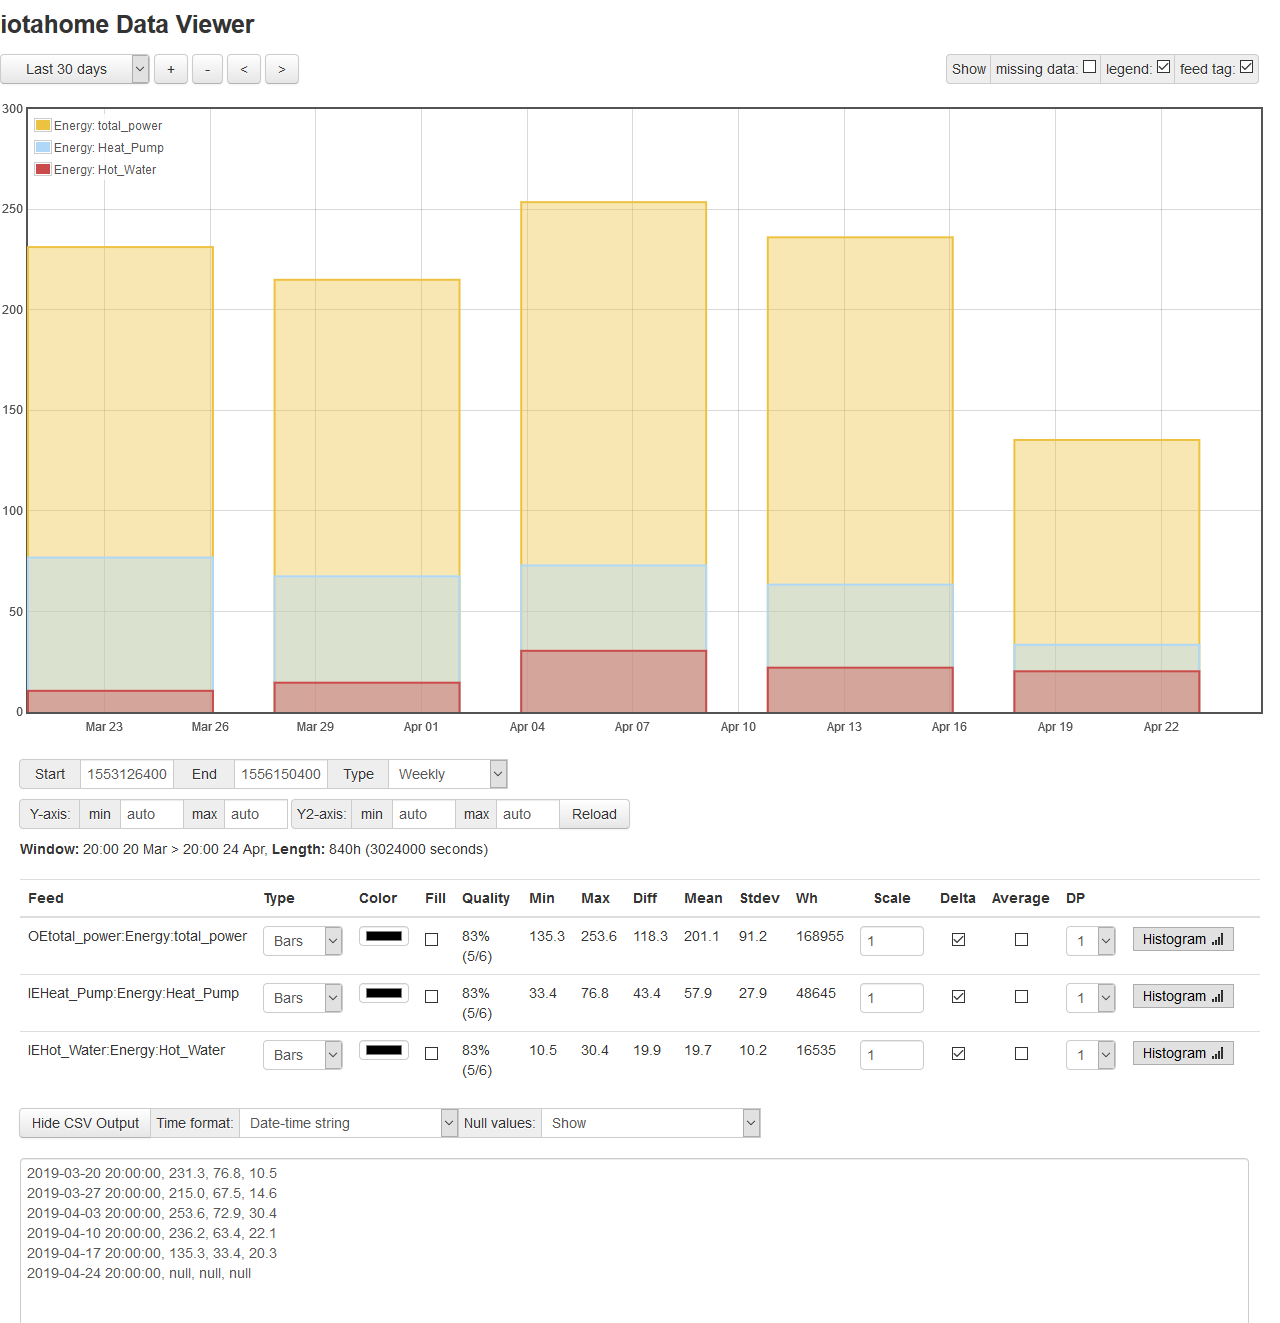
Hoping some other users with similar interests will jump in here, as there are a number of ways to approach this. The native local IoTaWatt graph program is the best way to extract data right now. I’d recommend setting the interval to day, week, or month and using the “delta” feature to produce kWh totals for those periods. You can extract the numbers using “show csv” and then cut and paste into a spreadsheet where you can factor in the rates. There is a new query API in the works where you will be able to produce .csv files directly for download, but that is a few months away from release. For now, you can develop the graph you need with csv and save it for repeated use.
Emoncms has more extensive dashboards and widgets for this kind of analysis. Once you get the inputs->feeds paradigm, it gets easier. You can get some help on the OEM forum and their “learn” section has more extensive documentation.
And btw/ seems like the lions share of the energy would go to the shared Geothermal heat and hot water.
Using the currently available local IoTaWatt graph to extract data, here is a sample with total_power, heatpump, and hot water broken down by day. Notice the “interval” is Daily, and the individual items have “delta” checked as well as “bars” for display. The csv output uses “Date-time-string” which should work as input to a spreadsheet. There is an issue with the local time offset in that the days do not start and end at midnight. They are 24 hours in duration and the new query solves this.
Thanks! This helps. I’m glad I don’t need emoncms to get started…they already want money from me. I’m not at all opposed to paying, but I’d like to know that it’s going to work before setting up a paid subscription.
I’d love to test the API when it’s ready. I’ll write a little PowerShell script on my end to pull the data and send a nicely formatted email to all parties involved I should be able to incorporate degree days doing it this way too.
There’s a really cool heat pump monitoring system at http://welserver.com that I’d like to play with. If I get one, I’ll see what can be done with regard to integration with IoTaWatt or combined reports.
Just so you are aware, if you have the equipment (Raspberry Pi) and a decent sized SD card, you can download and install EmonCMS locally and there is no fee or subscription for doing it. Have a look here: https://github.com/emoncms/emoncms/blob/master/docs/RaspberryPi/readme.md Many on the forums here have done this as we want to have a number of feeds and at ~$1 a feed per year hosted at EmonCMS, it can get quite expensive. I’m all for supporting their model and fees as hosting such does cost them and they need to recoup their service and development costs. However, I do not need to host my instance externally. You could also install it on AWS yourself if you wanted to pay for a server and storage. They have a quite strong API today and I send all my IoTaWatt and Weather (Acurite) data along with Solar Radiation (M/2) data to it as well. Shortly I will be sending my battery data via the IoTaWatt and some other battery data from the Batteries API as well via NodeRed.
I would suggest you have a look and see. It is very easy to upload all your data from the IoTaWatt and more to a local EmonCMS install. Just a thought. As @overeasy stated, I would steer clear of any domestic issues. Hope you get the reporing you need. If you have some scripting under your belt, I would think you can get the data you want directly or indirectly to run your report! Even automate it to be sent monthly, etc. So much to do, so little time to actually get it done.
Good ideas quella! I have a Pi lying around somewhere…so I’ll probably give it a go.
If I go as far as putting something of my own in the cloud, I think I’ll try Azure. They have some really interesting features like Log Analytics that some other folks I know have made good use of. I also want to learn more about their IoT hardware/software/service capabilities. I have one of their IoT prototyping kits…it’s cool, but I haven’t gotten very far with it.
I agree that each cloud provider has different offerings and I know Azure has come a long way. For something like this it might be a toss-up due to the amount of data and system requirements. As much as I would like to have remote access all the time, I use PVOutput for that, and VPN access to my local LAN for dashboards, etc. from the EmonCMS via a PI.
I have a basic ubiquity Unifi setup at each house. Setting up the VPN to tunnel in to get to the IoTaWatt was surprisingly easy. I do security now and see first hand how quickly these IoT devices become targets even if we obfuscate their location on web with high port numbers. I used to be a network engineer and VPNs were never easy for me back then LOL.
I heard log analytics on Azure is free up to a certain point. If I do anything interesting I’ll post back here and share.
 There are two load centers fed from the meter. Shared services (geothermal heat pump and hot water heater) and connected to the load center I call ‘Unit 2’. I have CT’s on that panel and the relevant circuits for shared things. I also have CT’s between the meter and the other load center I call ‘Unit 3’