I really like my IoTaWatt and wanted to post some screen shots of my setup and monitoring in hopes that other might do the same of their setup and installs. Really looking for ideas and for other users focus on what they want to monitor and how installations differ from exposed installs with a recessed panel verses a surface mounted panel hidden in a closet somewhere. See my reply’s for pic’s and feel free to ask any questions.
1 Like
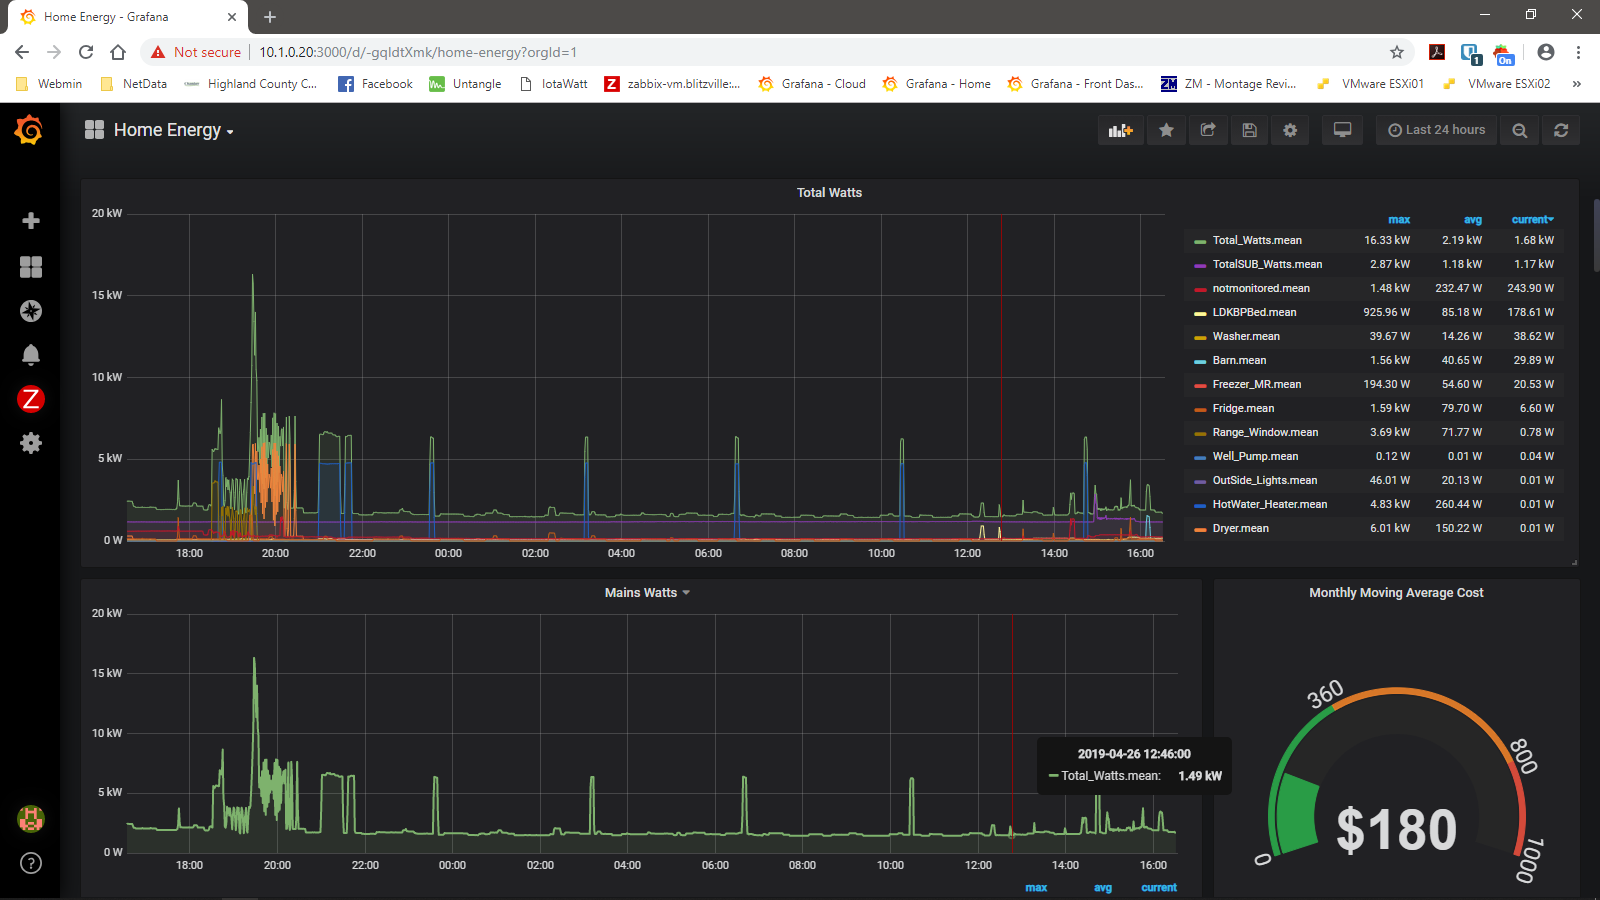
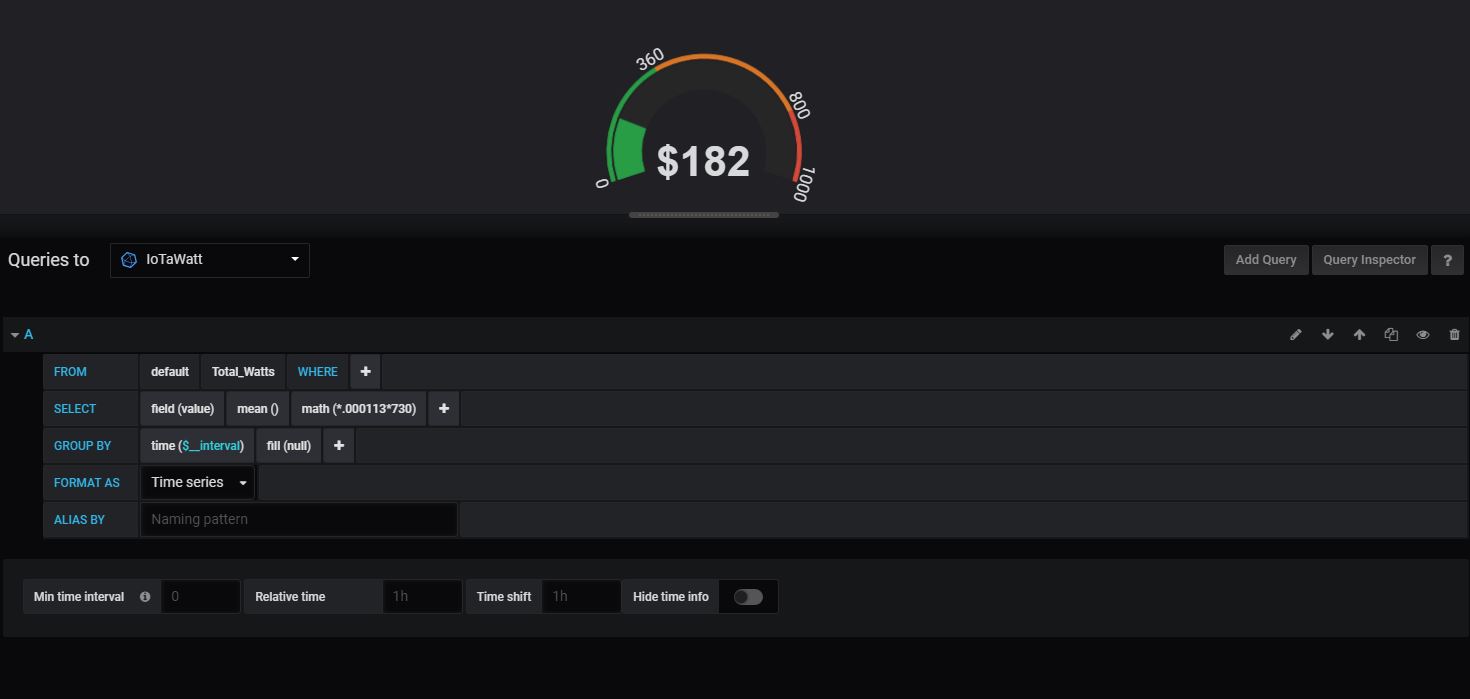
This one shows me total usage and how much my cost would be if the last 24 hours was everyday of the month.
You have me at barn lights… 
We have a small barn with horses and I have the energy being monitored for the 100a sub-panel using tone of my IoTaWatt ports. Not able to get to the lights only, but can see if lights, bucket heaters (during winter) etc. all take extra power. Able to review that over time to see how much we use on average and what some of the bigger loads in there take up.
I like the graphs and info.
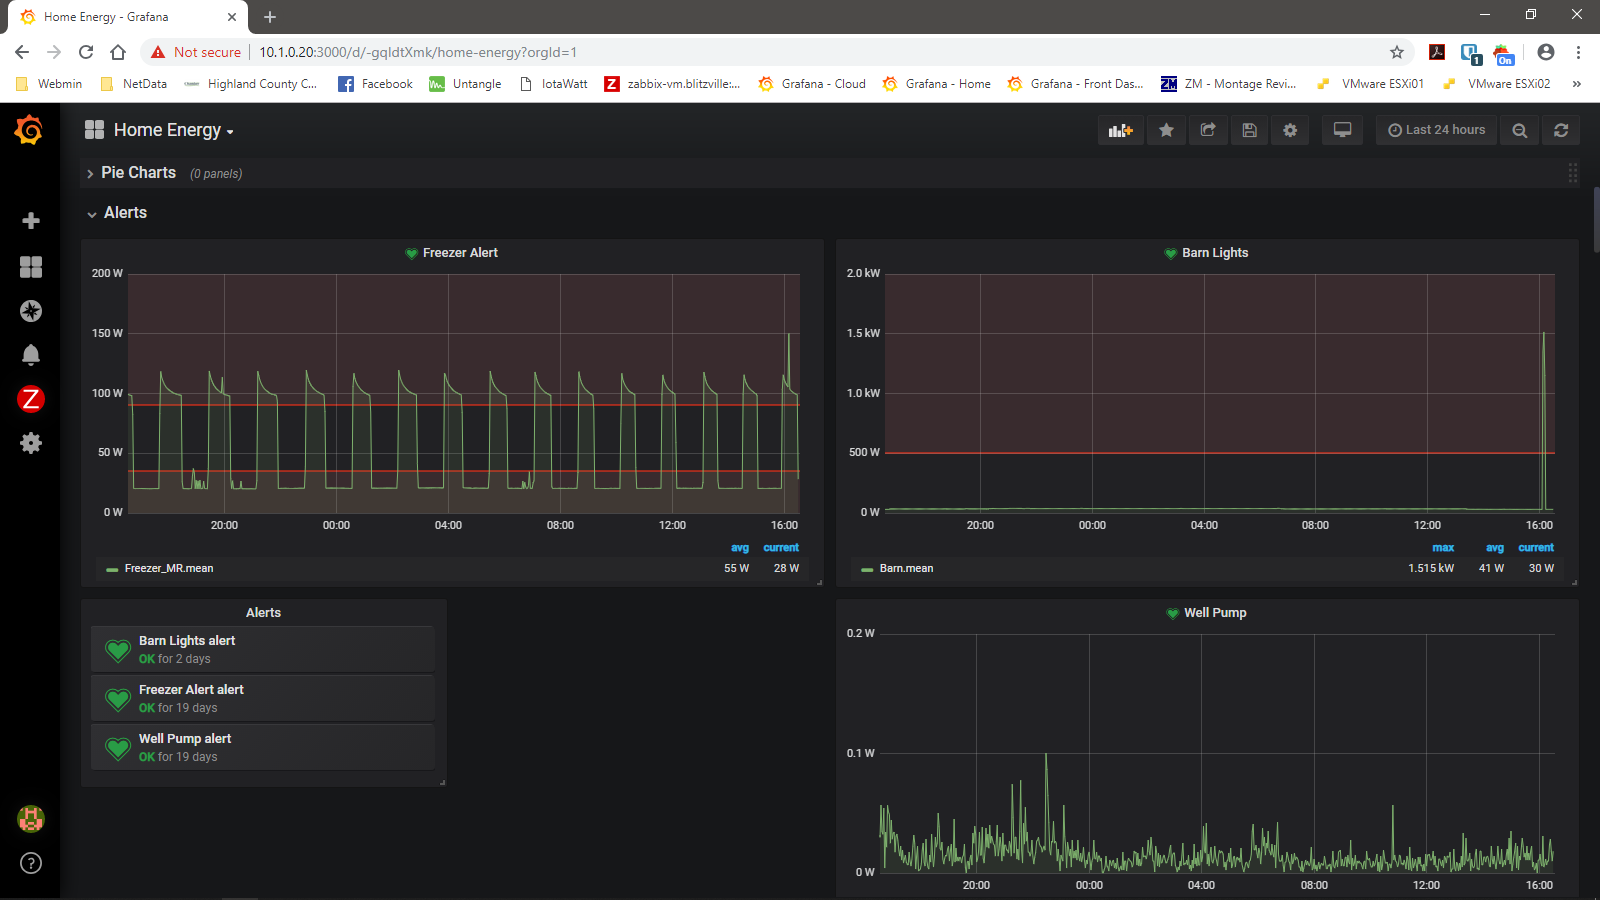
@quellaI guess this is misleading. I do it just like you but we only use the lights mainly so I set the alert called check barn lights. I had a water trough heater that wasn’t shutting off and running way to much and was costing $$$$$. Replaced it . would’ve took a while to track this down without the IoTaWatt.
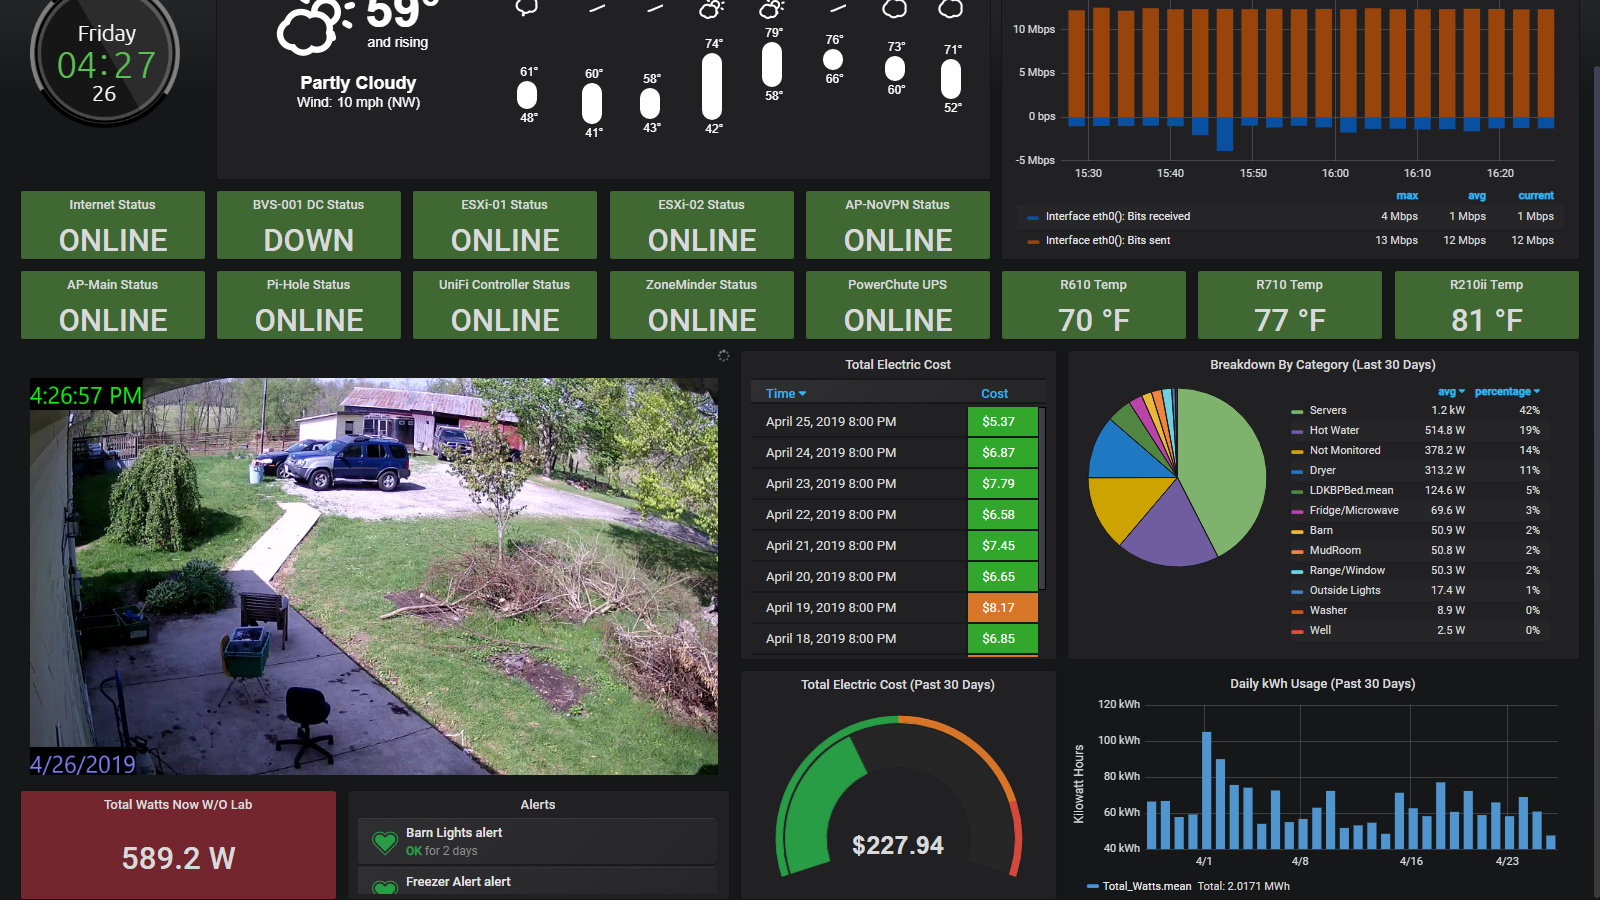
Here is a screen that hangs on the wall to monitor the whole house (partially right now) At a glance I see the time, weather, Internet usage, Live view of the front door and my electric monitoring. Soon to come will be water usage. Ignore the front yard… In the middle og some yard work.
3 Likes
I recognize the grafana above, but have never seen these elements integrated into a grafana dashboard. Is the last one something else?
I would say get the yard cleaned up and install some solar panels to make up for the ESXi server running… Very nice graphs and data. I’m envious sweet setup.
@overeasy Yes this is all Grafana. I use Telegraf to collect the snmp data from servers and Ajax for the live feed.
2 Likes
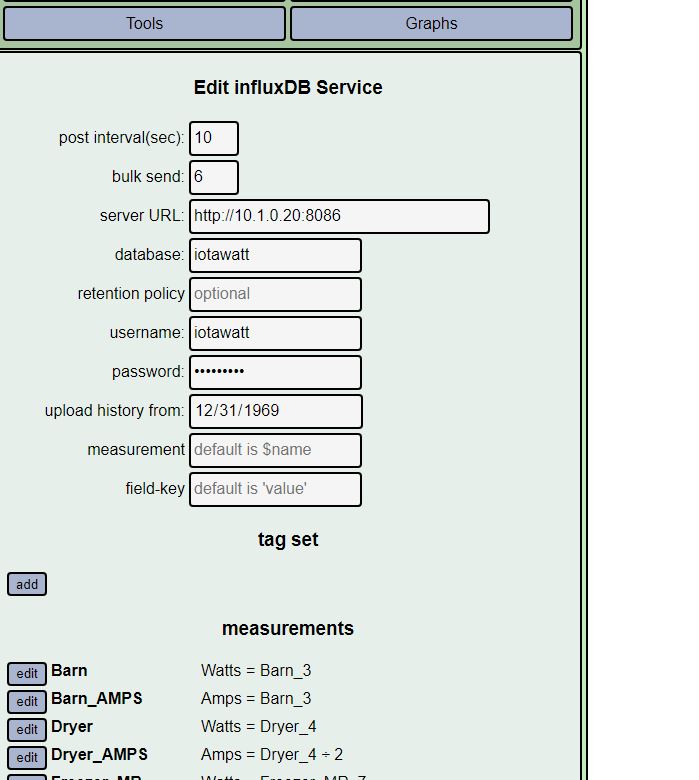
Hi @blitz1986 , thanks for the screenshots of your Grafana Dashboard, looks fantastic. I’m interested in how you configured the Iotawatt Influx service and the individual elements in Grafana, e.g. the alerts (didn’t know that was possible). Would be great if you could describe that!
@blitz1986 would also love to read more on how that dashboard is achieved. That’s my goal one day too. Thanks for posting.
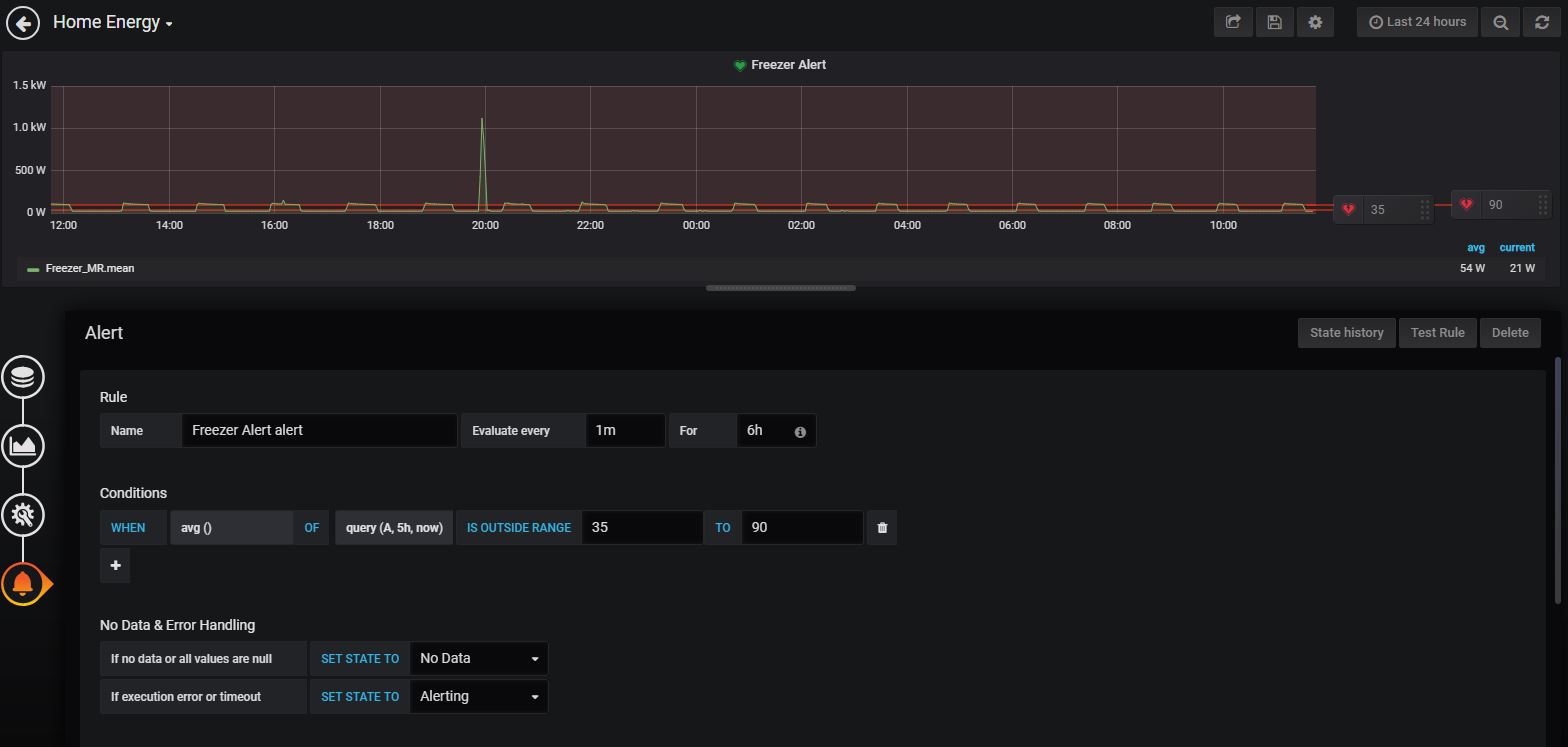
See attached pic’s. For alerts there is a configuration tab on the single stat queries. A little math will give you cost… Telegraf is not used in the IotaWatt setup. I do use telegraf but not on this. Let me know if you want to see something else or step by step.
2 Likes
Also I label stuff like freezer but other things can be on it too like seen above a spike was when I plugged a power washer in the same outlet. But still label it freezer and if I get an alert will I’m running the power washer I know to ignore it.
Step by step would be very helpful 
1 Like
I will be doing some videos in the near future and will include a couple setting up alerts and whatever else anyone wants.
3 Likes
I have to ask what software are you using with the pics above also what hardware are you running it or is it cloud based it looks awsum
I have the Iotawatt send data to Influxdb to store it and use Grafana to pull the data from there. Grafana has lots of options and settings. This all runs on a Rpi 3. The Pi also has a wireless access point configured on it and the itowatt connects directly and then cable from the Pi to my network. On more thing is Openvpn server is configured on the Pi for accessing from abroad. I’m amazed at what the Rpi can do.