I looked at the picture again and saw that you were using a multiple power outlet. Can you please measure the voltage to L1 directly in the socket without the multiple plug socket? I suspect a problem with the multimeter. Because a voltage drop of 97 V would mean a power loss of 97 V * 10 A = 970 W if you operate a device with approx. 2 kW via this socket. The line would have to get pretty hot by now. Also the voltage drops of 7-17 volts directly in the fuse box seem to me clearly too large. Do you have any other multimeters you could use for comparison?
When I measure the voltage between MAIN_L1 and where VT_L1 is I have those 97V.
As reported below at the exit of the fuse where VT_L1 is and the MAIN_L1 I have 17V.
But if I measure the VT_L1 and VT_N I have 233V.
I tried to make the same measurement for L3 and a wall plug, there I have 37V.
Unfortunately I do not have a second one (I normally work at home, next time I go to office I can take another one).
While I can’t explain the 97V, all of the other voltages are what I would expect between three typical phases.
L2-VT and L1-L2 are both 403V, so relative to L2, L1 and VT are at the same potential and phase. There no doubt is an explanation for the 97 volts, but I don’t think it’s the problem we are trying to solve. The IoTaWatt is getting 230V between VT and N and the phase seems correct relative to L2 and L3.
I’d like see a purely resistive appliance connected to the VT power strip, with the other power meter inline, and an SCT013 CT from the IoTaWatt. I’d expect the IoTaWatt and the other power meter to agree, and the power factor reported by IoTaWatt to be 1.00. If we can achieve that, we can move that resistive load to another phase and try to do the same there.
Test of toaster with L1:
Fuse where power strip is connected:1067 Watts, pf: 0.99 (147 Watts pf. 0.69 without toaster)) DeltaWatt=920
MAIN_L1: 1665 Watts, pf: 0.74 (755 Watts pf. 0.52 without toaster) DeltaWatt=910
Test of toaster with L3:
MAIN_L3: 1140 Watts, pf: 0.85 (200 Watts pf. 0.27 without toaster) DeltaWatt=940
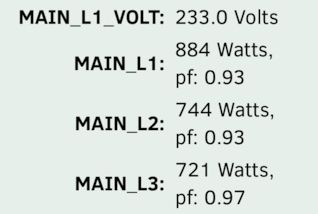
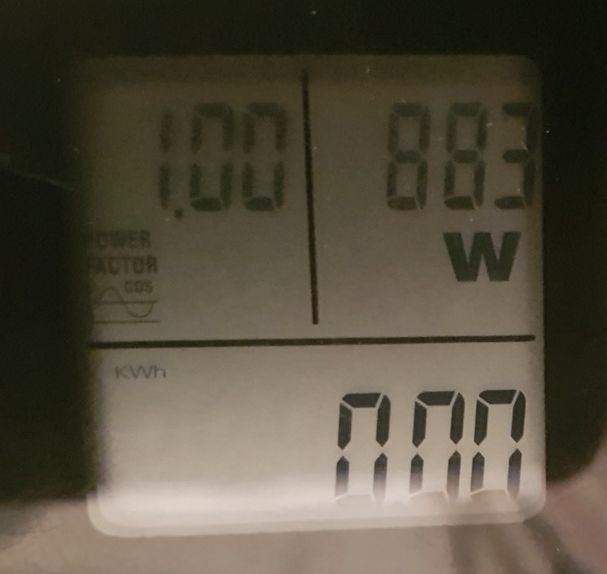
For both the Power Meter reports 887 Watts pf1.0
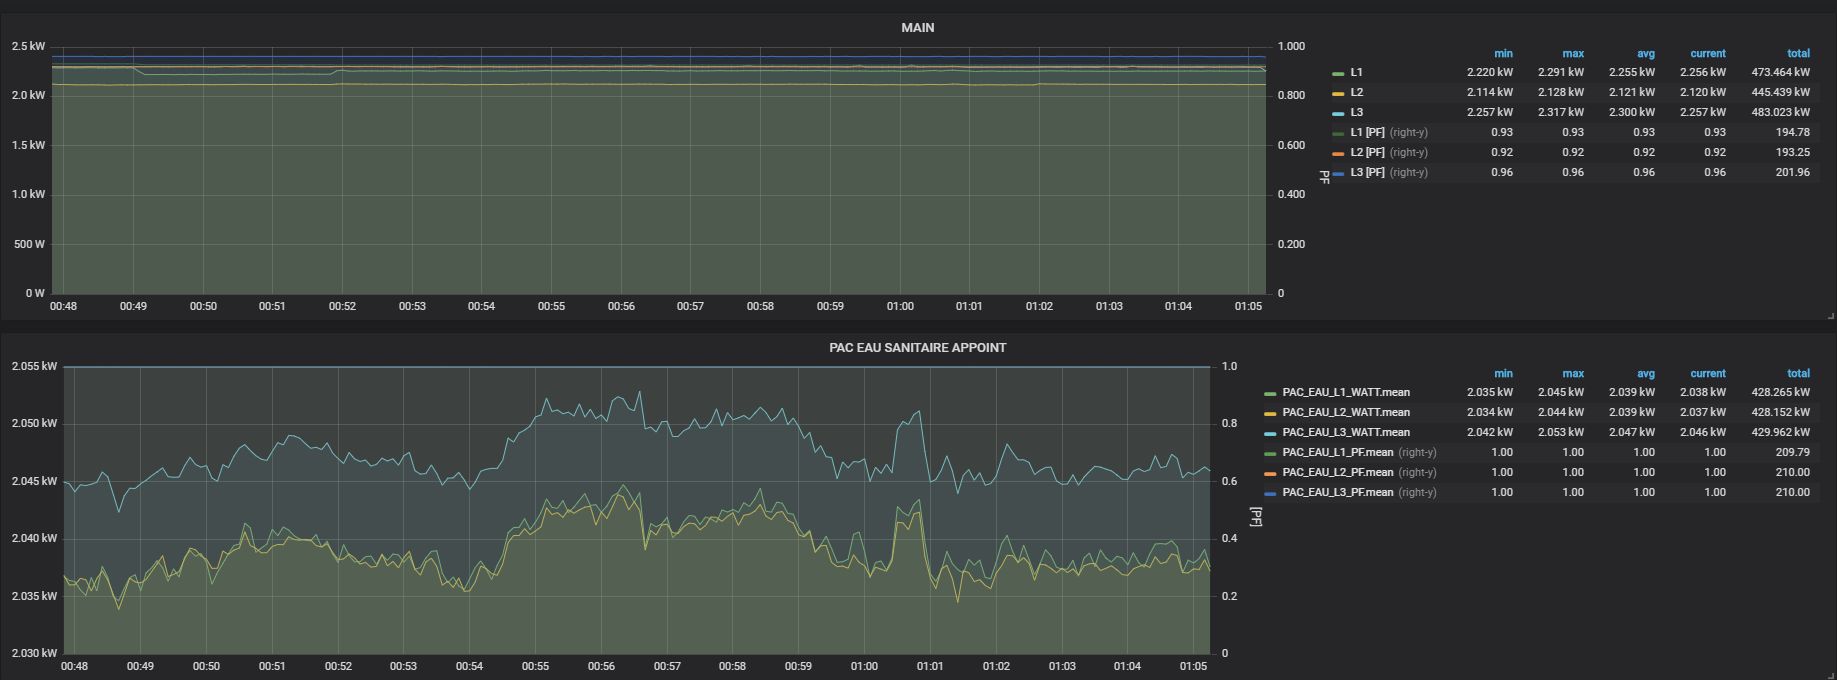
By itself, this looks pretty good. You have both the mains and water-heater measured at the same time, so does that mean some of these measurements are using SCT006? I have low confidence in those at low current, mostly because of the phase shift characteristics. Nevertheless, in the center of their range, they seem to be working pretty well.
It looks as if the water heater is drawing an extra 10 watts on L1. That’s within 0.5% of reading so it could just be the CT. I’d have to know if it’s wye or delta to speculate any further.
So the question that remains is why the very low power factors at low power? IoTaWatt doesn’t report PF for power below 60 watts. It’s just not accurate enough at low current. The 60 watts was developed using observations of 120V loads in the USA. At230V, the equivalent cutoff should probably be 120W. But even then, you have some very low PFs.
It would be helpful to try to identify some of these small loads, but also it might be useful to just take a direct look at it. You can obtain a set of samples for a CT with the following command:
iotawatt.local/command?sample=<input> where is the input channel number.
This will return a set of about 775 voltage/current pairs in your browser window. If you cut and paste that to a spreadsheet and note the power and pf that was reported, I can plot the points and get a look at the signals. Maybe you just have some kind of funky old power supply that produces tons of reactive power.
Another thing I was wondering is whether you have a solar energy system and if so, what type of inverter(s). It’s probably in the configuration that you provided, but my French isn’t good enough to recognize technical abbreviations accurately.
There you have the excel (just remove .txt, I had to add as not allowed to load xlsx):
20180629_inputMeasures_1 .xlsx.txt (32.9 KB)
I can focus is L2:
there I can nearly switch off all easily (except 3xSONOS Play1 connected via ethernet, and the Heat Pump L2)
When all the rest should be off I have reported:
- MAIN_L2 5W, pf 0.01, 3.48Amps
- Heat Pump 13W, pf 0.02
I switch on pure resistive eating of the water pipes:
MAIN_L2: 237 W 0.28pf, 3.66Amps
TUYAUX_EAU (Water Pipe): 240W, pf 1.00
PS: I do not know if important, on my setup I have the Lx going through for example to KNX switch actuators…
PS2: The MAIN_L1, MAIN_L2 and MAIN_L3 are monitored with SCT013, the other SCT006
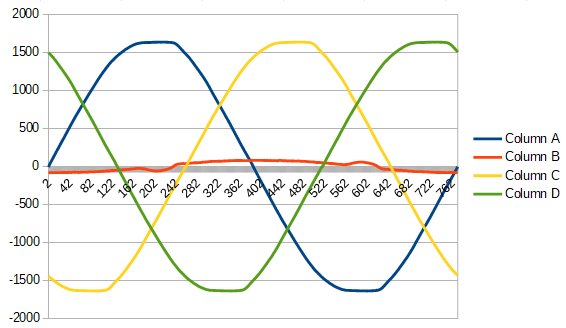
Here are the plots:
L1
L2
L3
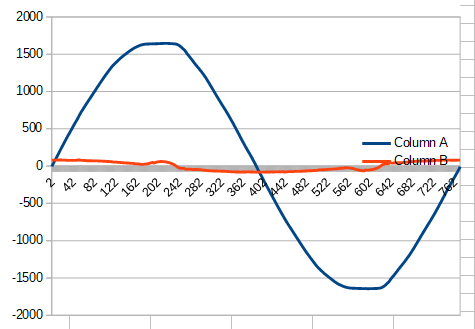
L2 is a good one to focus on. It appears to have a pretty normal sinusoidal curve for the power. But that plot above is the L2 current vs the L1 voltage and phase. Now I’ll add the “derived” L2 and L3 voltage curves:
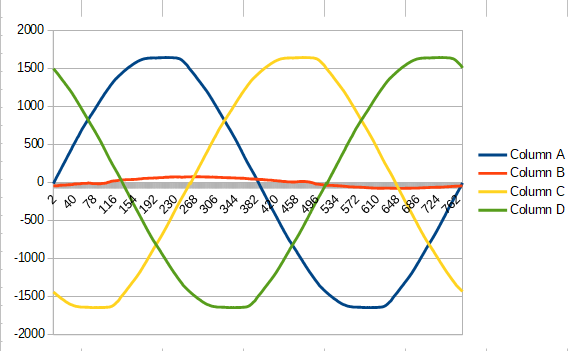
Looks like the best match is the green L3. It crosses zero at the same place but appears to be 180° out of phase. So I think the CT that is on L2 should be reversed and assigned to derived phase C.
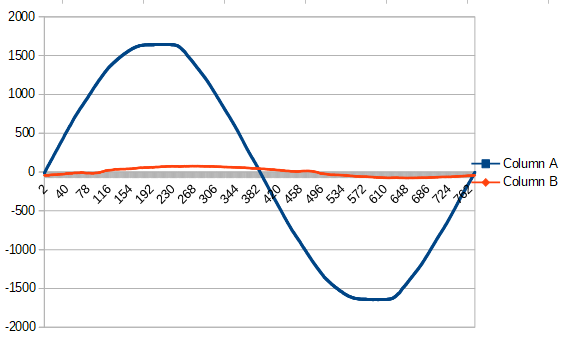
Here’s “L1”
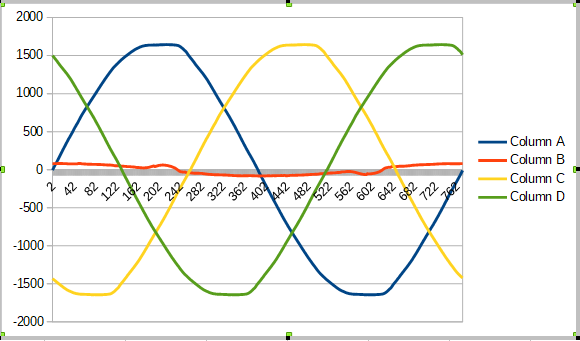
No way it’s in phase with the “L1” voltage. It appears to be more in tune with phase B, but again reversed.
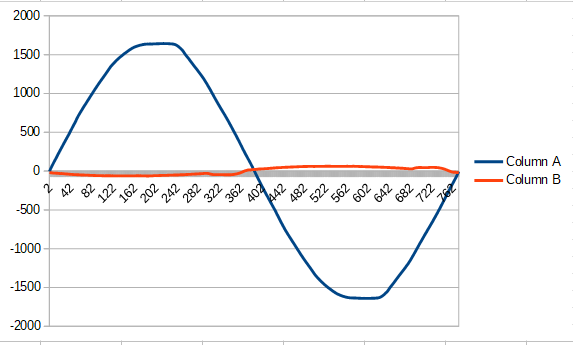
Finally, here’s L3. I’m guessing phase A reversed:
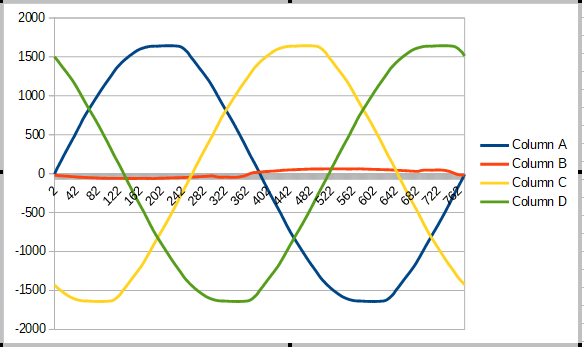
Sure looks like it.
So speaking strictly about the mains, and going by the labels assigned to the sample sets:
“input 1” assumed to be your L1 currently assigned to phase A
“input 2” assumed to be your L2 currently assigned to phase B
“input 3” assumed to be your L3 currently assigned to phase C
I think your either your VT needs to be reversed (I think you can do that with a Euro plug?) or all three SCT013 on the mains need to be reversed.
Then I think
input 1 should be assigned to phase B
input 2 should be assigned to phase C
input 3 should be assigned to phase A
I may have made a mistake in this solution, but the current setup is clearly wrong. If you try what I suggest, we can take it from there.
1 Like
In a first time I interpreted the proposal of change to simply change on input 1,2,3 the assigned phase and turn the VT plug, I did it and the PF are looking good, but the power consumption measured is nearly 4 times more.
In a second step I said, uh the VT shall be placed at phase A, I tried to move it to the same as input3, but again the low power factors.
PS: could you provide me the excel you did for the graphs?
PS: how you where able to put togheter the sinus? A did 3 different measurements, and therefore not alligned, one after the other…
I can’t comment on that without seeing the data. Are we talking 210 is now 840 or is your water heater now using four times the nameplate rating? I think it’s likely the power reported before was very understated.
This gets very confusing very fast. I think I made the point before that there are a LOT of variables here. I don’t know what you mean by placing the VT at phase A. With derived reference, the VT is by definition phase A. They are all relative. If you look at it as a big circle, you are simply jumping in at your L3 as phase A, then going around to L1 as phase B, then further around to L2 as phase C. If you want to have L1 as phase A, you would need to plug the VT into an outlet that is on L1. You seem to be on L3 right now.
20180629_inputMeasures_1 .ods (312.1 KB)
It’s a LibreOffice spreadsheet.
cut-and-paste - call me old fashioned.
Those are three different graphs, each based on one of the columns in your initial sheet. Each column was a comma delimited pair, so I had to wash them though notepad to parse the voltage and current entries. Then I generated the phase B and C curves by simple cut-and paste of the voltage column.
The sum of L1,L2 and L3 power is 4 times bigger then the value I see on the actual power consumption on the official counter.
but if I
On this case I assign the input 1 to phase B, therefore the VT is not anymore at phaseA ?
I don’t know anything about that. Lets concentrate on things that you can reasonably measure. If you connect a load through that other meter that you have, what happens when you turn it in and off? Does one of the inputs 1-3 increase by the amount measured by the other meter or does it increase four times? (and what happens to the official counter? Is it 4 times or 3.6?)
The VT is, by definition, at phase A.
phase A, B, and C are relative phase indicators that IoTaWatt uses to “derive” an unknown voltage/phase reference from a known voltage/phase reference.
phase A = VT
phase B = VT + 120°
phase C = VT + 240°
…
It just goes around and around. You see L1, L2, and L3 as a linear progression. It is a never ending circular progression. Take any phase reference, and the other two will be +120° and -120° (or +240° same thing!).
You are confusing the L1, L2, L3 with the phase A, B and C that IoTaWatt uses. They are just labels to indicate the phase relative to the VT. Whatever input the VT is on becomes phase A. The others follow along as you complete the circle.
I realize that you believe that the VT is connected to L1=input1, but unless your speadsheet samples were incorrectly labelled, my money is on L3=input3.
This is the point where I wanted to come, I have no problem to assign the input3 to PhaseA,
BUT on this case the VT has to be moved because it is currently on the same phase as input1.
C[quote=“daniweb, post:33, topic:167”]
This is the point where I wanted to come, I have no problem to assign the input3 to PhaseA,
BUT on this case the VT has to be moved because it is currently on the same phase as input1.
[/quote]
I thought you did assign input3 to phase A, and the power factors became reasonable and real power increased. The problem you were having was that you now believe the real power being reported was too high.
There is no way to improperly configure the phases that will result in doubling the power, much less quadrupling. So there is another dilemma.
So again, Without changing ANYTHING from where you left off, can you perform the experiment that I described and report the results.
Edit: the object of the experiment that I described above is to test the solution. If the VT is indeed on input1, and the samples that you sent are correctly labeled, then the samples were taken with a very highly reactive load and there is a different solution. You did not answer my question about the magnitude of the power being measured quantitatively (the data), so I do not know.
This would be a simple problem to solve with a single-phase large resistive load, but we are doing it the hard way.
I did what you asked on the setup, just exchanged the assignement of inputs1-3.
Reported consumption without toaster:
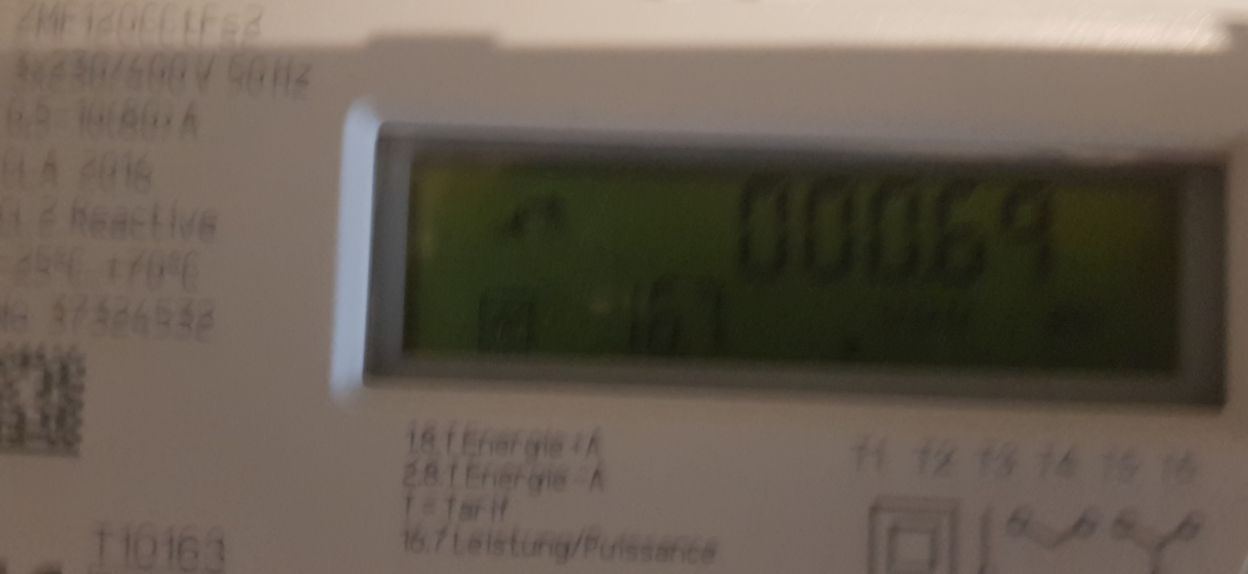
IoTaWatt total consumption: 2787 W
Official Counter: 690 W
WIth Toaster:
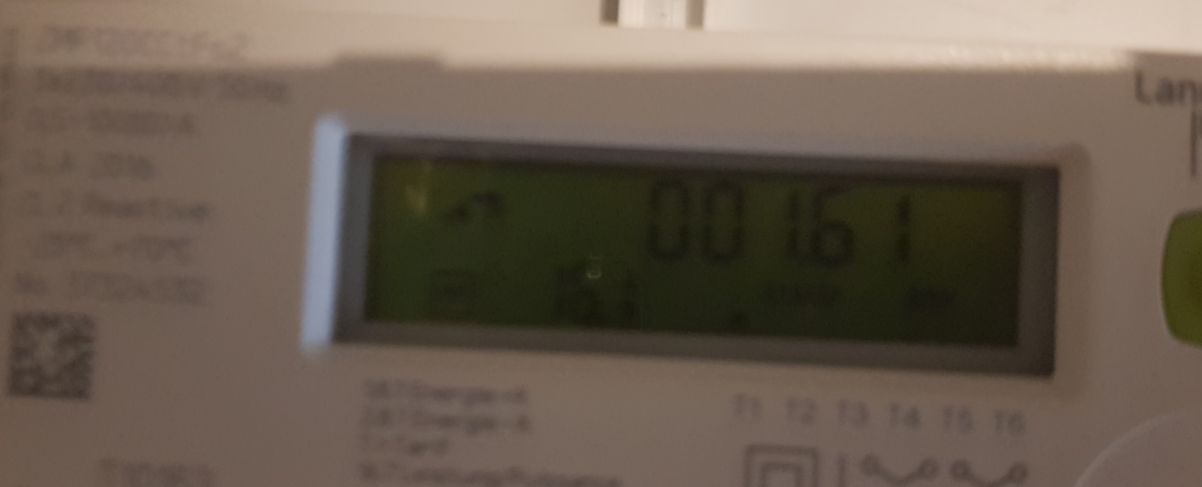
IoTaWatt total consumption: 1861 W (Delta -926)
Official Counter: 1610 W (Delta 920 W)
Toaster Plug Meter: 883W
Again measured with those settings:
20180630_inputMeasures_2_BCA.xlsx.txt (33.8 KB)
Those measurements are the same as the others except that the VT has been reversed:
I would like to see the L1 samples with the toaster load.
BTW/ You should now be able to upload xlsx directly.
Those measurements are the same as the others except that the VT has been reversed:
As you suggested, I changed the assignment of input1 to phaseB, input2 to phaseC and input3 to phaseA. And yes I turned VT
The original question was whether the low PFs at baseload were accurate. So looking at the plots of current vs voltage, I had you assign the inputs to the phases that best aligned with the current, and would yield the best power factor. Occam’s razor.
You did this, and reported the power factors did improve, but you believed the power was too high.
You performed this experiment with the toaster, which demonstrates to me that your baseload is very reactive.
One of the reasons that I doubted the original settings was the report here that IoTaWatt measured deltas of 910 and 940 watts with the toaster, while the Power Meter reported 887. That’s about 4% off, and IoTaWatt is generally better than that.
Now I can see by this post that the Official Counter is the same as IoTaWatt and it is the Power Meter that has a different opinion.
So I am inclined to reason that the original setup:
L1=input1=phase A
L2=input2=phase B
L3=input3=phase C
with the VT in the original position (not reversed)
Is more likely correct and yields the expected delta watts with the toaster. The plots of the samples show a highly reactive base load, which accounts for the low power factors.
Derived phase reference can result in some inaccuracy in the power factor of measurements on the derived phases B and C, but it is exactly the same as a single-phase installation with respect to phase A, where there is a real VT. So that you have low power factor there as well indicates to me that it is, as they say, what it is.
Understand that at low power, power factors are not measured as accurately. The real question is how well IoTaWatt tracks the “official counter”.
So I would say to put it all back as it was and compare the kWh used over a few days. To do that, take a kWh reading from your “official meter”, then use the graph app in IoTaWatt to display the MAIN-L123_WATT in the ENERGY tab on the left. Here’s what my total_power looks like:
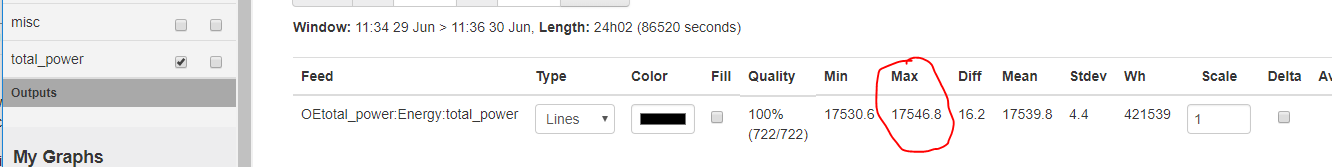
Record the max reading with your “official counter” reading.
Start a log for a few days and see how it compares, then report the results and we’ll take it from there.
Thanks, done and I will inform you.