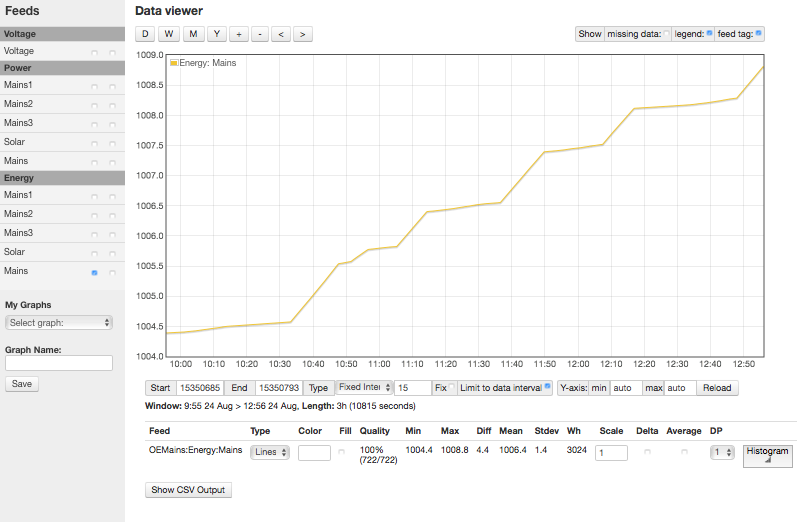
Not too clear on that 10:00 check in time, but over a few days, should not matter
EmonCMS calculates dailies and kwhd at GMT which for us is +10 or 10am so by measuring the meter then then I can get dailies that should line up. Once we get agreement between meter and iota watt then this can go away.
Looking at the graph/delta, it appears iota watt does the same and as all my readings were taken at 10:00. This gives me a consistent time (that appears to line up with the software/reporting).
Post the data after you get back on the air.
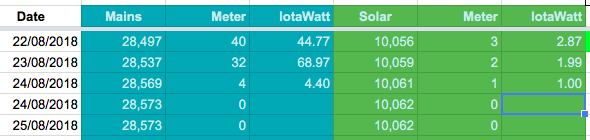
Here is the data for the last 3 days - this now give us 2 prior days of clean measurement.
I can go further back if needed but didnt think it was useful as we did a stack of testing and changed CTs so its not going to be particularly accurate.
| Date |
Mains |
Meter |
IotaWatt |
Solar |
Meter |
IotaWatt |
| 21/08/2018 |
28,454 |
43 |
49.79 |
10,052 |
4 |
2.21 |
| 22/08/2018 |
28,497 |
40 |
44.77 |
10,056 |
3 |
2.87 |
| 23/08/2018 |
28,537 |
32 |
68.97 |
10,059 |
2 |
1.99 |
Notes:
a) The meter readings are a bit lower and closer to what I would expect. That said the AC off at the meter for 20 hours a day and Sauna not used so this is basic house+oven+hws etc.
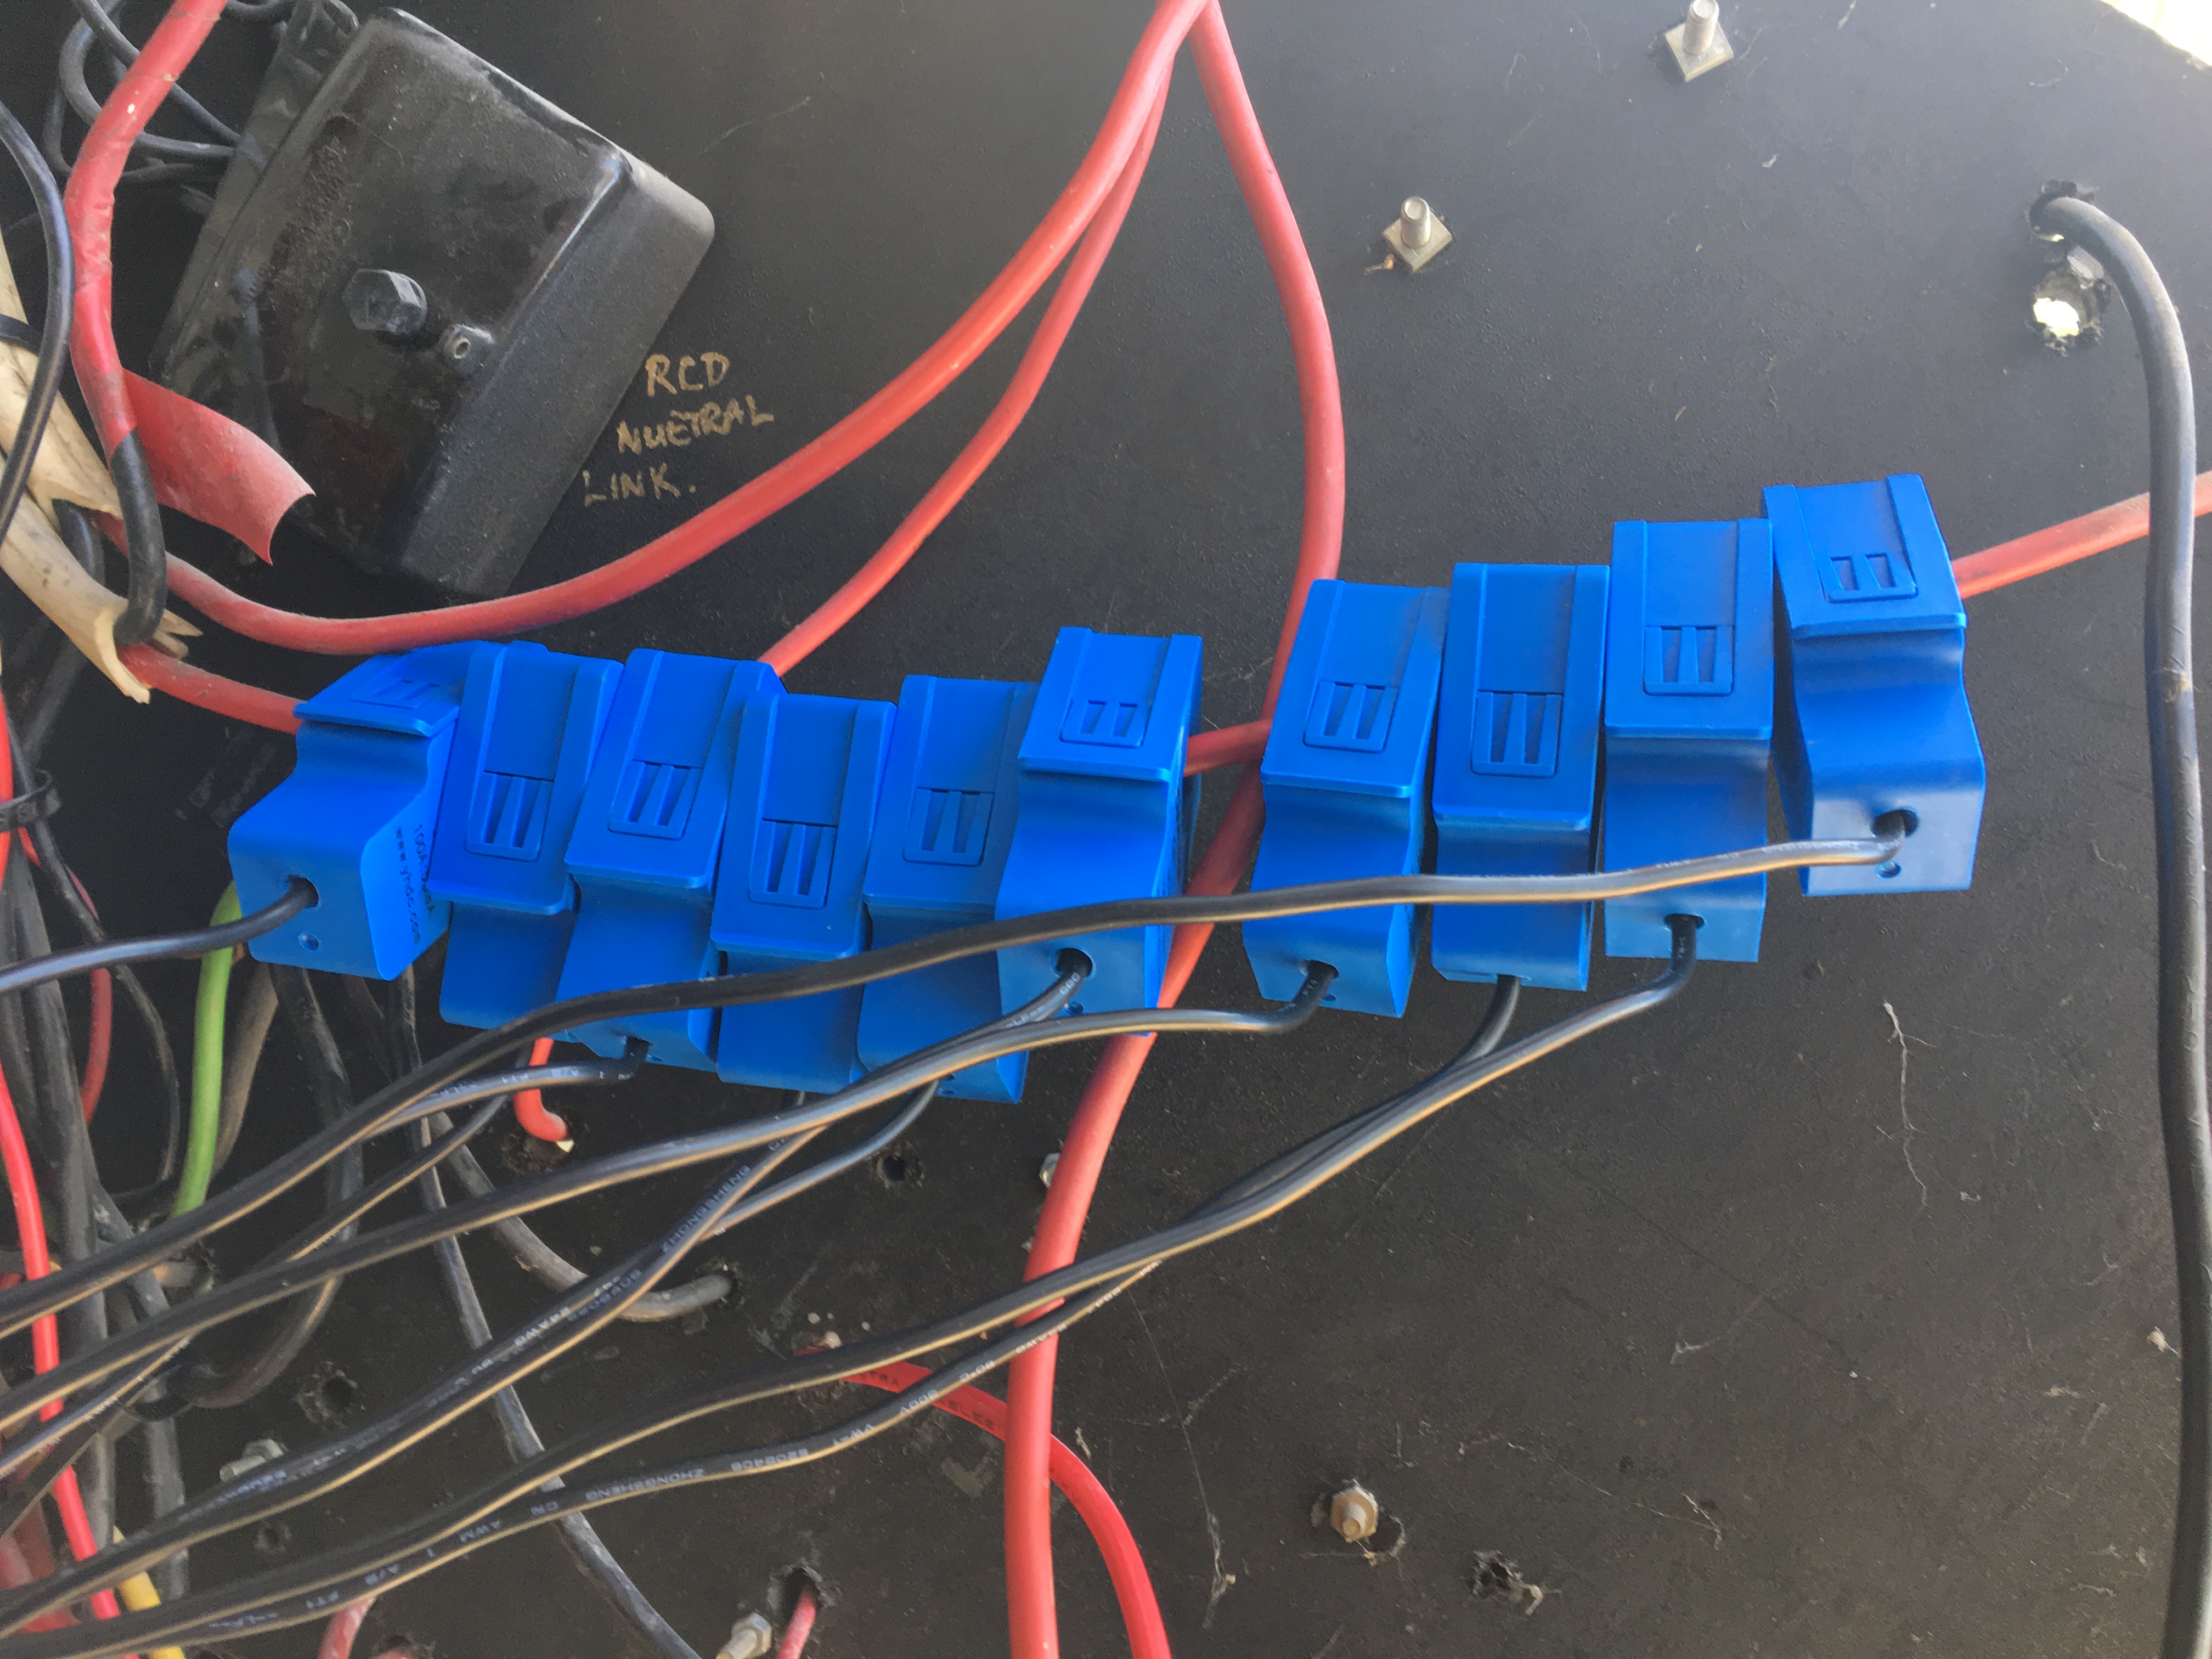
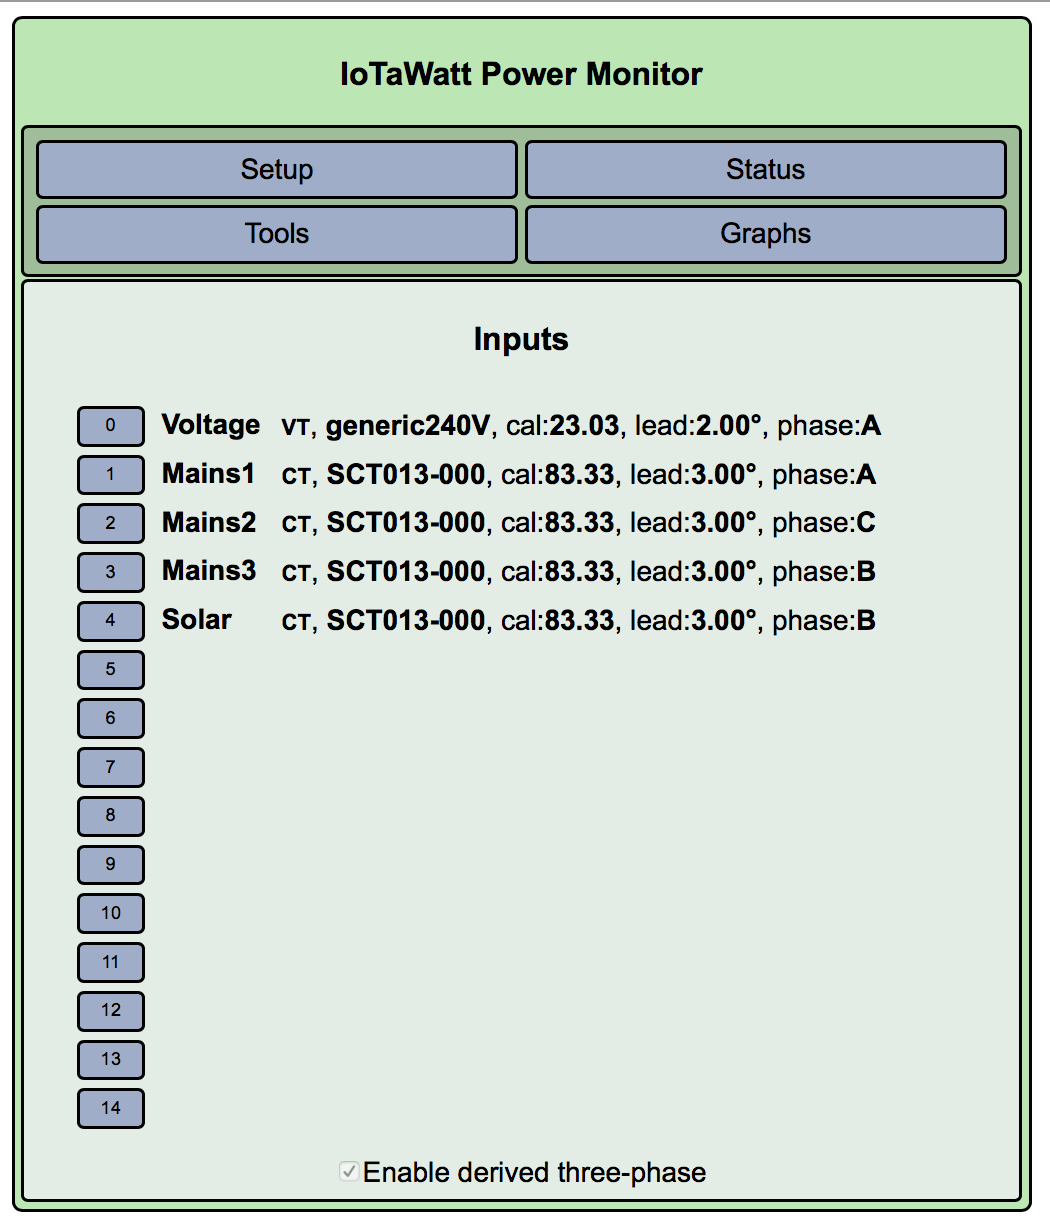
b) CTs are all from the second batch of SCT013-000 100A units that we tested and positioned as discussed.
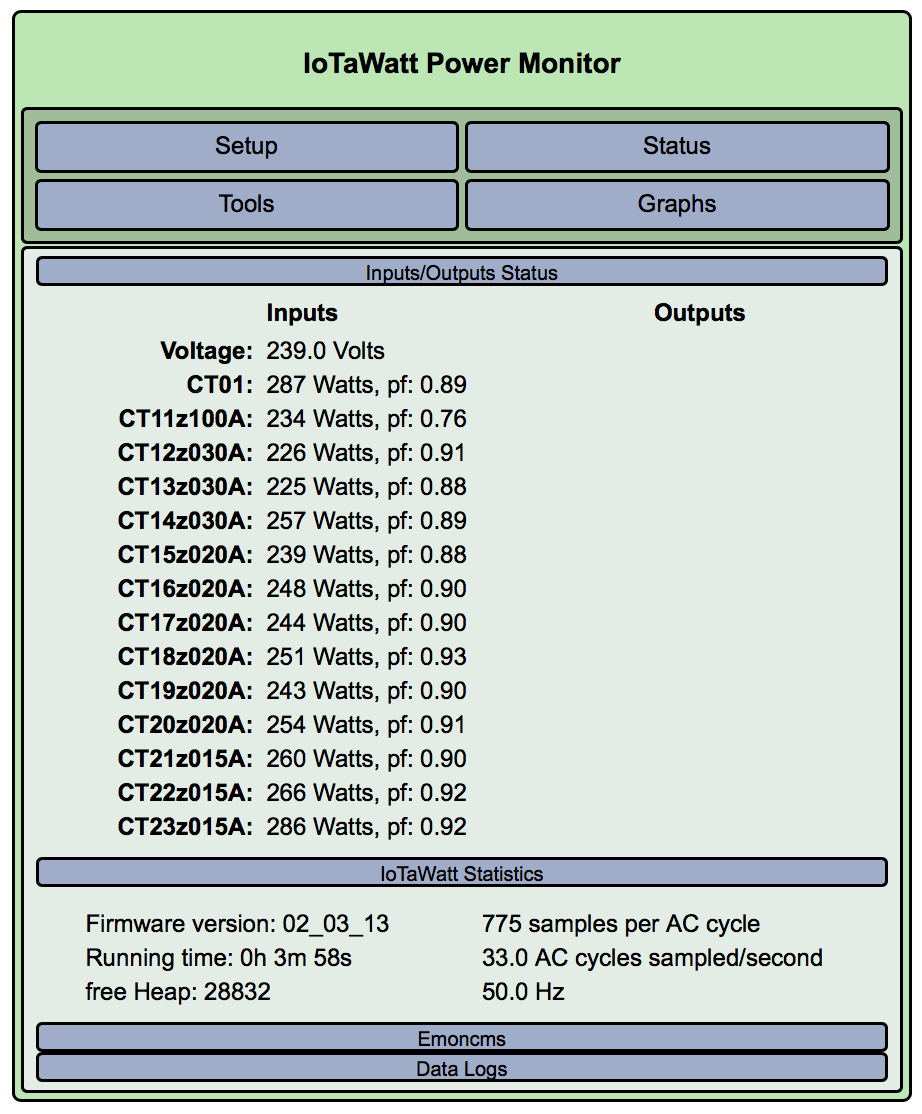
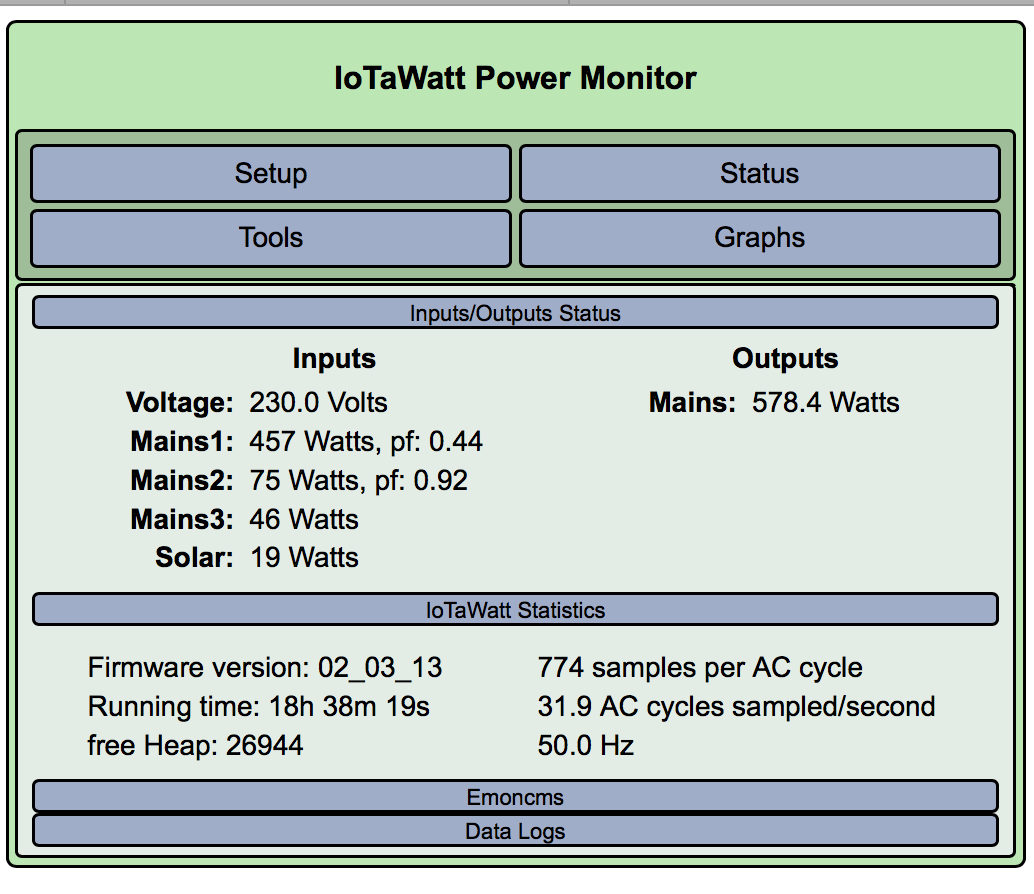
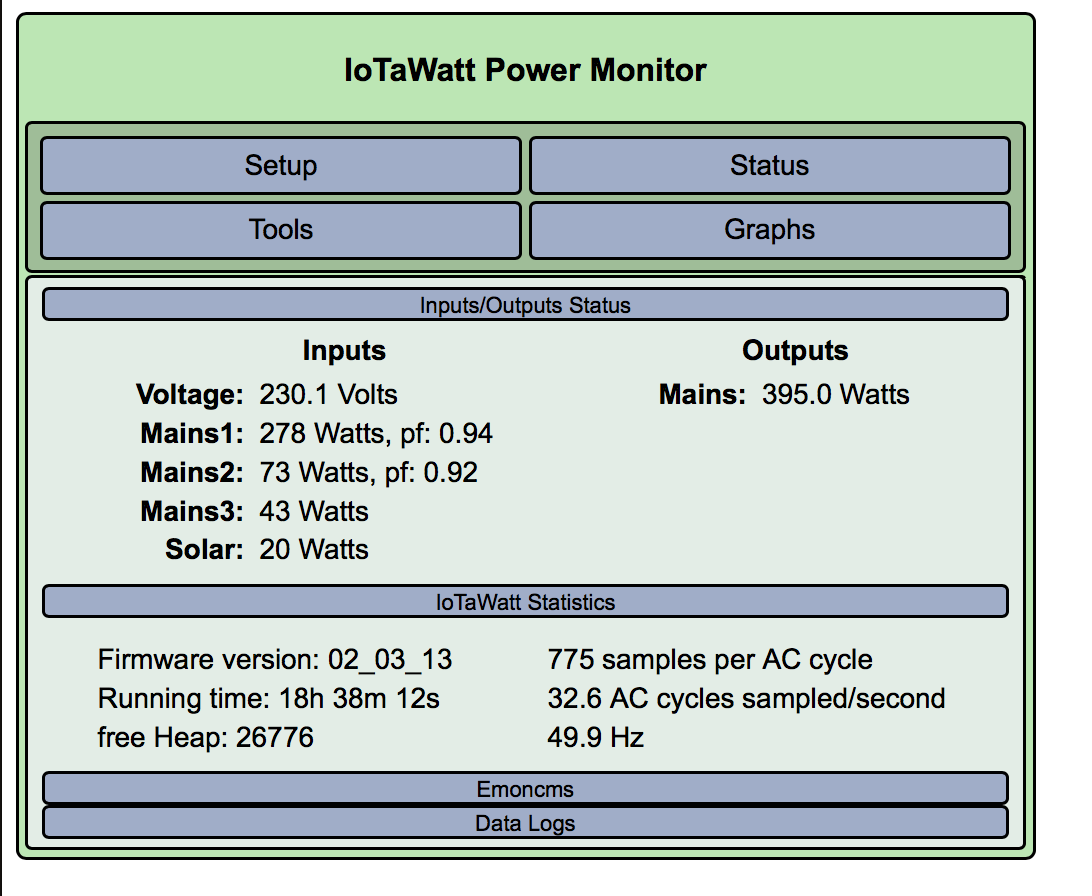
c) Reading the Solar Watts from the IotaWatt Web Status vs the Digital meter is very close and this now lines up in the meter readings.
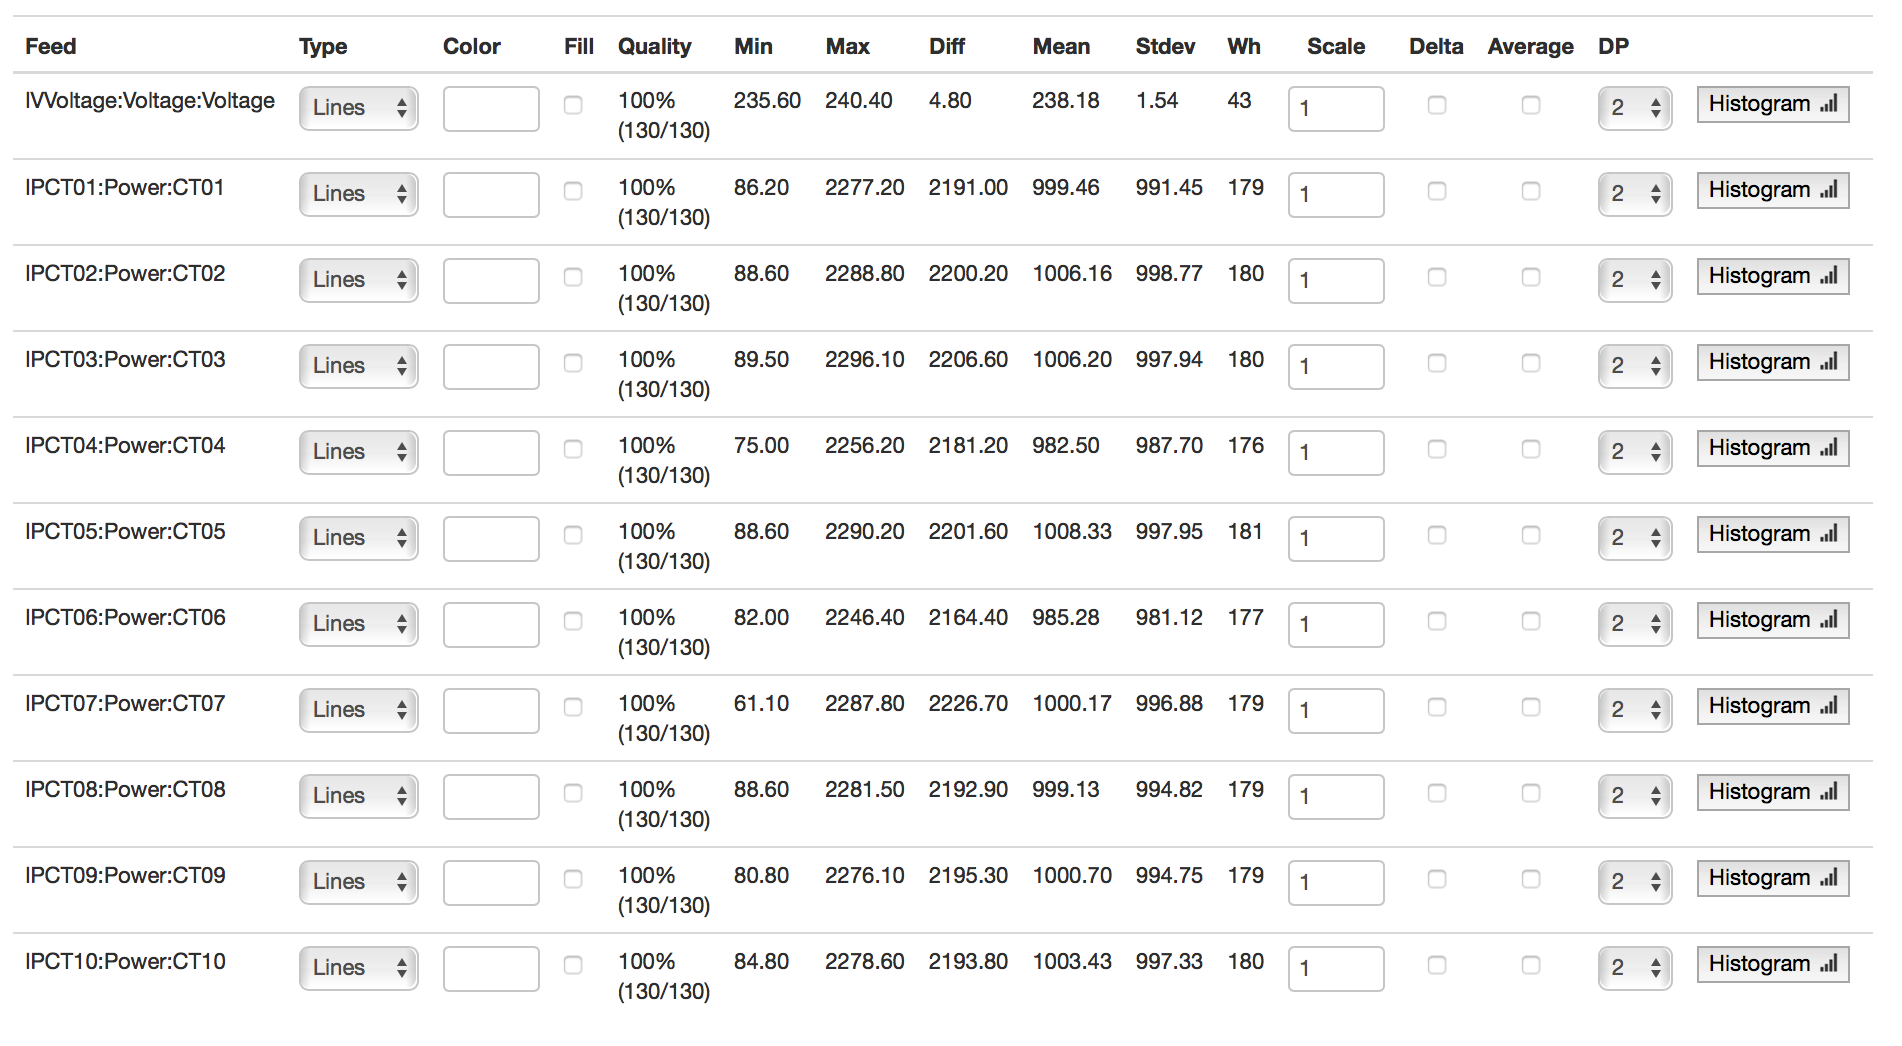
d) When measured with load, each phase appears to be correct - our kettle load test when checked on Phase A/B/C shows very similar watts and a pf of 1.0
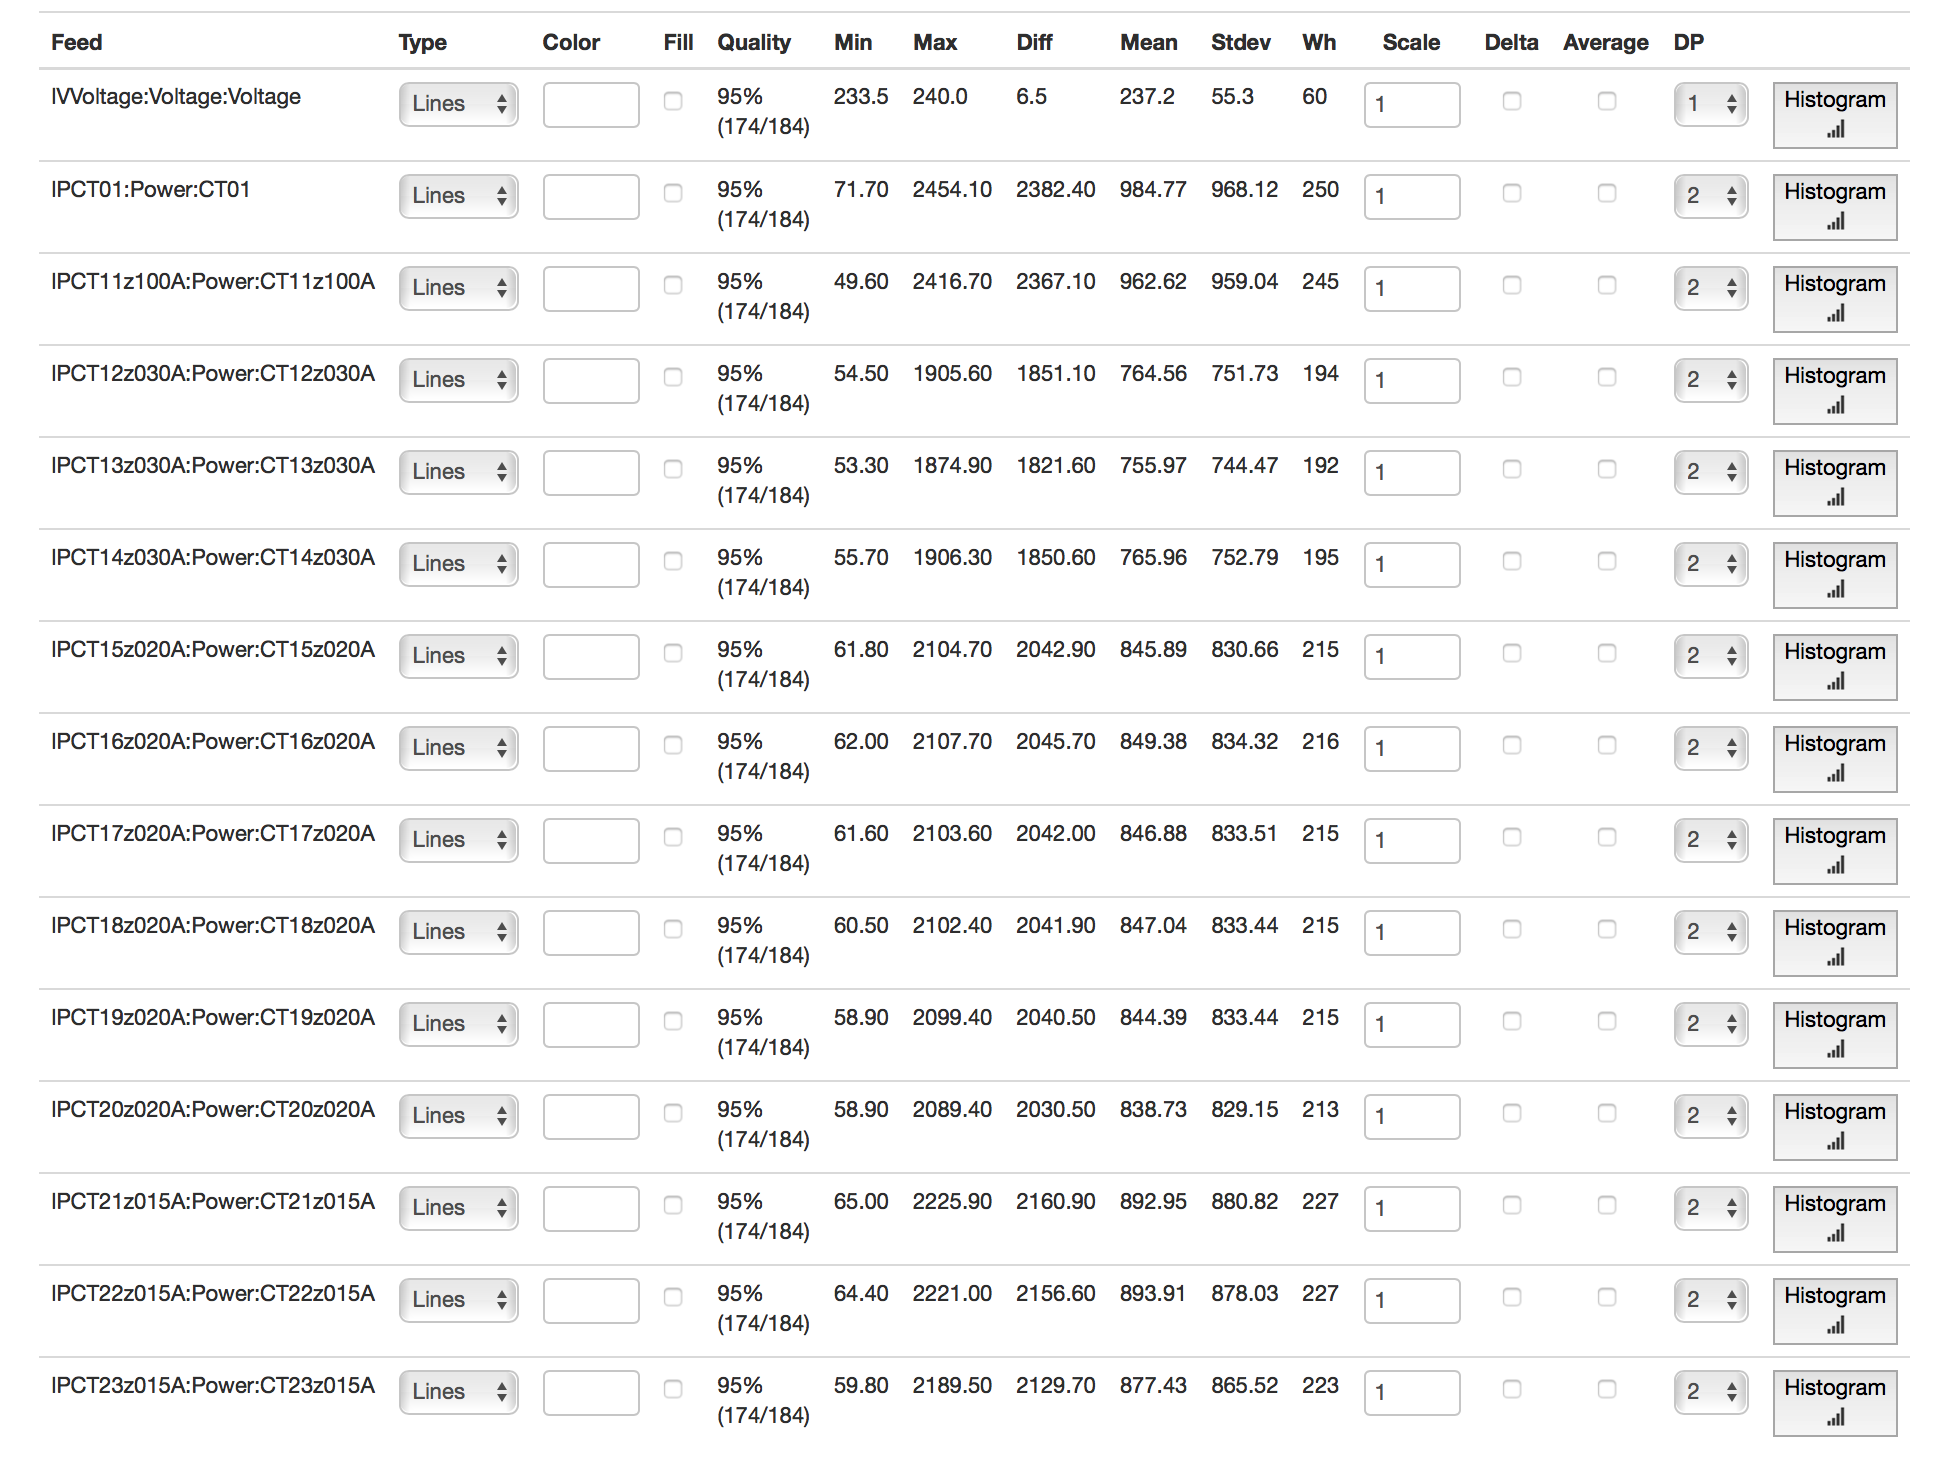
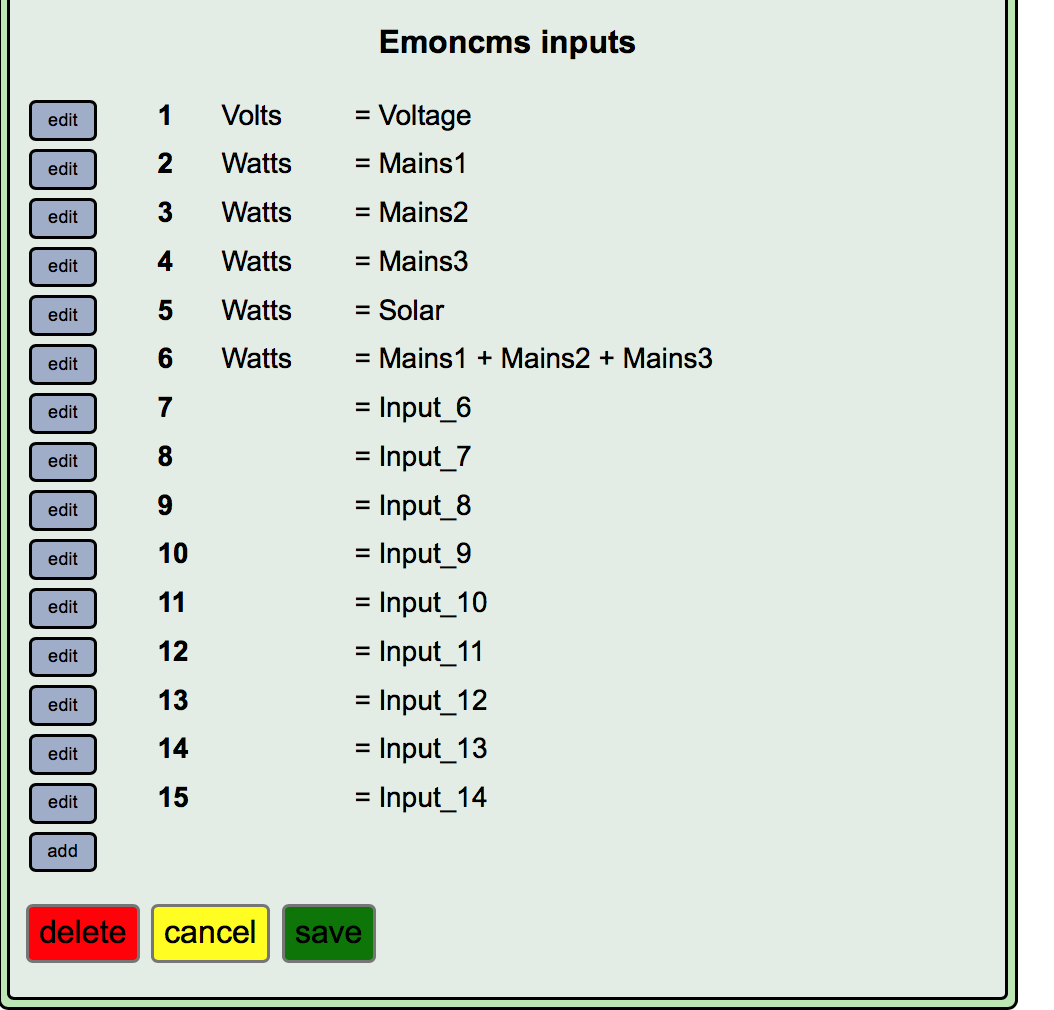
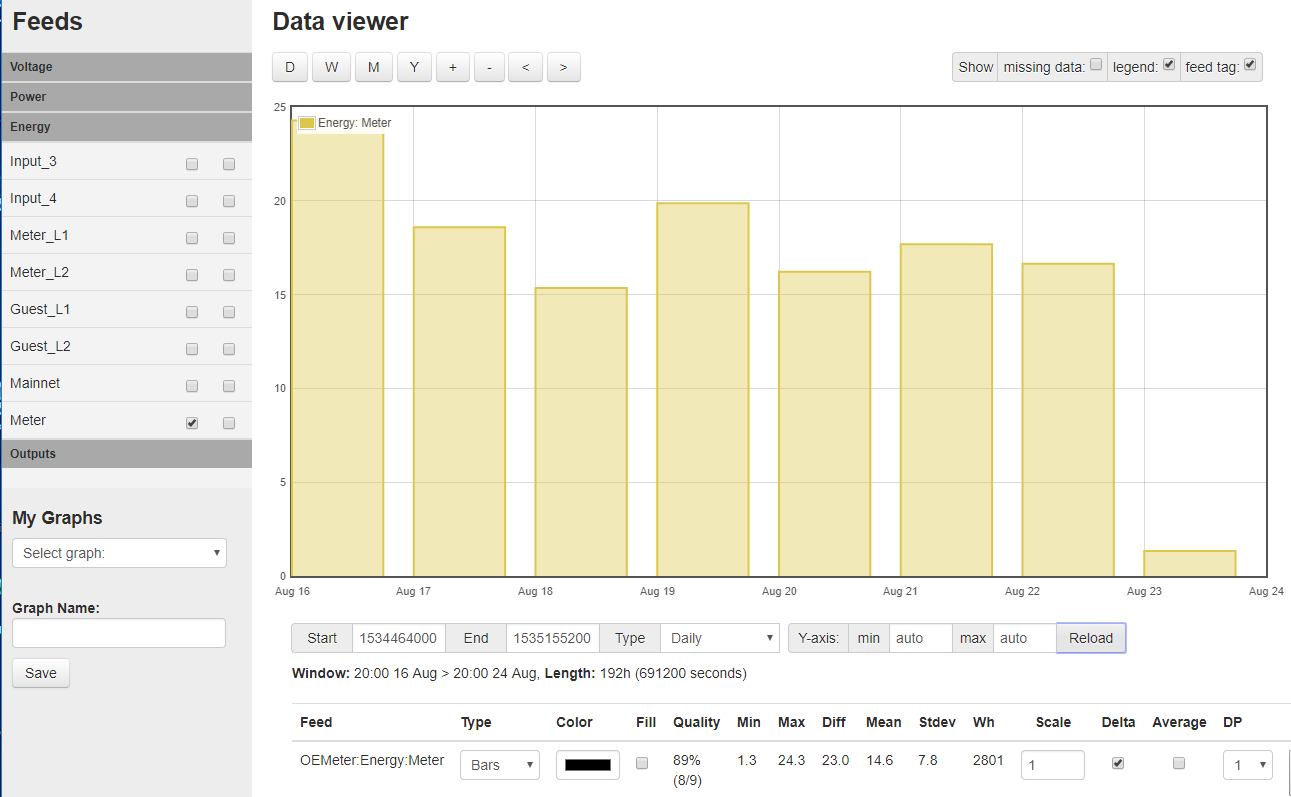
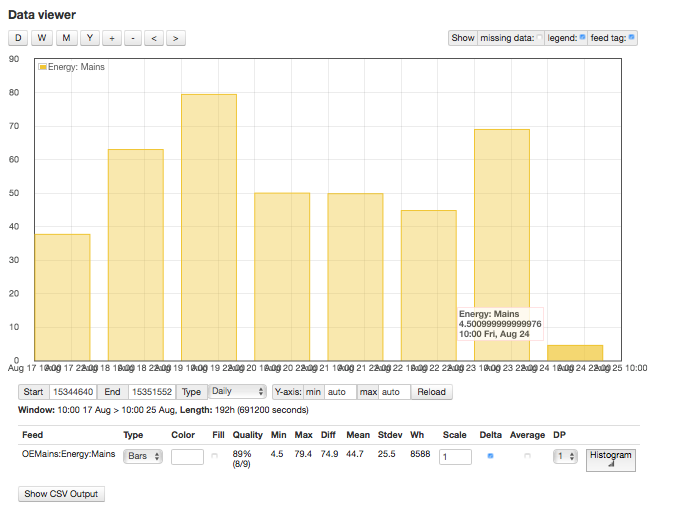
e) The total comes from the Outputs created “Mains” of Mains1+Mains2+Mains 3 and then this graph.
The graph uses energy, with a delta and daily to get the totals.
Please advise if this isn’t the best way
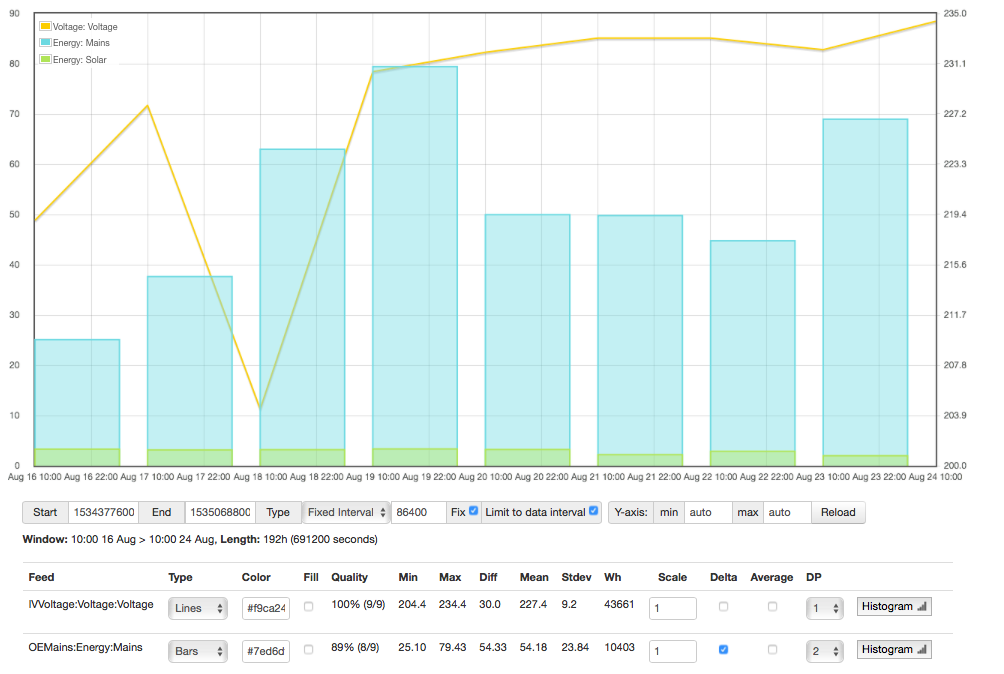
2018-08-16 10:00:00, 219.0, 25.10, 3.31
2018-08-17 10:00:00, 227.9, 37.66, 3.15
2018-08-18 10:00:00, 204.4, 62.98, 3.19
2018-08-19 10:00:00, 230.5, 79.43, 3.35
2018-08-20 10:00:00, 232.0, 49.97, 3.23
2018-08-21 10:00:00, 233.1, 49.79, 2.21
2018-08-22 10:00:00, 233.1, 44.77, 2.87
2018-08-23 10:00:00, 232.2, 68.97, 1.99
2018-08-24 10:00:00, 234.4, null, null
As you can see its reading way high compared to meter.
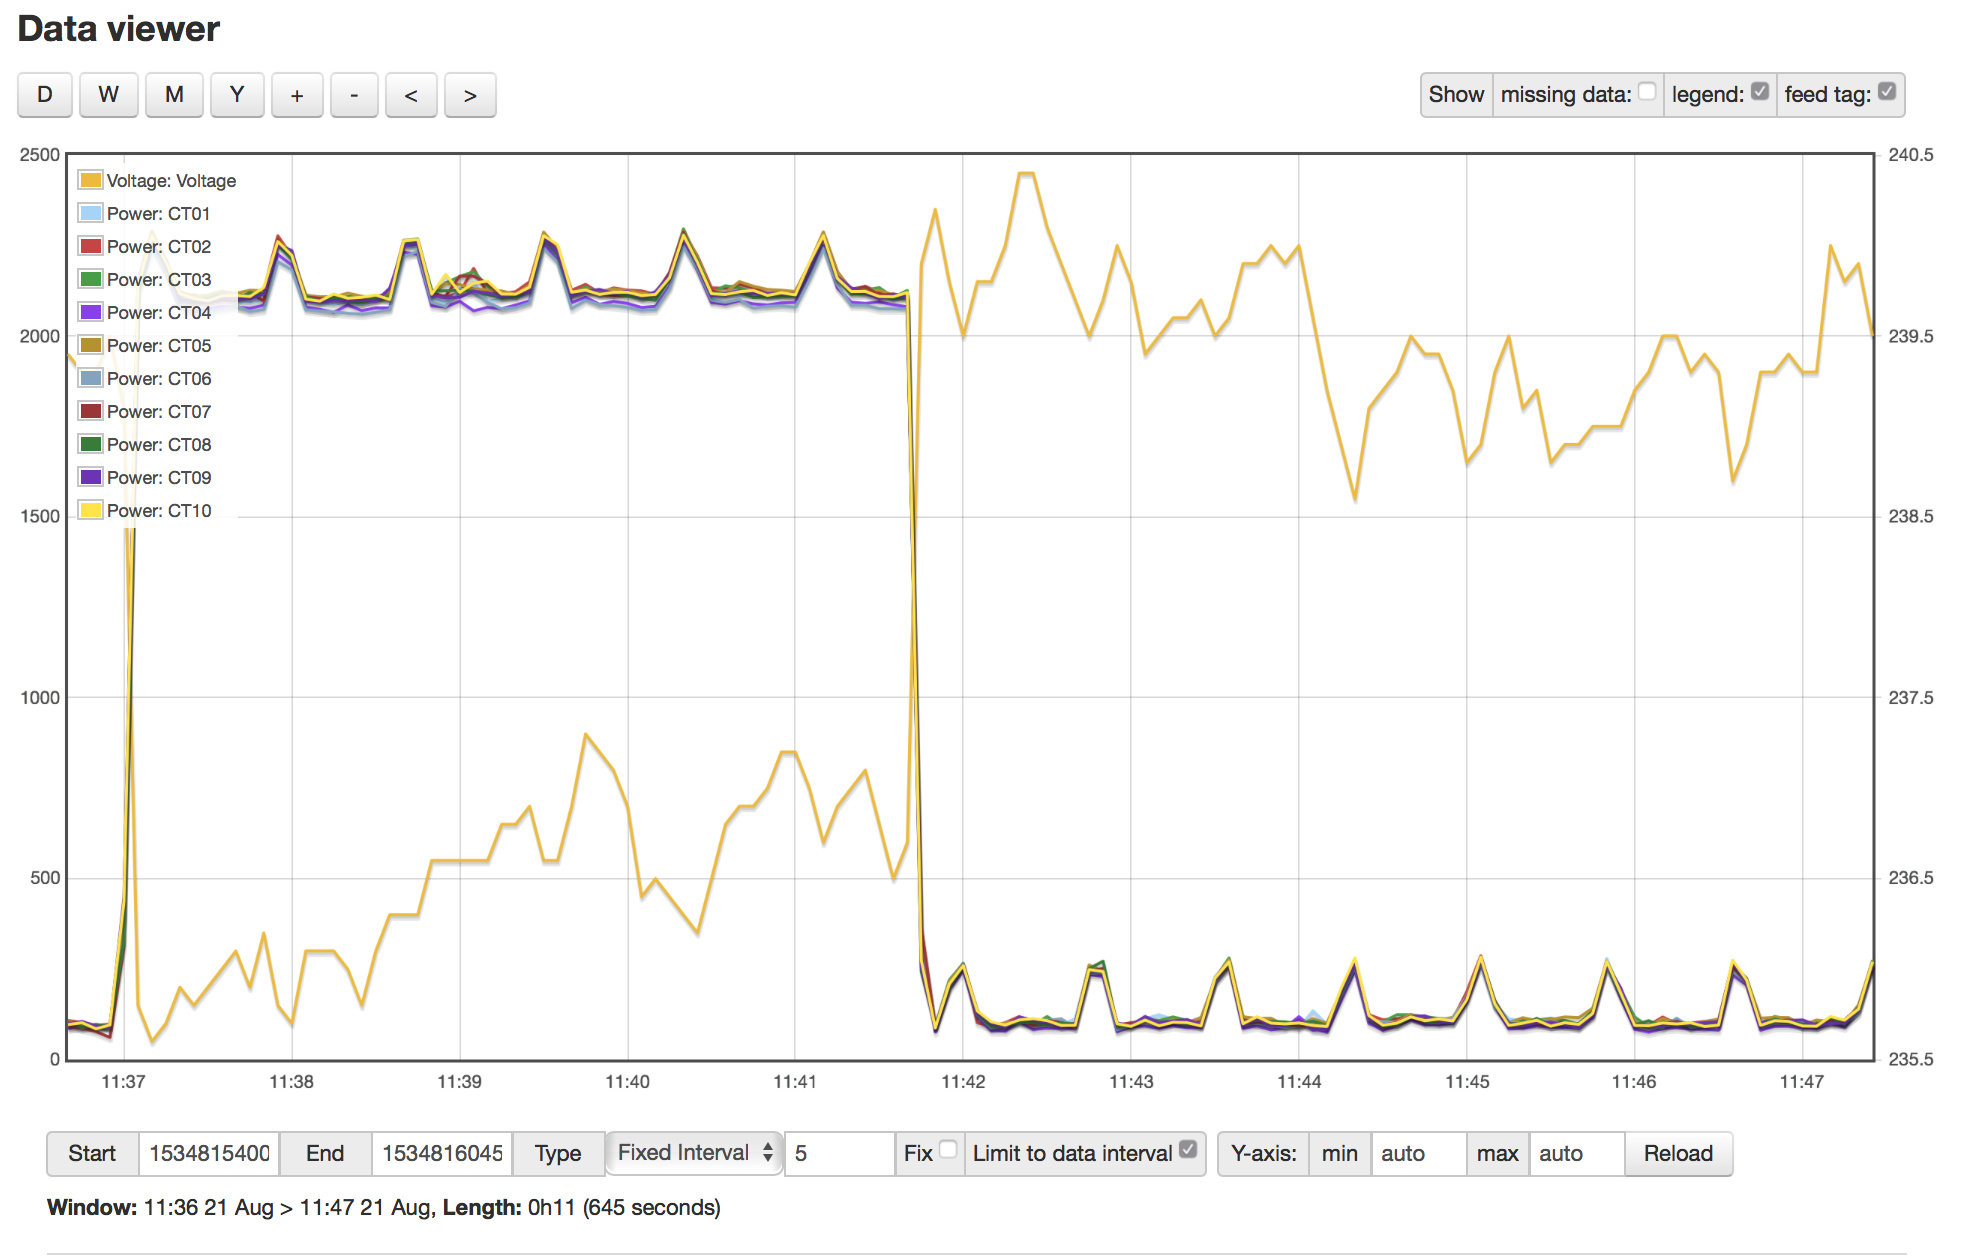
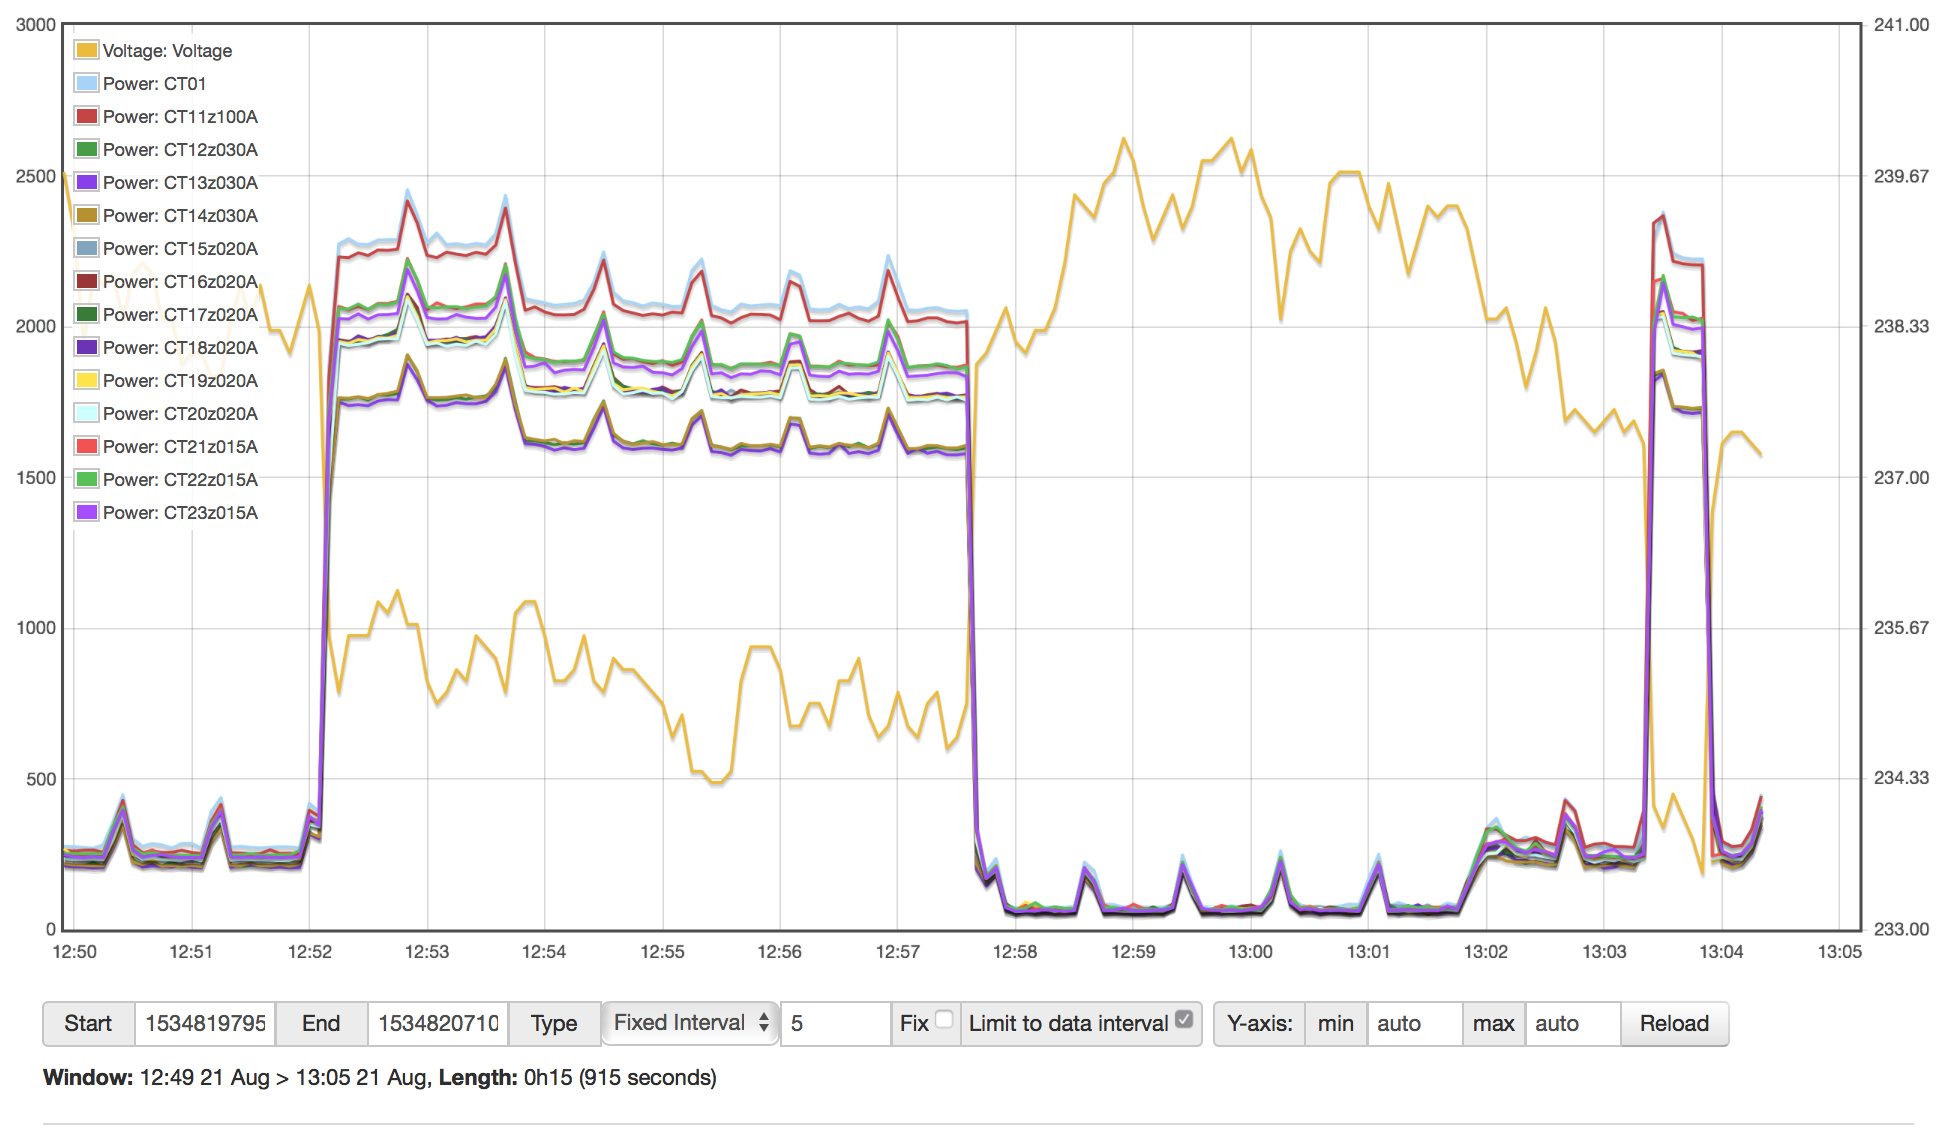
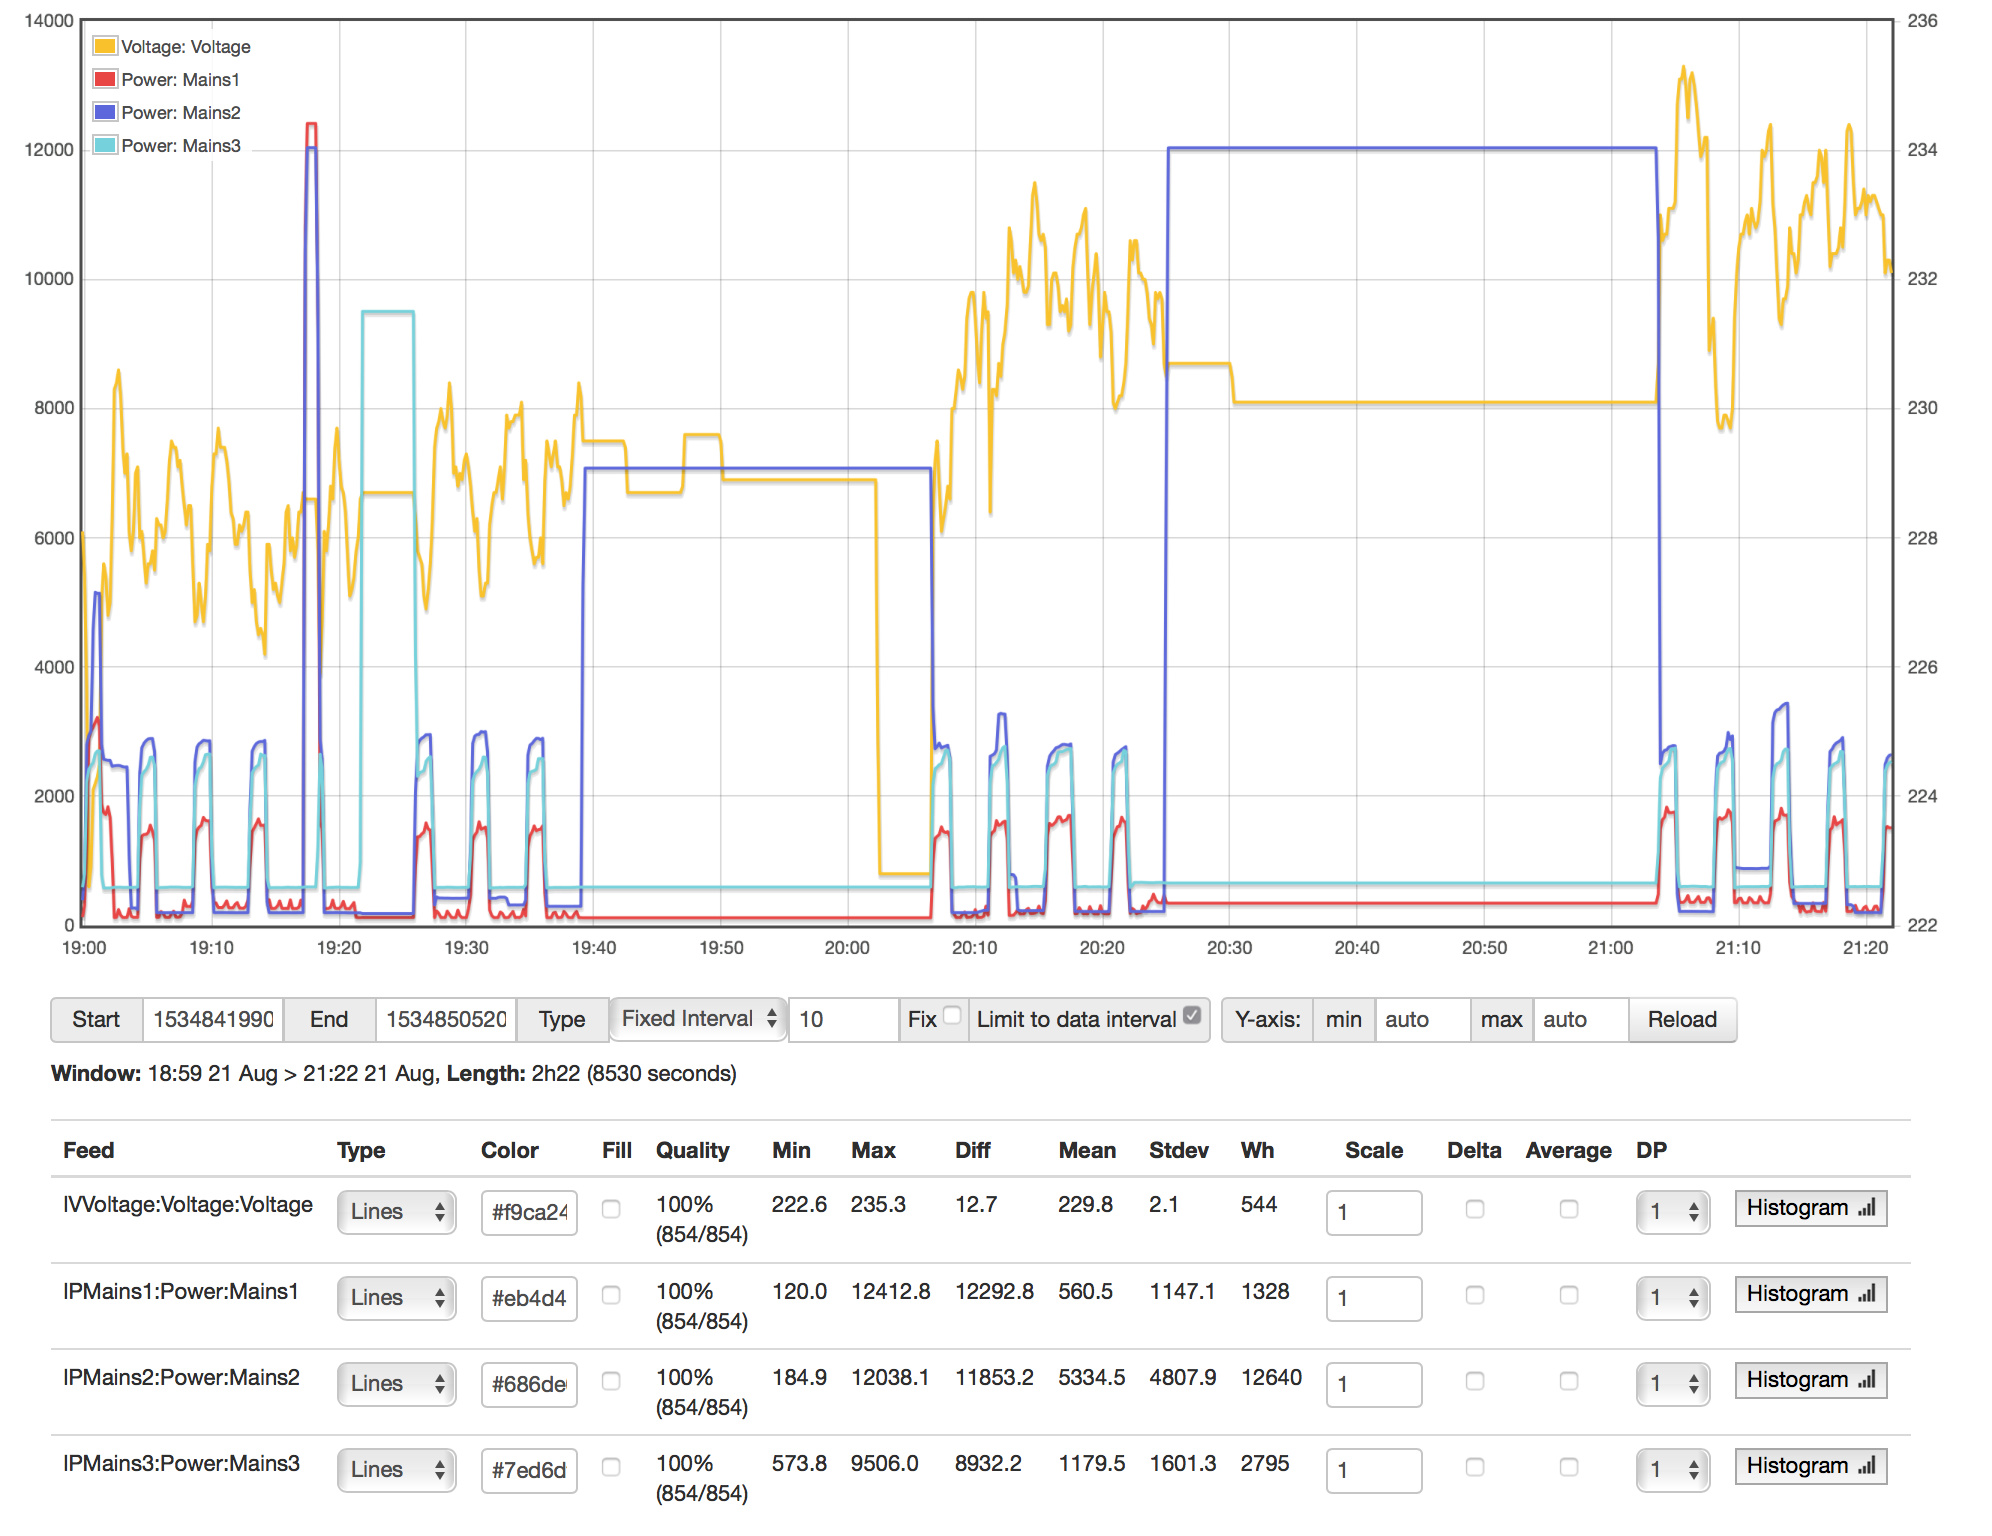
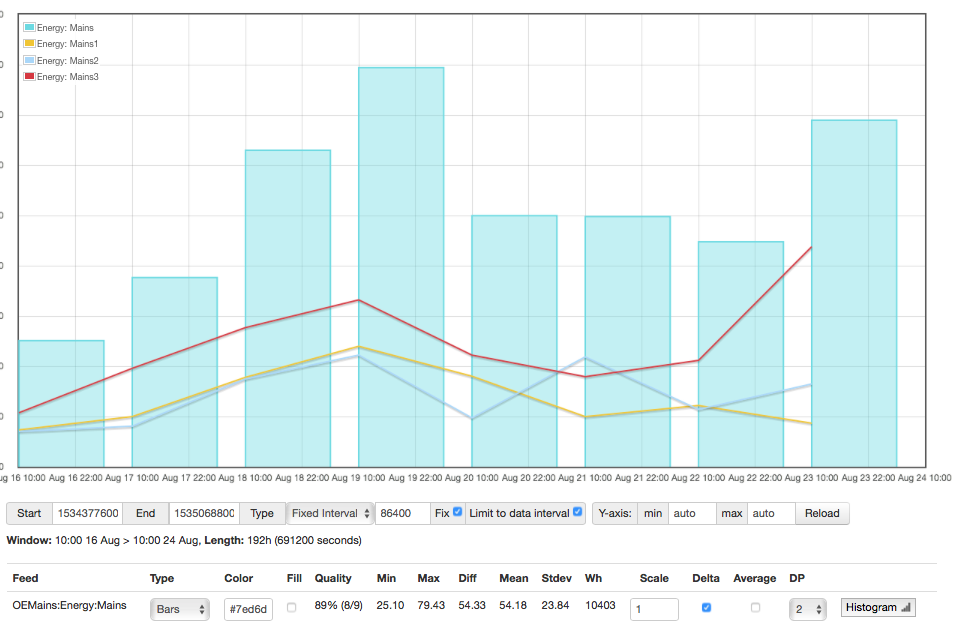
Here is the graph with the table showing the phases if it helps for the same time period. The basic calculation adds up.
2018-08-16 10:00:00, 25.10, 7.34, 7.01, 10.76
2018-08-17 10:00:00, 37.66, 9.99, 8.08, 19.59
2018-08-18 10:00:00, 62.98, 17.81, 17.47, 27.70
2018-08-19 10:00:00, 79.43, 23.99, 22.23, 33.21
2018-08-20 10:00:00, 49.97, 18.02, 9.73, 22.22
2018-08-21 10:00:00, 49.79, 9.98, 21.88, 17.93
2018-08-22 10:00:00, 44.77, 12.19, 11.41, 21.17
2018-08-23 10:00:00, 68.97, 8.67, 16.49, 43.81
2018-08-24 10:00:00, null, null, null, null
Please advise next step.