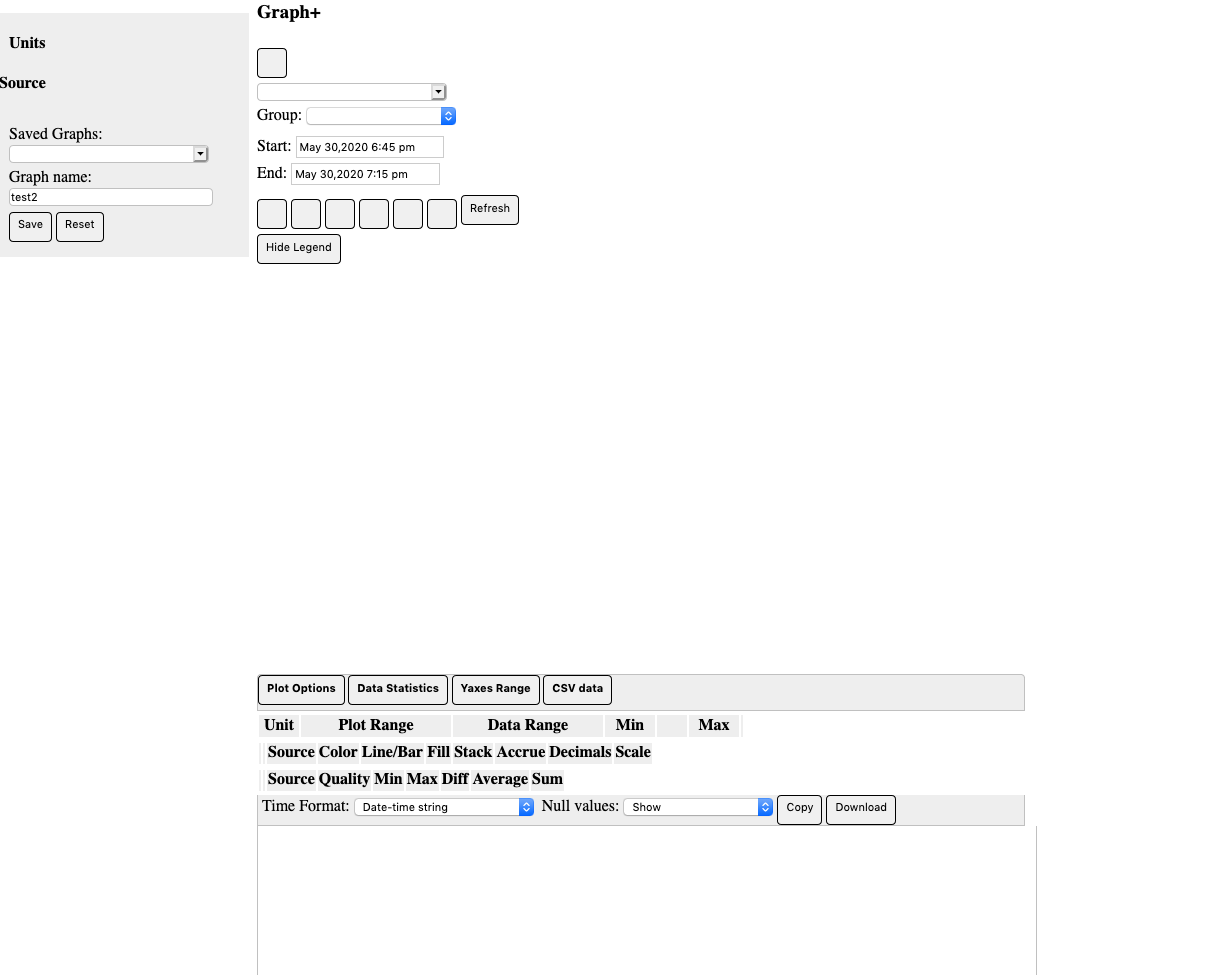
Discovered accidentally today (while powering off/on lots of circuits, and my Internet router was down for a bit) that Graph+ apparently needs something on the Internet to work its magic. When the Internet was unavailable, Graph+ looked like this:
It appears as if none of the buttons work, and the drop down menus are non-existent (not even my locally saved graphs show up).
Curious to know what it is trying to find out there (a packet trace indicates something from cloudflare.com, and only about 10 small packets, at least on a refresh of the Graph+ page) and if this is deliberate or accidental.
Luckily, my power is much more reliable than my ISP, so would be nice if the IoTaWatt had some local cache of what it needed, and only occasionally updated from the Intertubes.
When I am finally able to go off-grid, I want to keep my IoTaWatt, too!
If you look at Graph2.htm in the IoTaWatt root directory, you will see all of the CDN loaded dependencies.
You can download those from the CDN and upload to your IoTaWatt in a directory like CDN or something.
Then edit graph2.htm to reference those rather than the cloudflare versions, and save that graph2.htm as something like locgraph.htm. When you have no internet, you can run that version. It will probably be slow to load, but once loaded should work the same.
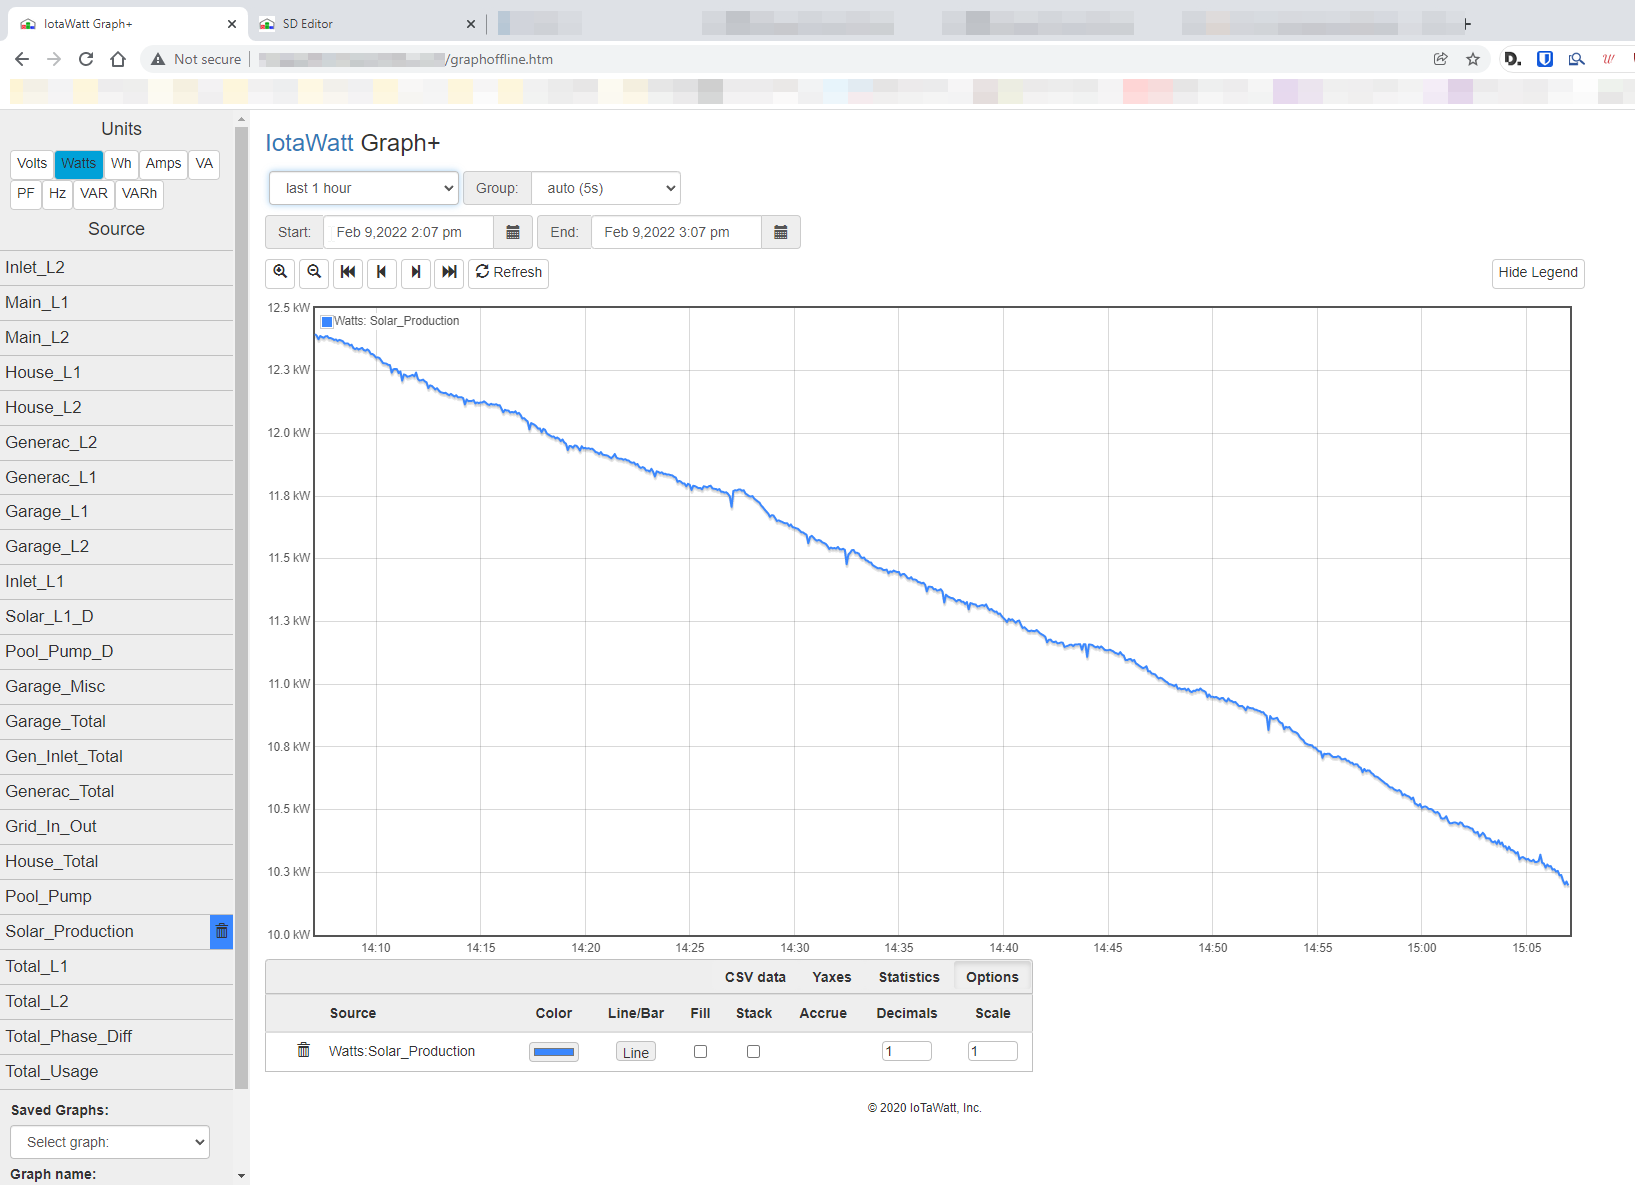
A follow-up here… I tried this out this morning, and it worked. Seems to load in about 5 seconds from a local “CDN” rather than about 3 seconds from Cloudfare, so not too bad.
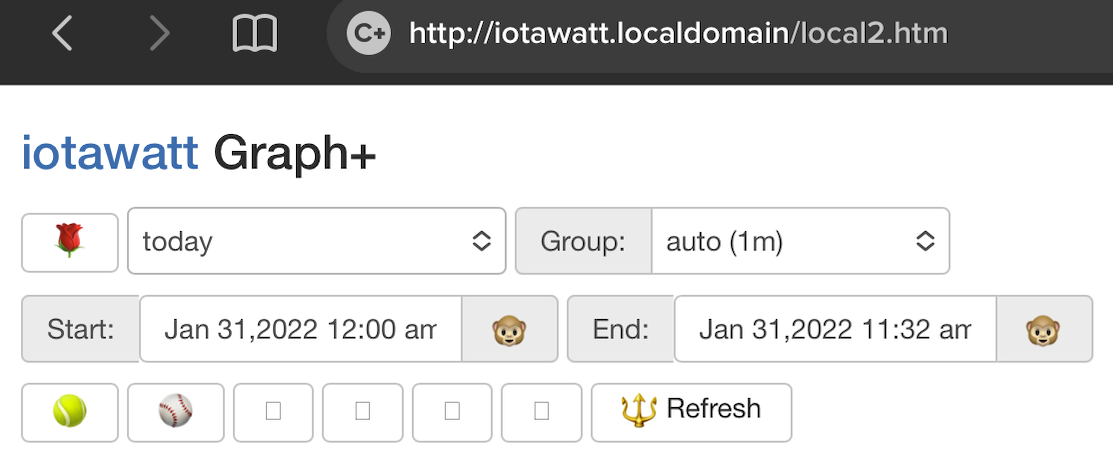
I did however see that the icons are not presenting properly, giving me either a generic “box with small numbers in it” “missing” icon on my desktop browser and a bizarre set of apparently random icons on my iPad!
I started looking through graph2.htm for any clues, and it seems to be something with displaying the glyphicons, but since I’m not a (web) programmer, I have no idea what I’m doing or looking for. If anyone has a hint, please do tell.
Otherwise, the “local CDN” trick seems to work. If I choose one of my graphs, it displays; I can change the time period, etc.
I’ve run into the same issue with the icons being missing, did you ever figure it out? One of the main reasons I avoided something like Sense was because of reliance on internet
I think the best solution is just to pipe everything into InfluxDB and use that, but ideally I’d love to get everything on the device to work without the internet
Relying on the internet to receive, store and provide your data is one thing, and using it to provide common JavaScript components from a CDN is something entirely different.
If either of you want to resolve the CDN issue, you can use your browser debugger to find out what file is not loading properly and take steps to include that in your local content directory.
It looks like its something in the bootstrap.min.css file, I’m digging through that now. If the file is the same, it should work I would assume unless there is even more link inside the CloudFlare bootstrap.min.css
I managed to get it, it looks like it was linking again to some fonts. I just downloaded them and put them in my CDN directory and edited the referenced, there was about 6 of them