This is my first forum post. We just bought a house and installed the IoTaWatt. I am very pleased with it. Thank you so far.
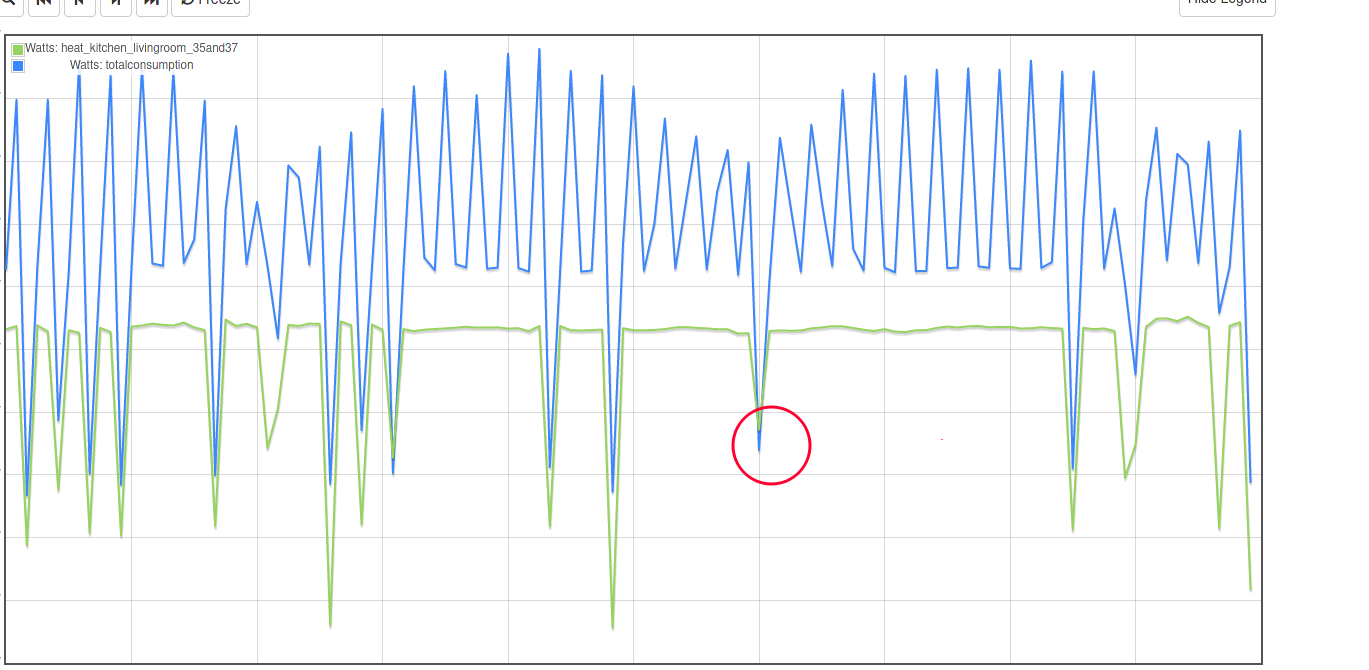
I have some questions concerning a single measurement that happened last night. According to the data, two of our baseboard heaters drew more power than the mains were delivering, see screenshots
What’s a possible explanation for this? Did the previous owners hide a free energy generator in this house? Is it a measurement error? Is it a data processing error?
More importantly, I am calculating a “other” output, based on the total delivered by the mains minus all the CTs. None of the CTs can be negative. What happened last night, and made me look into this, is that the calculated “other” went negative. I am importing everything into influx/grafana. Is there a way to either set negative calculated values to zero before they leave the IoTaWatt, or should this be done in influxdb or grafana?
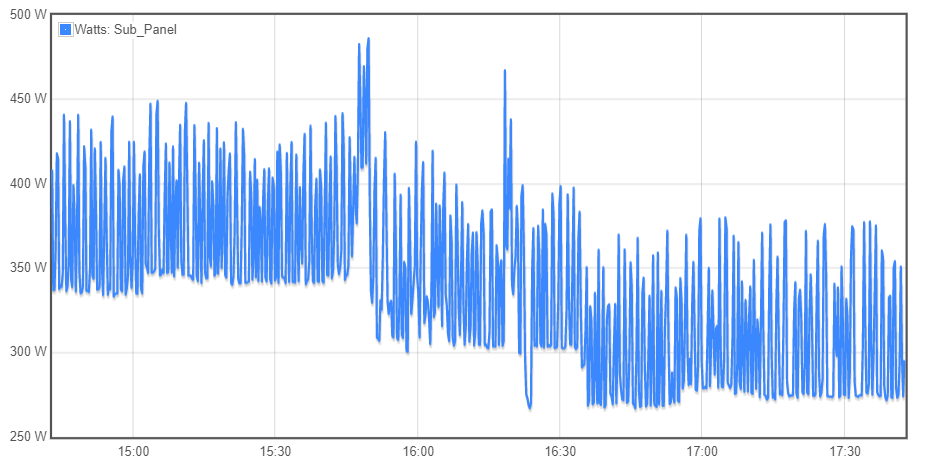
A last, related, question (maybe it doesn’t belong here): Why is the power going down by about 200 W 2-3 times per minute (for example, at left end of graph)? Is that normal? The circuit in question has two electric baseboards connected to it.
Hi Gunnar,
That’s a lot of questions without much to work with. I’m assuming the CSV is the circled did.
Here’s where I’d like to start:
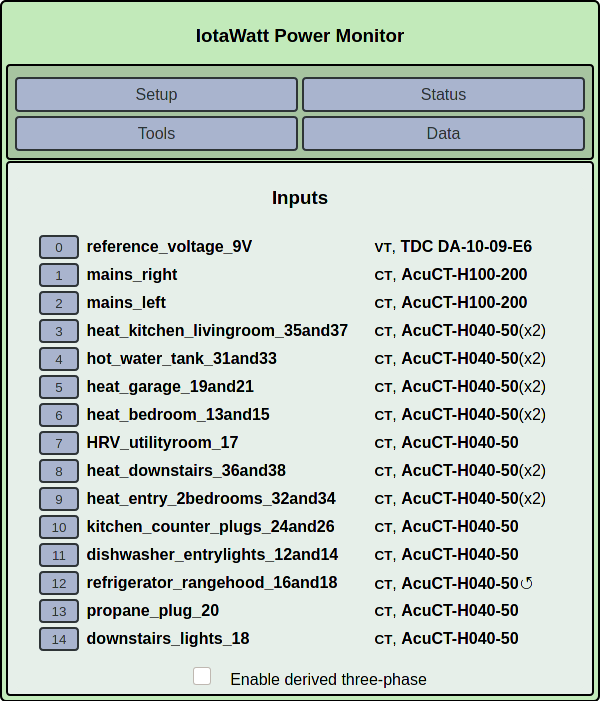
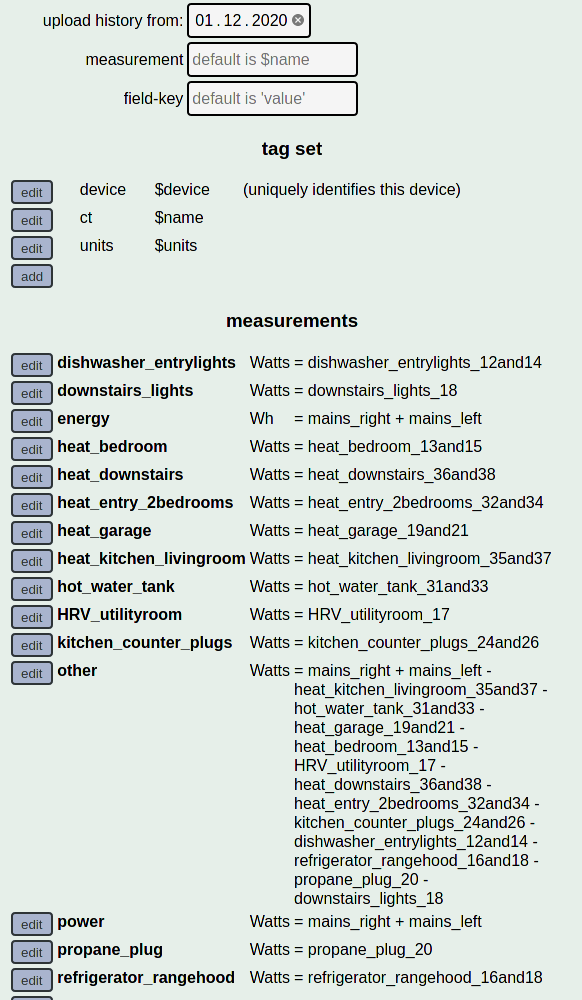
Can you post the inputs configuration display
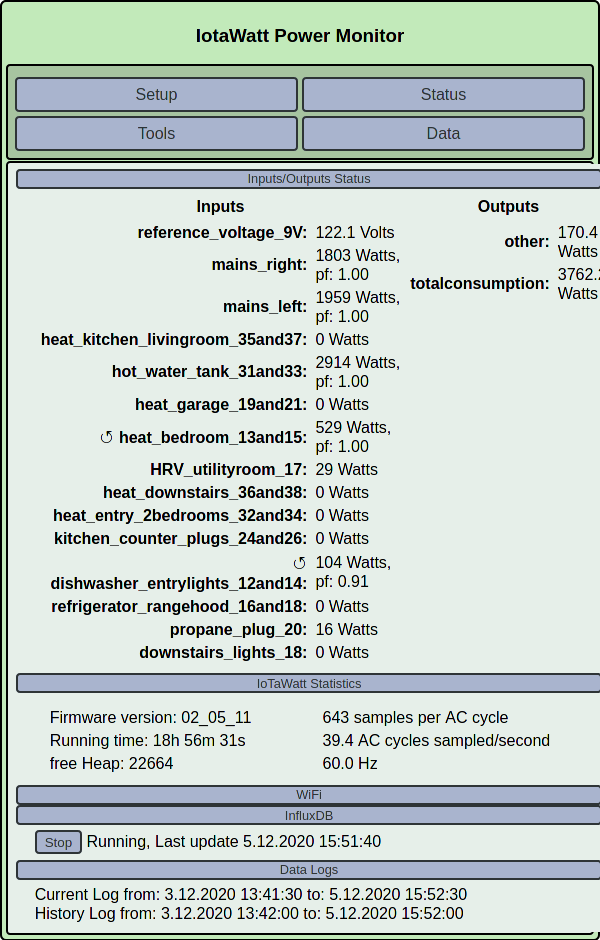
A screenshot of the status display
The outputs configuration display
A plot showing your electric heat and mains when you say the heat exceeds the mains.
I don’t know the previous owners so can’t say if they hid a generator. These kinds of problems are usually configuration issues or installation problems with the CTs.
The 200 W 2-3 minute change is probably not normal but probably real. Look at my living room. The 100W jitter is the fishtank heater with a hair trigger thermostat.
If you look at the main status page it says it is sampling about 40 times a second. This means each channel get sampled about 3 times each second. The “error” you are seeing is occurring at the point when there is a great change in the load, one of the heaters is turning off. If the heater channel samples while the heater is on, but the main channels sample when it is off. The heater channel can easily report more usage than the total.
I have been doing math across measurements and I see the same thing. When there is a significant change in the load, the fact that IotaWatt does not sample all channels at the same time can lead to what looks like errors in the measurements or math. But, it is really sampling error.
There are differences of opinion about how important this is. Bob has data that says IotaWatt is within +/-1% of a revenue grade meter over the long term. That is more than good enough for my needs. I have not seen anything else at a reasonable price that I believe does a better job. At one point I was going to make my own with individual energy measurement ICs. But, that’s a lot of work and I found the IotaWatt, which is much easier. I generally don’t care about stuff that is under 5seconds. IotaWatt shows stuff at 5-10s resolution. It is sometimes interesting, but I just have to remember that the channels are not synced.
The short take is that with what I’m seeing, I don’t see anything wrong with the monitoring. Whether there are electrical problems with your heat, I can’t say as I don’t have any idea what kind of equipment it is.
You asked about it going up and down 2-3 times per minute. There is another pattern in that curve formed by the peaks that has a much longer period. If it is resistance heat, which I suspect because the bedroom heat is (pf 1.00), then I think the living room heat has a modulating control. The time scale is not present on the plot, but I’m guessing that long period is about 20 minutes, and is a heating cycle. The control probably uses a triac or other power semiconductor to gradually increase and then decrease the power during the cycle in response to what it perceives as demand. Those controls also can have “heat anticipator” logic to anticipate and blunt any overrun.
The 100W-200W up/down may be normal operation or a defect, but it seems harmless enough with a purely resistive load. What is interesting is that there seems to be a baseline and then it adds to that to increase power.
Although most of the lows stop at a baseline (once again the metrics aren’t visible), sometimes they shut down completely for a brief period.
While I was composing a response for the headline question, I see that @frogmore explained it about as well as I can. There is another thread somewhere that illustrates the phenomena very well, and if I can find it, I’ll post back with a link.
I would caution you against eliminating the negative value. It is a statistical aberration but nevertheless significant in the overall picture. The difference is compensated in the neighboring measurements and will disappear if you go to ten second intervals.
Thank you both @frogmore and @overeasy for the elaborate and thoughtful replies.
@frogmore: Thank you for pointing out different sampling times as a likely explanation. I should have emphasized in my original post that I can certainly live with outliers like that. I am interested in understanding the major loads so as to reduce energy consumption; individual measurements like these trigger my curiosity but certainly don’t influence the big picture.
Thank you also, @overeasy, for the comments on the underlying pattern. I had noticed that too and is indeed another circuit with only heat on it. We have a mix of simple (non-programmable) and programmable thermostats on each heating circuit; maybe I’ll deactivate simple and programmable ones in turns to see how the pattern responds. I was under the impression that even the electronic thermostats are either on or off (depending on the time programmed) and had expected to see just a flat line for the resistive load. But it appears that they can also regulate power. Makes sense.
Assuming you are using high power resistance heaters, there are several classes (and dimensions) of thermostats. While programmable or not can mean something, ie non programmable ones generally use the bang-bang control
These will always either be fully on or fully off. Even more expensive thermostats will typically use pulse-width modulation to achieve the goal of not fully on. The thermostat for my heated floor does this, but it still leaves the heat on for at least 30s to a minute at a time.
Disaggregation of loads is hard, which is why having lots of channels is great. Turning off loads so you can be sure you are measuring a single load can help, if you just want to understand things are going okay.
I have my dishwasher on a separate channel. This came in handy a couple of years ago. My wife noticed that the dishwasher wasn’t working well. I tired it and it was filling with water and appeared to be working. I took a look at the power profile over the last few washes. The profile looked different, but the pump was clearly working, since the dishwasher was not full of water. I looked online to make sure it didn’t have two pumps, it doesn’t. So, I took it apart and found a chip from a dish. I think it was lodged in the chopper and kept the pump from pumping water during the wash cycle. But the fill and empty parts were working fine. After I removed the chip, the wash cycle started working fine too. I probably would have figured it out without seeing the power usage, but seeing it made me convinced the repair would likely be simple.