Happy to say I am pleased with my 2 IotaWatts I just installed this weekend.
I created a digital ocean droplet hosting Influxdb 2.0 and Grafana and started piping all the watt data into there. Took my a bit to figure out how to combine data from 2 different units, but finally got it worked out. Played around with querying the data and integrating it to get watt-hours and then started creating some gauges showing how many kWh each device in house was using etc… Then it hit me, I don’t really care about kWh. I care about how much money I’m spending. So I grabbed my last power bill and got my kWh rate off it and started redoing all my visualizations and this is where I am now:
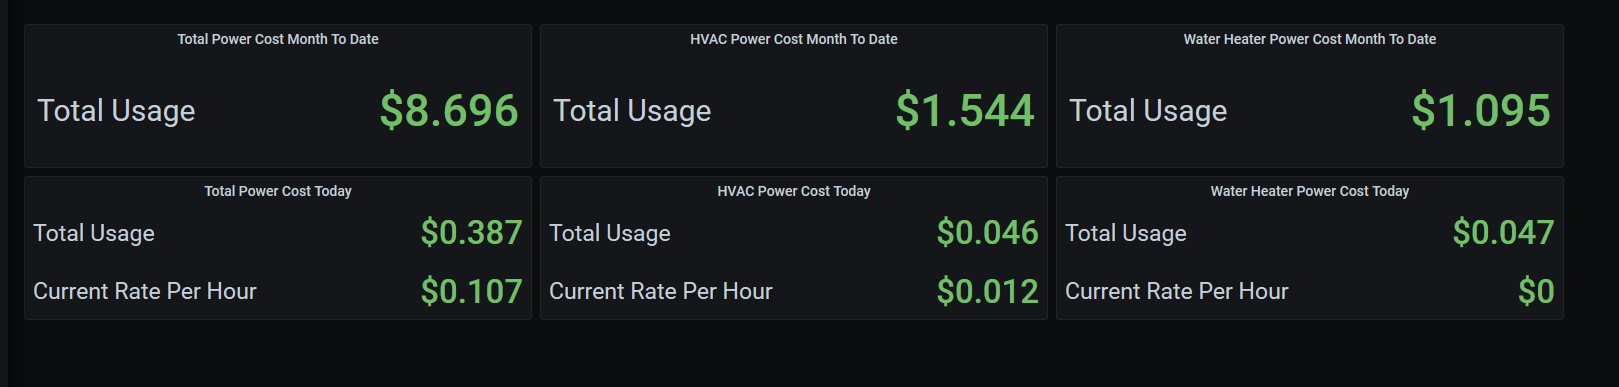
It’s still a work in progress, and I’m not the best at creating pretty UIs, but those are the big 3 that I want displayed on my overall home metrics dashboard.
Just thought I’d share my results. I am curious to see how other people are visualizing this data, so feel to share 