Hi, simple question . I don’t think I’m understanding how its working but
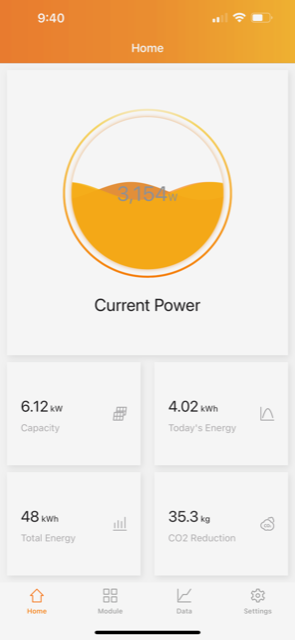
I have 2 CTs on the solar (which is downstream of my mains). They show ~2100W whereas the APSystem App for my solar shows 3400W power generation.
Shouldn’t the CTs be seeing the same number as what is shown on the app, or something very close to it
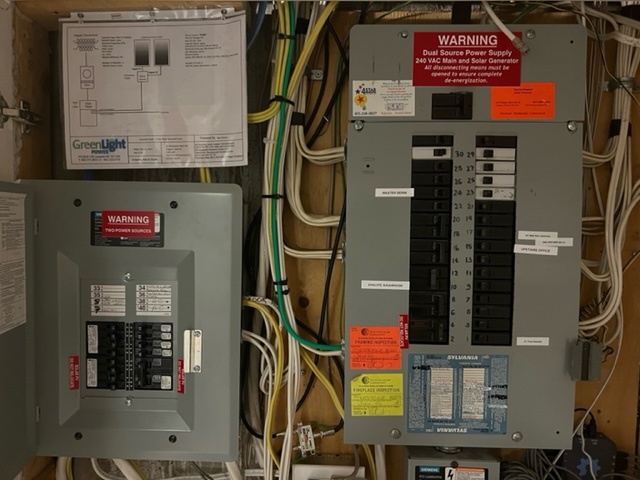
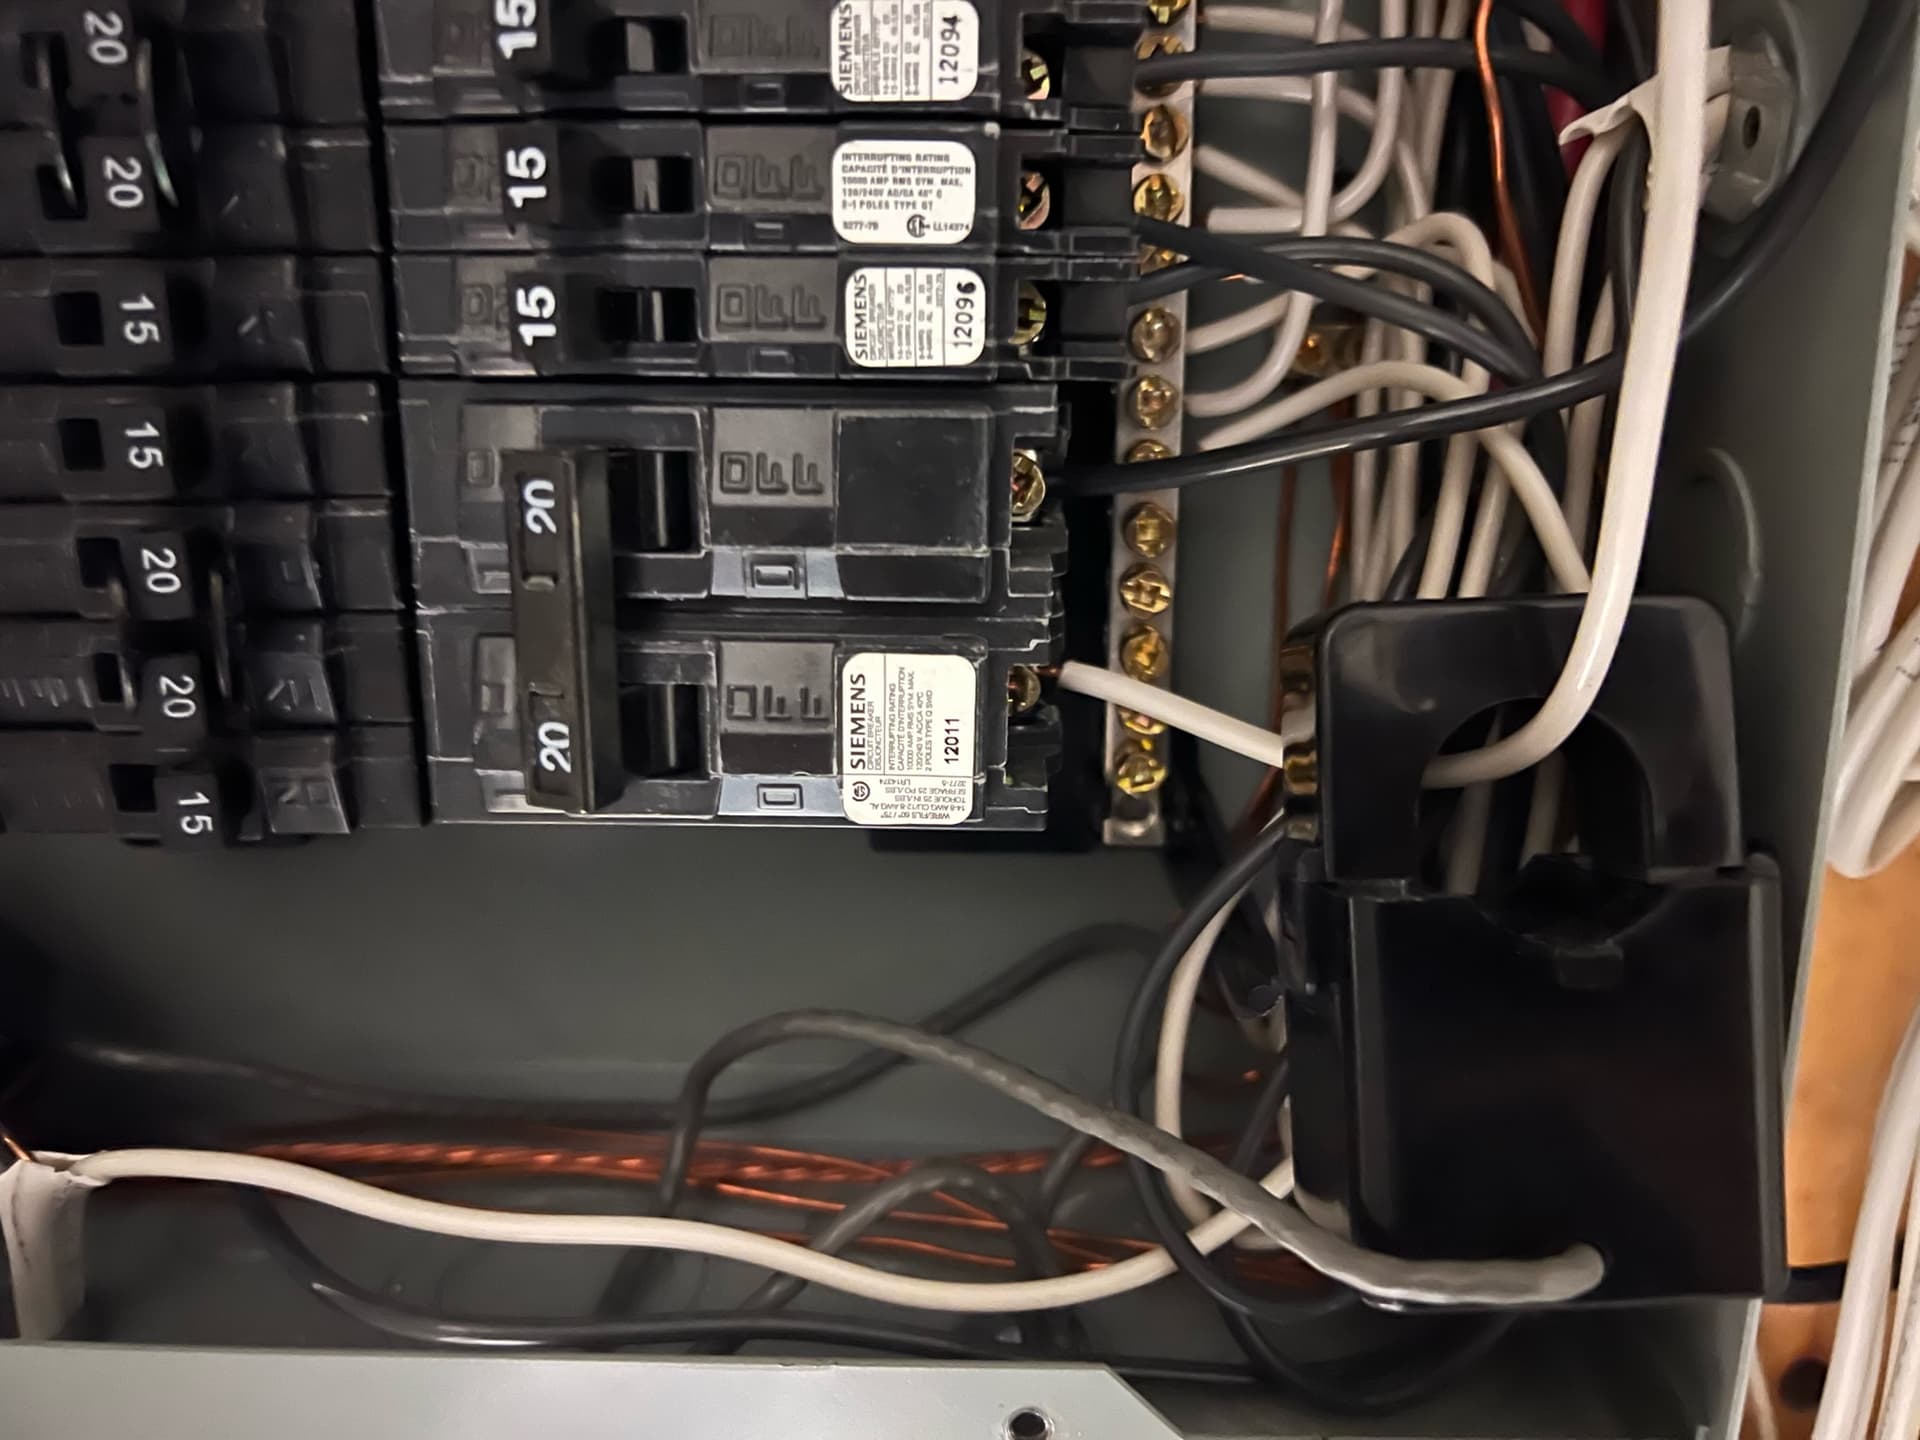
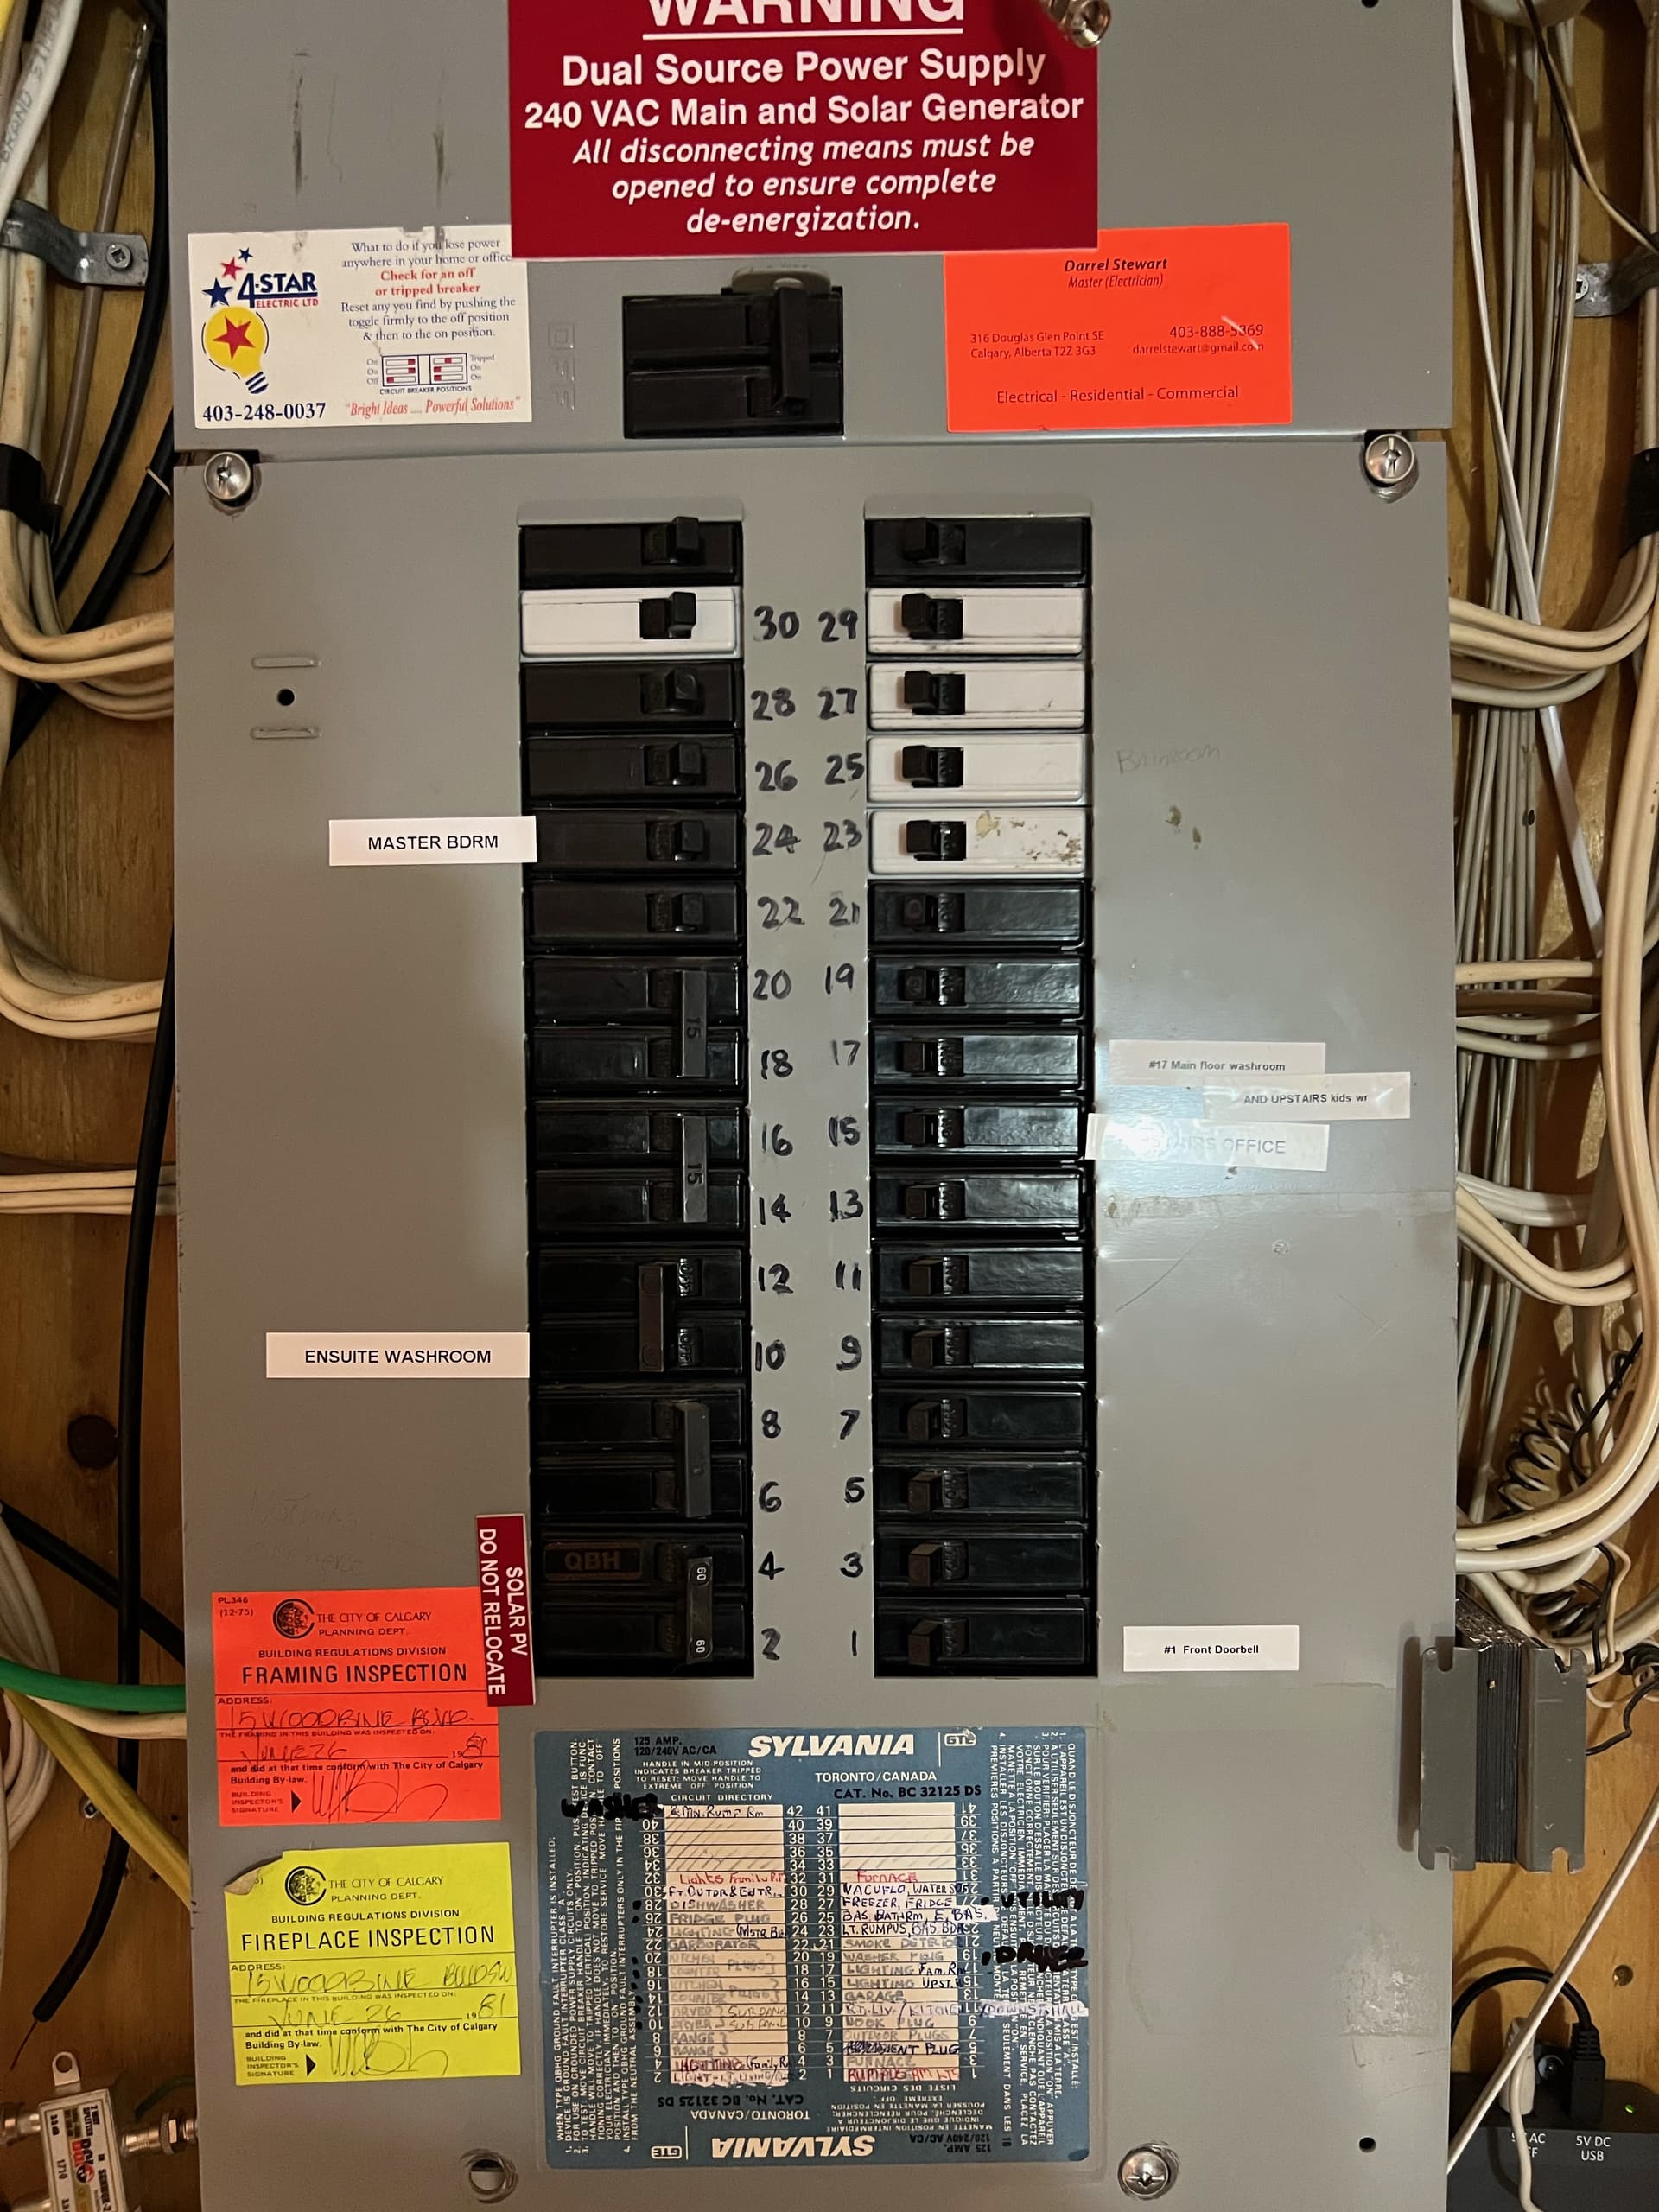
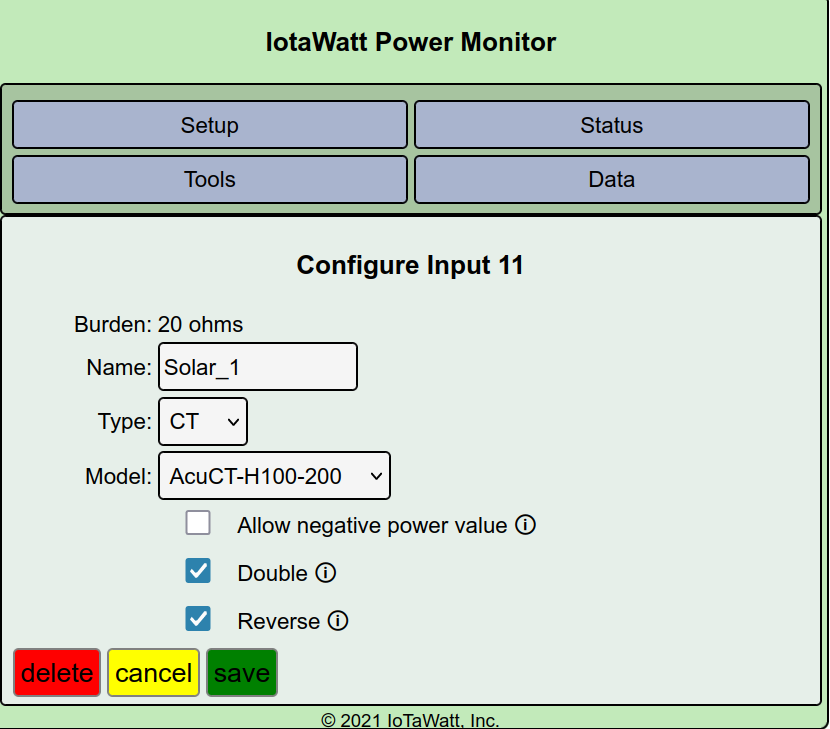
Stilllike to see a picture of the panel showing the CTs as installed. You show 200A CTs on the solar (and doubled?) yet your mains are only 100A. I think this is an installation/configuration problem.
purchased a kit and the 1 set of the CTs was 200A and I couldn’t put it anywhere in the system because it was soo large and too so much space so I used it in the subpanel that has the solar coming in.
I want to get the subpanel open where the solar is installed but 1 of the screws is stripped.
I know I’m a system 2 according to the docs ; its located downstream of my mains .
Also the reason I doubled the 200A CTs is because in the docs it talks about 240V similar to water pumps etc. and should be dbl
Ok, I am going to try and get this stripped screw off .
before i got the solar ; everything was working perfectly good.
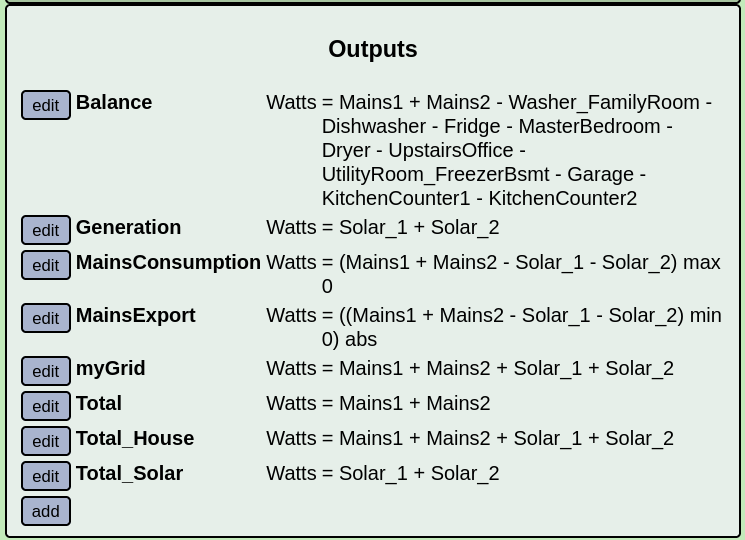
Can you tell me atleast whether regardless of if the solar panel CTs are correct if the MainConsumption or MainExport is correct ?
Now with the introduction of solar generation doesn’t everything become wrong ? I can’t even rely on Main1 + Main2 … right ?
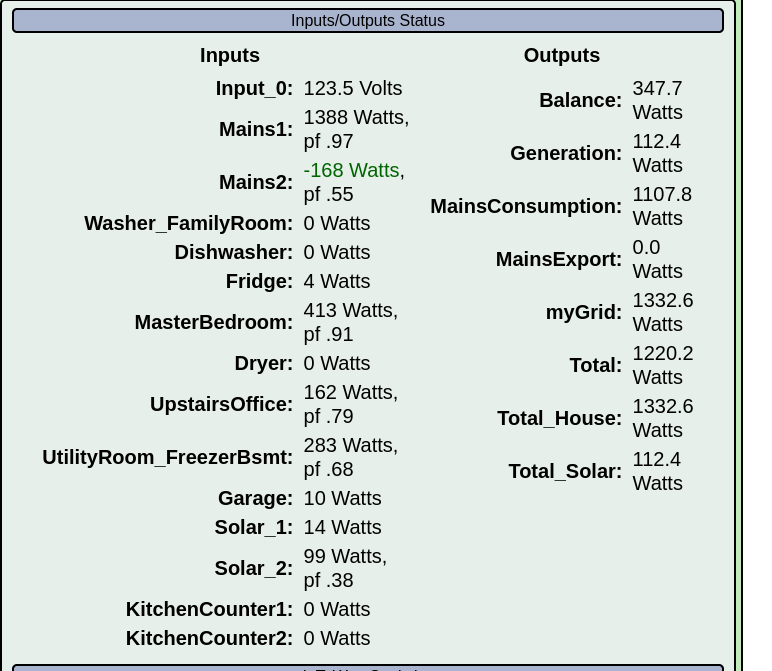
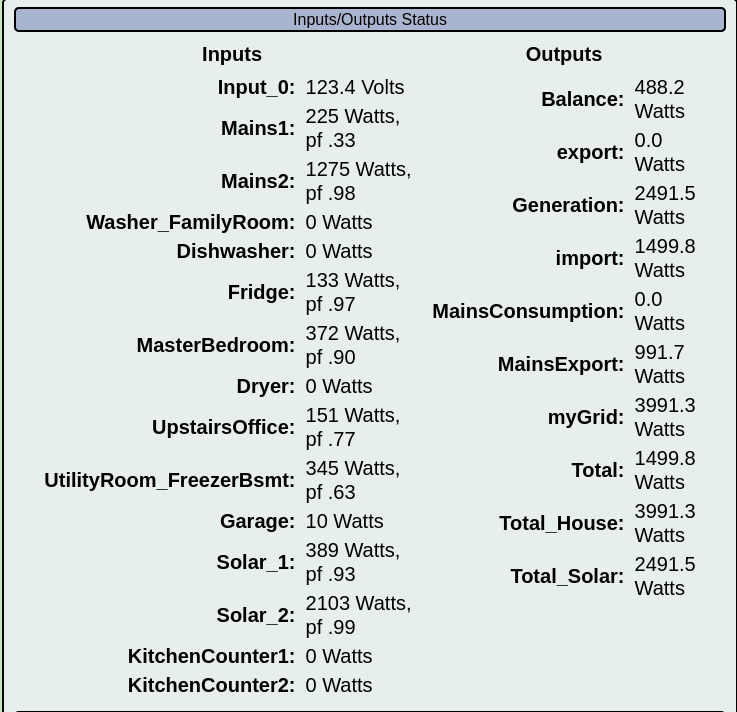
Assuming you are in North America, the timing of your response to my request for a status display during generation suggests that it was not actually during generation, notwithstanding the Solar_2 99Watts.
Power factors and other inconsistencies also suggest potential multiple problems. Seeing the actual CT installation will help me ask more informed questions.
If the sun is out now, another status display would be helpful.
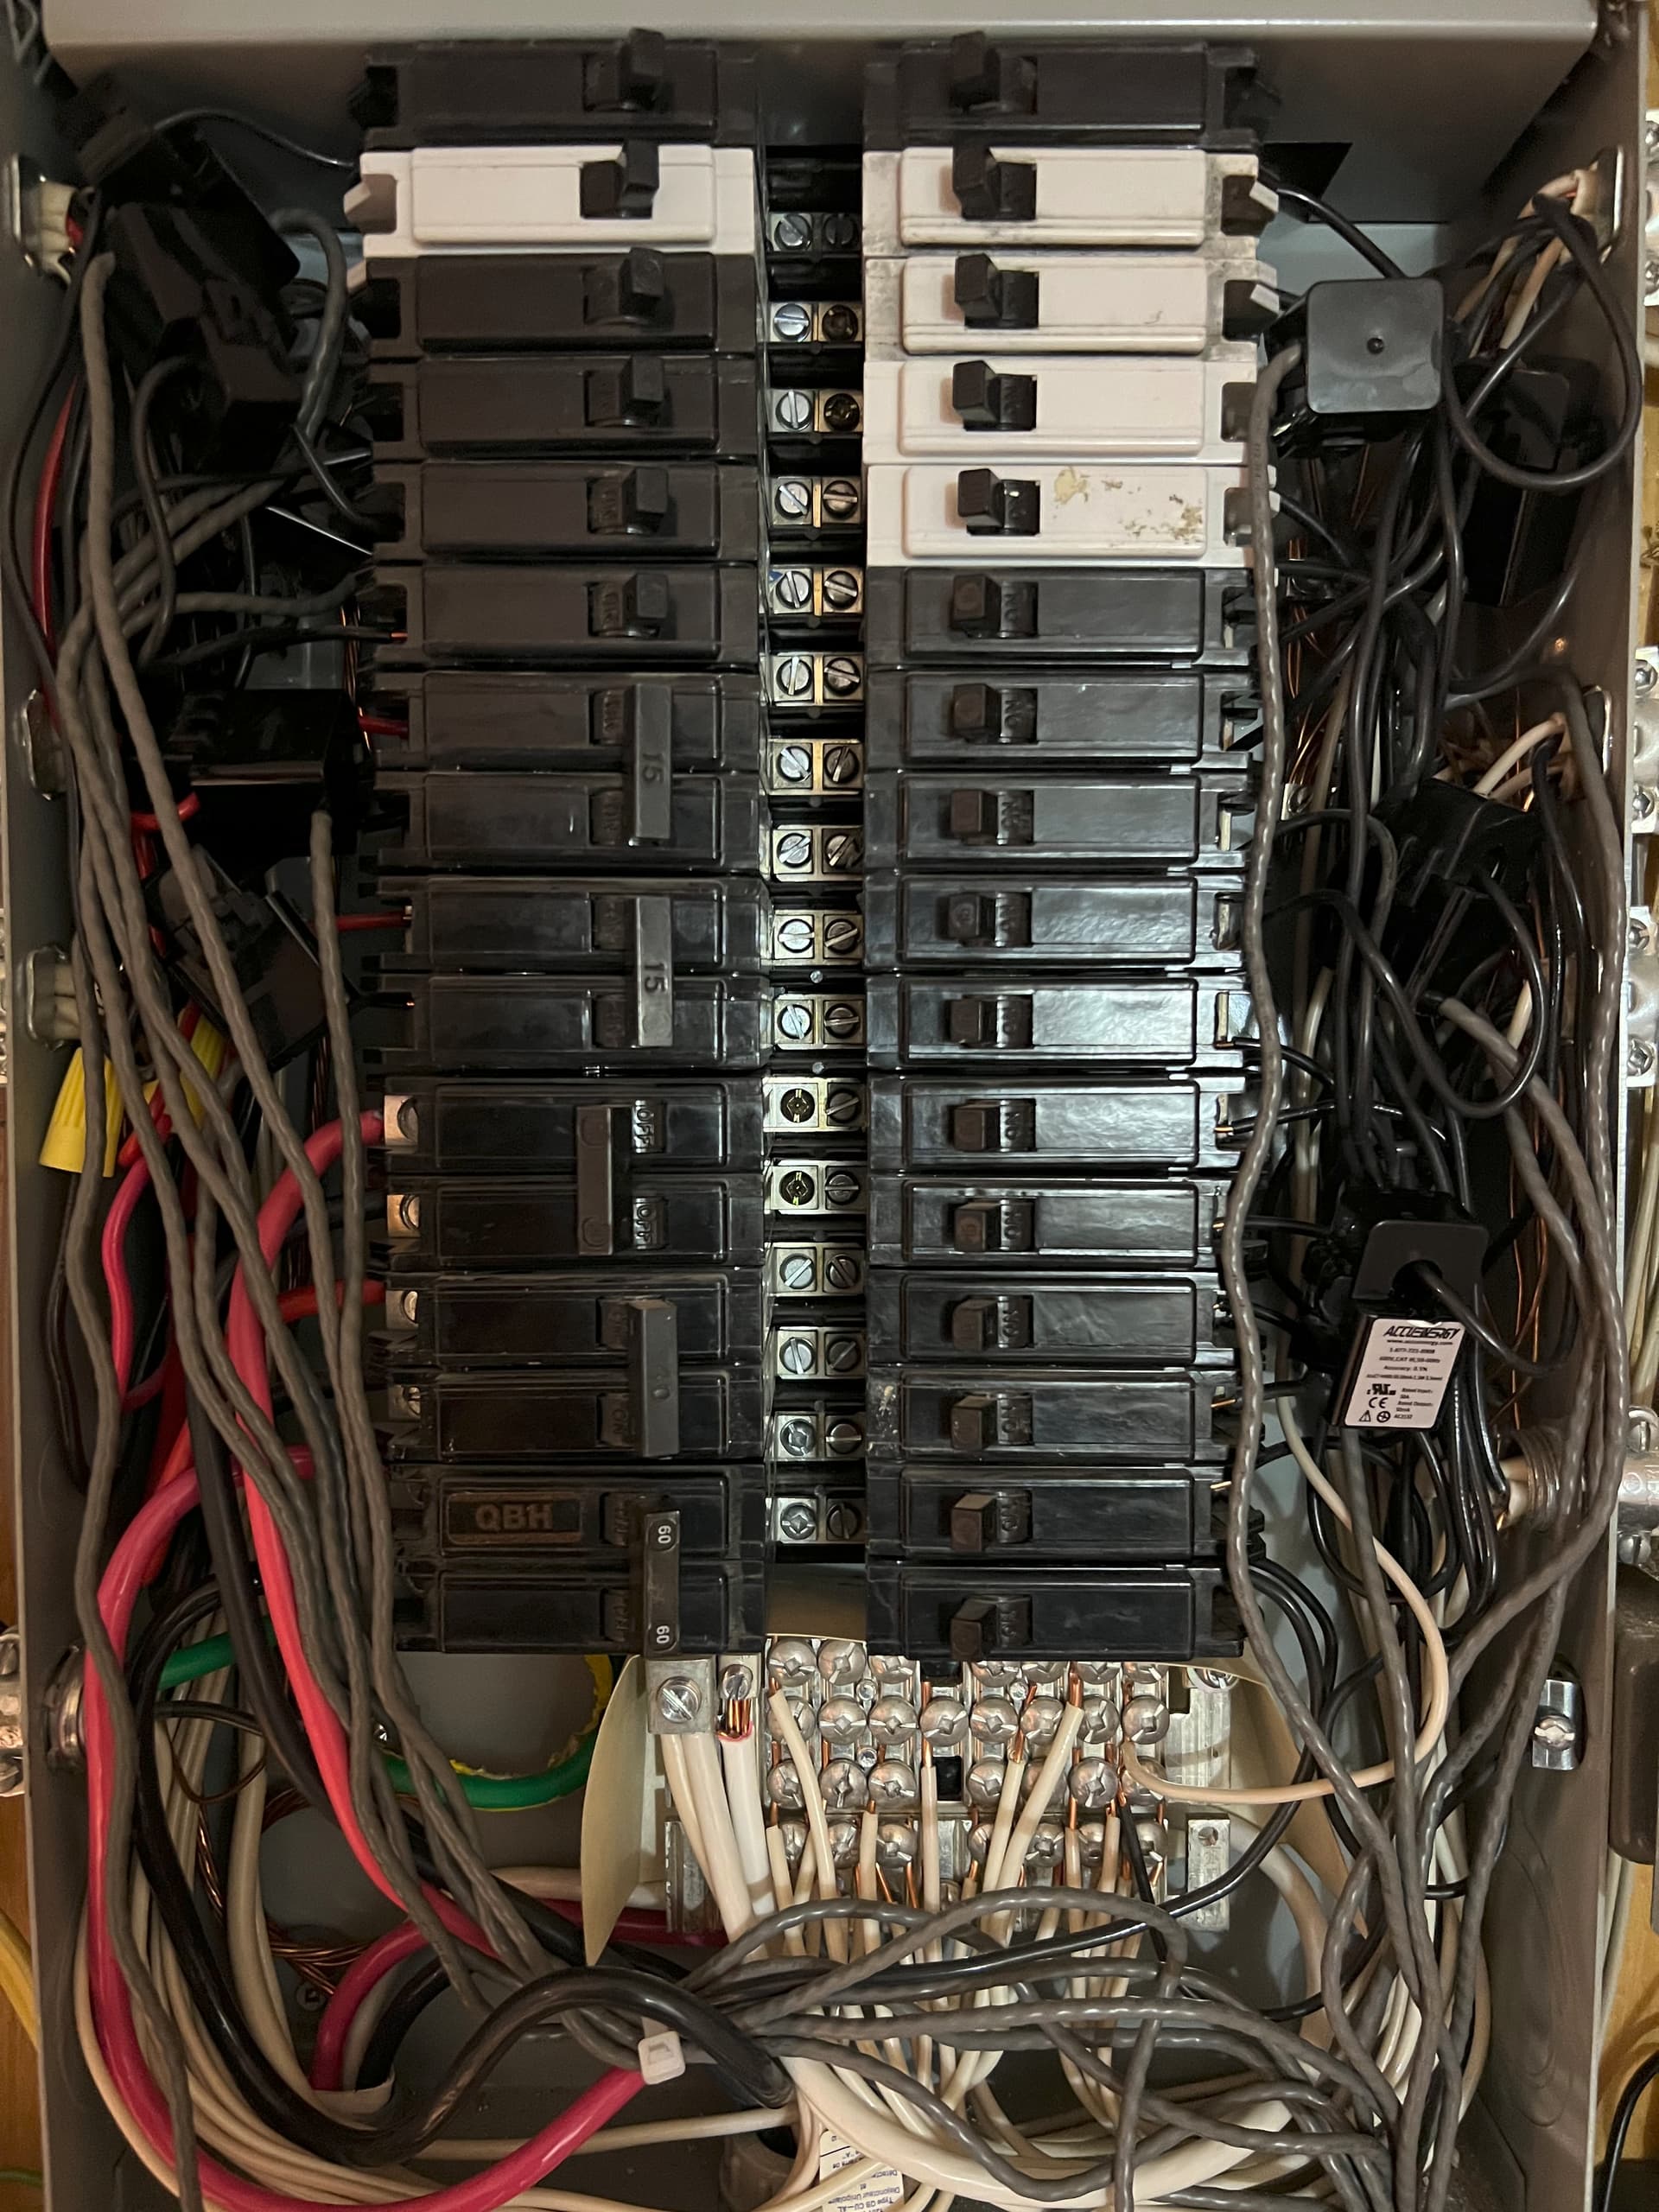
Edit: Sinceyou brought up the mains, a picture of that panel would be appropriate as well. Good focus and high resolution helps as I zoom in on these. The labels and CT values on the above pics cannot be read.
Please let me know if any of the photos need to be retaken or I could do anything else to help.
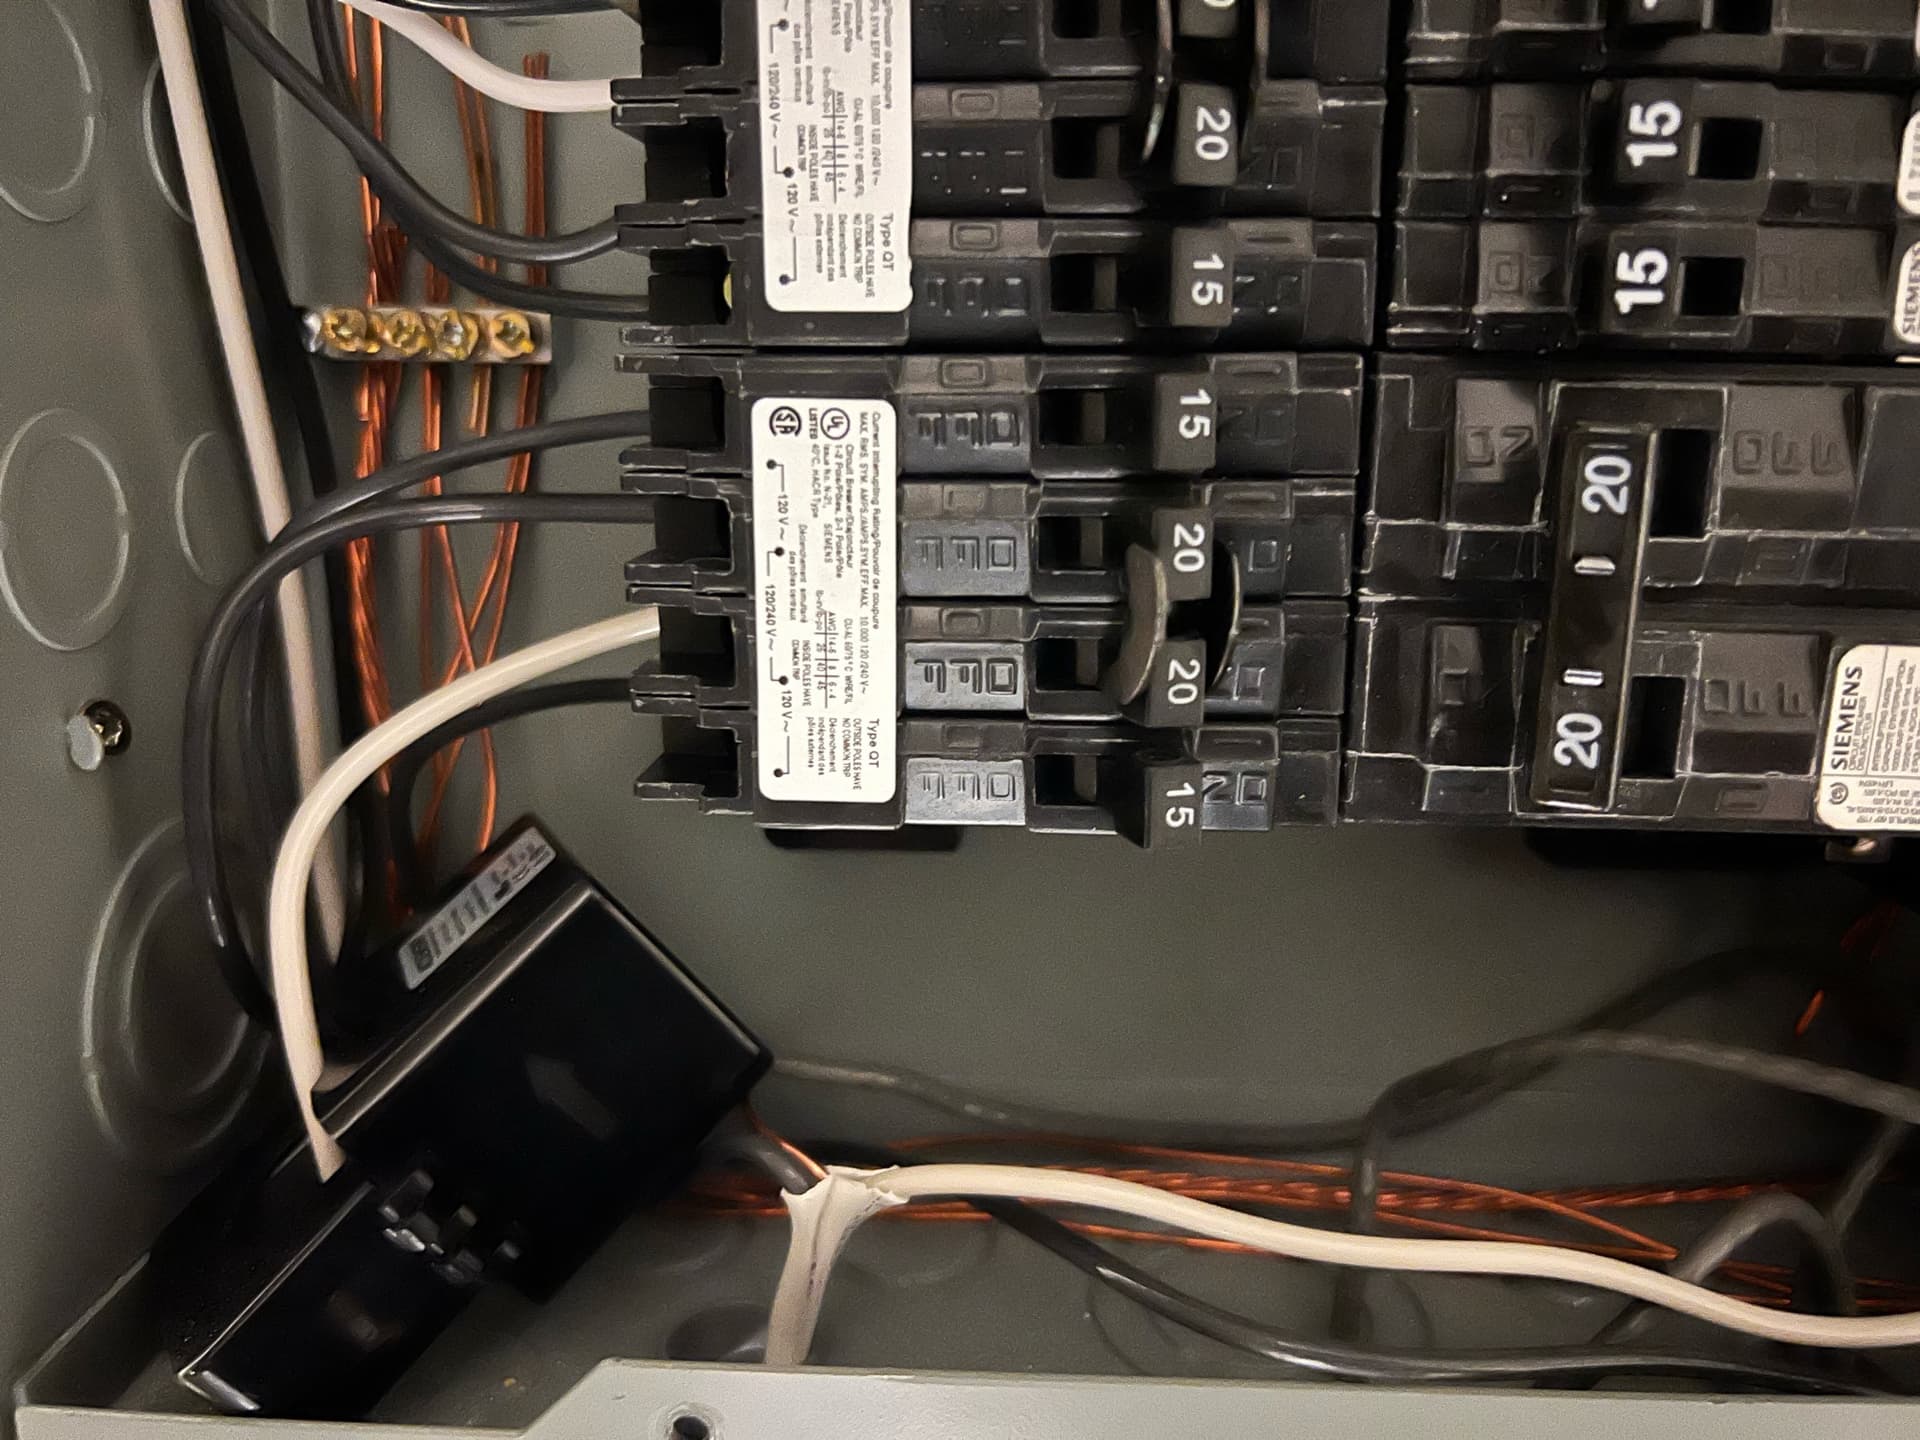
I have the wires photos in my post 20mins ago that I edited.
If I move the one on the left to the right side on the Black ; and Double it …
and keep the White one as Single and keep it on the right hand side…
I get pretty close for a # that matches the app… does that even make sense or is it just a coincidence?
I know 1 Breaker has 3 Inverters
and the 2nd Breaker has 6 Inverters
What I don’t understand is how the math adds up when I have 2 CTs just connected to the bottom-right breaker (1 on black [which I doubled] and 1 on white)
The plot thickens. So you have two solar feeds. That opens up a new line of questions.
When you say 3 and 6 inverters, are you talking about micro-inverters?
How are these inverters aggregated to provide the output metrics in the “app” that you are comparing?
In the most recent status display Solar_1 is 389 Watts and Solar_2 is 2103 Watts. Would there be a reason why Solar_2 would be so much higher, even given twice as many inverters and probably panels? Something like significantly different orientation?
Based on the first Status display with Main_2 exporting 168 Watts, I question that the mains are correctly installed. The pictures of the main panel don’t appear to show the Mains CTs.
Understand also that the solar app will probably not agree with IoTaWatt on a day when the solar is constantly varying to any extent. Typically the way that works is that the source of the inverter metrics uploads that data to the cloud periodically, and then the app downloads it. There can be latency that would affect the Watts while the IoTaWatt status is updating directly every second. The agreement that I would be looking for would be between the app’s “Today’s Energy” and IoTaWatt’s daily energy total at the end of the production day. That said, the Watts should be in the same neighborhood.
That makes no sense to me based on the assertion that 1/3 of the production on the left side is not being measured.
Well the mains CTs have been there pre-solar.
When you install solar ; do the mains direction or something change ?
Yes so 3 Micro-Inverters on 1 circuit
6 on another ;
That is why I have 2 CTs allocated to Solar.
So on the bottom-right circuit ; putting 1 CT on the white wire looks good, and makes sense.
What doesn’t make sense is when I move 1 CT to the bottom-left side on the white ; why don’t the 2 add up to the right value. Do I need to put another wire through it ? On the bottom left there are 4 wires ; first 2 black, thenw hite, then black… Its apparently a 240V circuit ; some space saver thing
This would probably take 5 minutes to figure out if I was there and could see the big picture.
Just a hunch, but could you turn off the left solar breaker for a minute and check the values for Solar_1 and Solar_2? In that row of four breakers the solar is the middle two 20A that are coupled together.
no the output didn’t change at all ; other than just usual fluctuations
oh sorry you wanted me to check the app ?
i’m reporting what iotawatt was showing. I’ll do it again to check the app
Update: No Change on the app as well , wtf does that mean… oh man
I do know that the app will take time to refresh and could be up to an hour maybe