How can I simply view my total kwh used so I can see if it matches what my monthly bill? Would I do this on the graph screen?
This was originally under the influxDB support topic, but I have moved it to stand alone. I’m not sure the question actually is how to compare kWh using influx and grafana. In any event, the quickest and simplest way to do this is to use the IoTaWatt just like the electric meter.
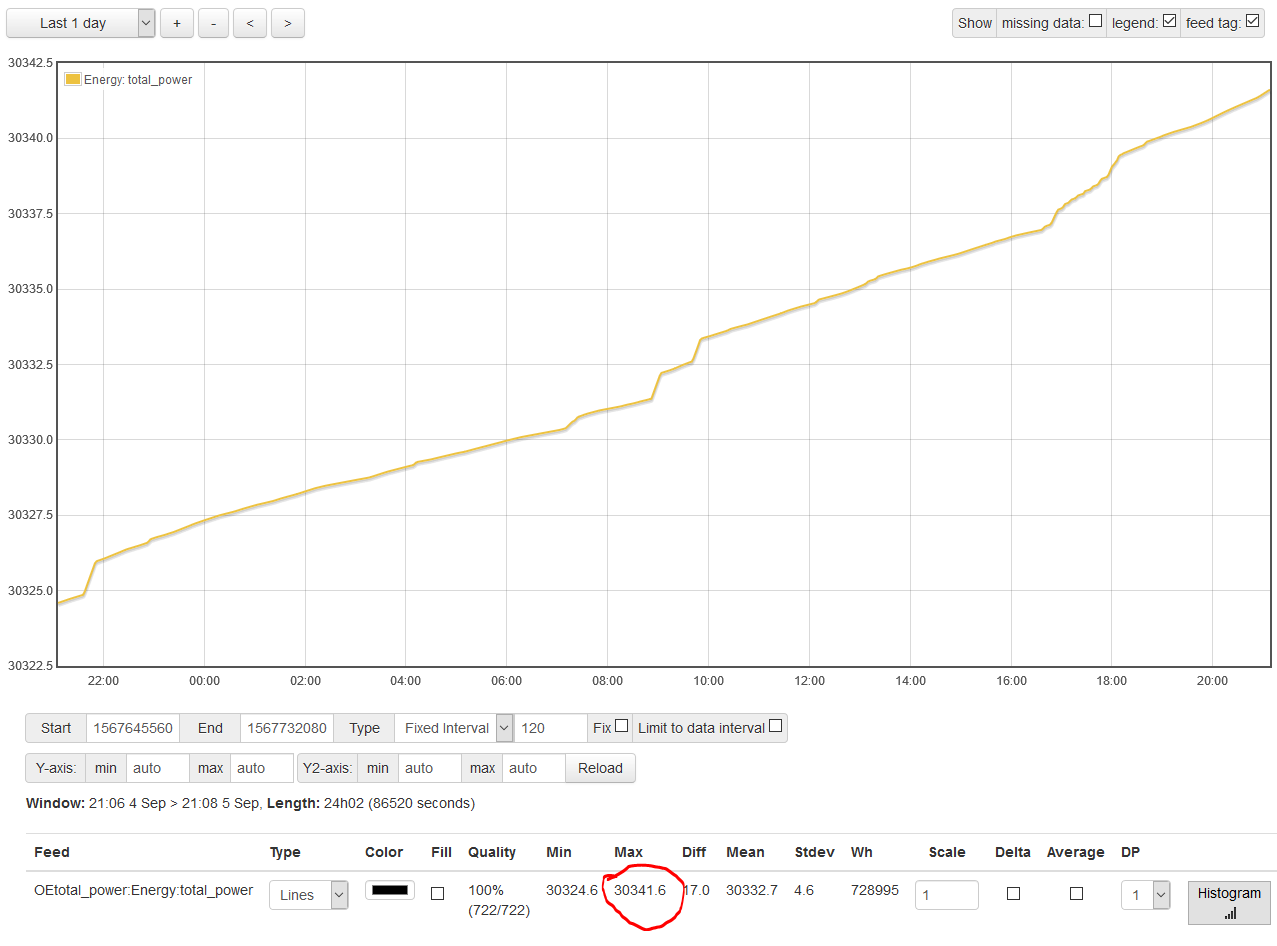
Internally, the IoTaWatt keeps track of both power and energy by logging cumulative Watt-Hours and cumulative Run-Time. In the simplest case, just looking at the current energy value is how to read the IoTaWatt “meter”. Here I’ve plotted my total power under the energy tab. My running total kWh is 30,342.
So if I read my utility meter and the IoTaWatt “meter” at the same time, then do the same after some reasonable period, the two meters should show nearly the same difference. I keey a spreadsheet with this data. I also have several revenue grade meters installed on various loads in the house and track those as well. Periodically I take readings of the physical meters and the IoTaWatt “meters”.
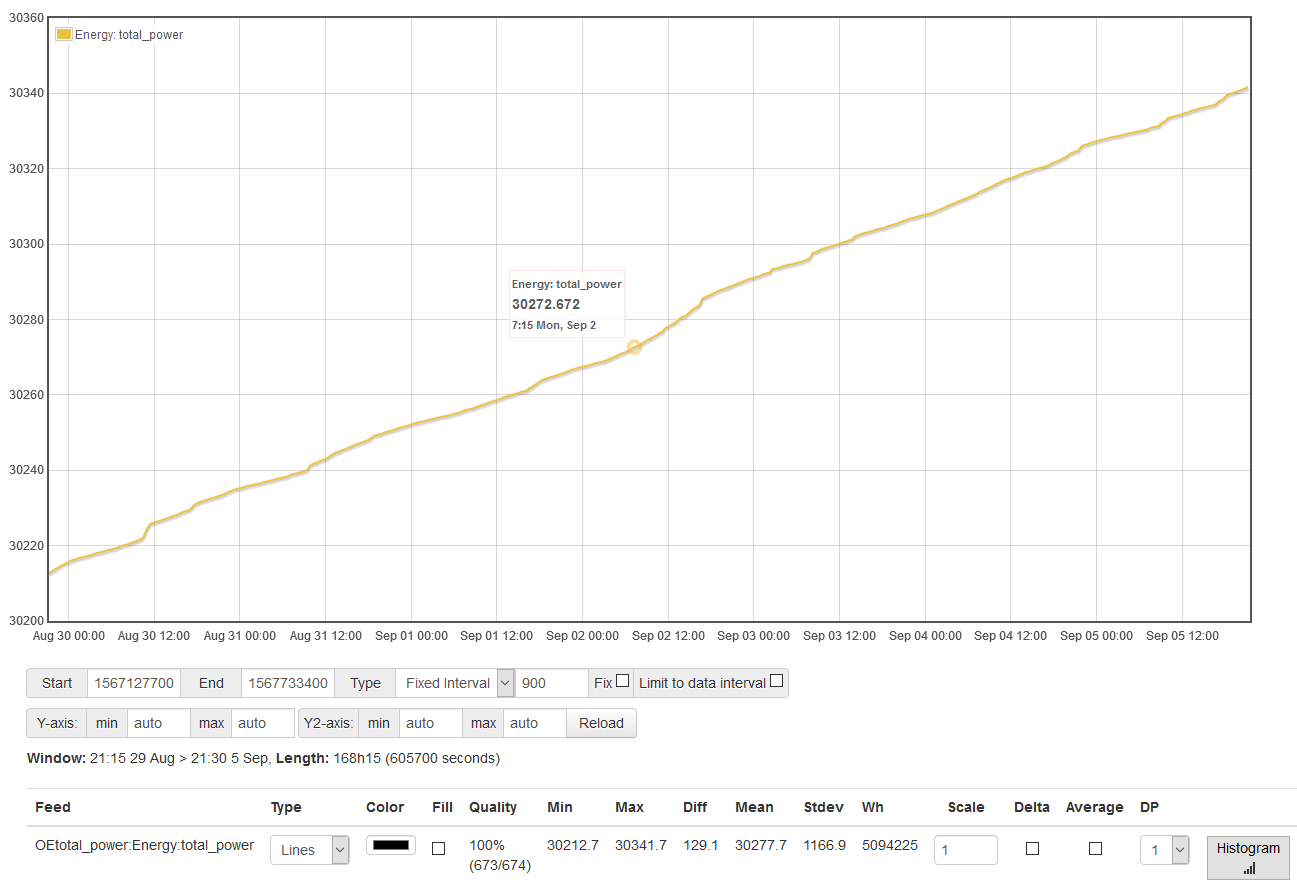
Comparing IoTaWatt readings to your monthly bill is problematic because you don’t know the times the meter was read. Nevertheless, if you are so inclined, you can get the historical reading of the IoTaWatt “meter” at any time. Simply plot the energy of your feed over a time period that includes the desired reading, and run the cursor along the plot. It will show the time and value at the cursor position. Zoom in if you need more accuracy.
As it happens, I’m currently working on finishing up the new graph utility. That will allow you to simply date/time select the starting and ending times, and the min/max/diff will be the starting/ending/total kWh of the IoTaWatt.
Thanks for the well explained answer. Personally I would really appreciate the new graph utilty u speak of.
Are these negative values making my energy count go down or up or does the negative values not due either.
KWhen the power goes negative it reduces the energy count so that it is a true “net” meter.
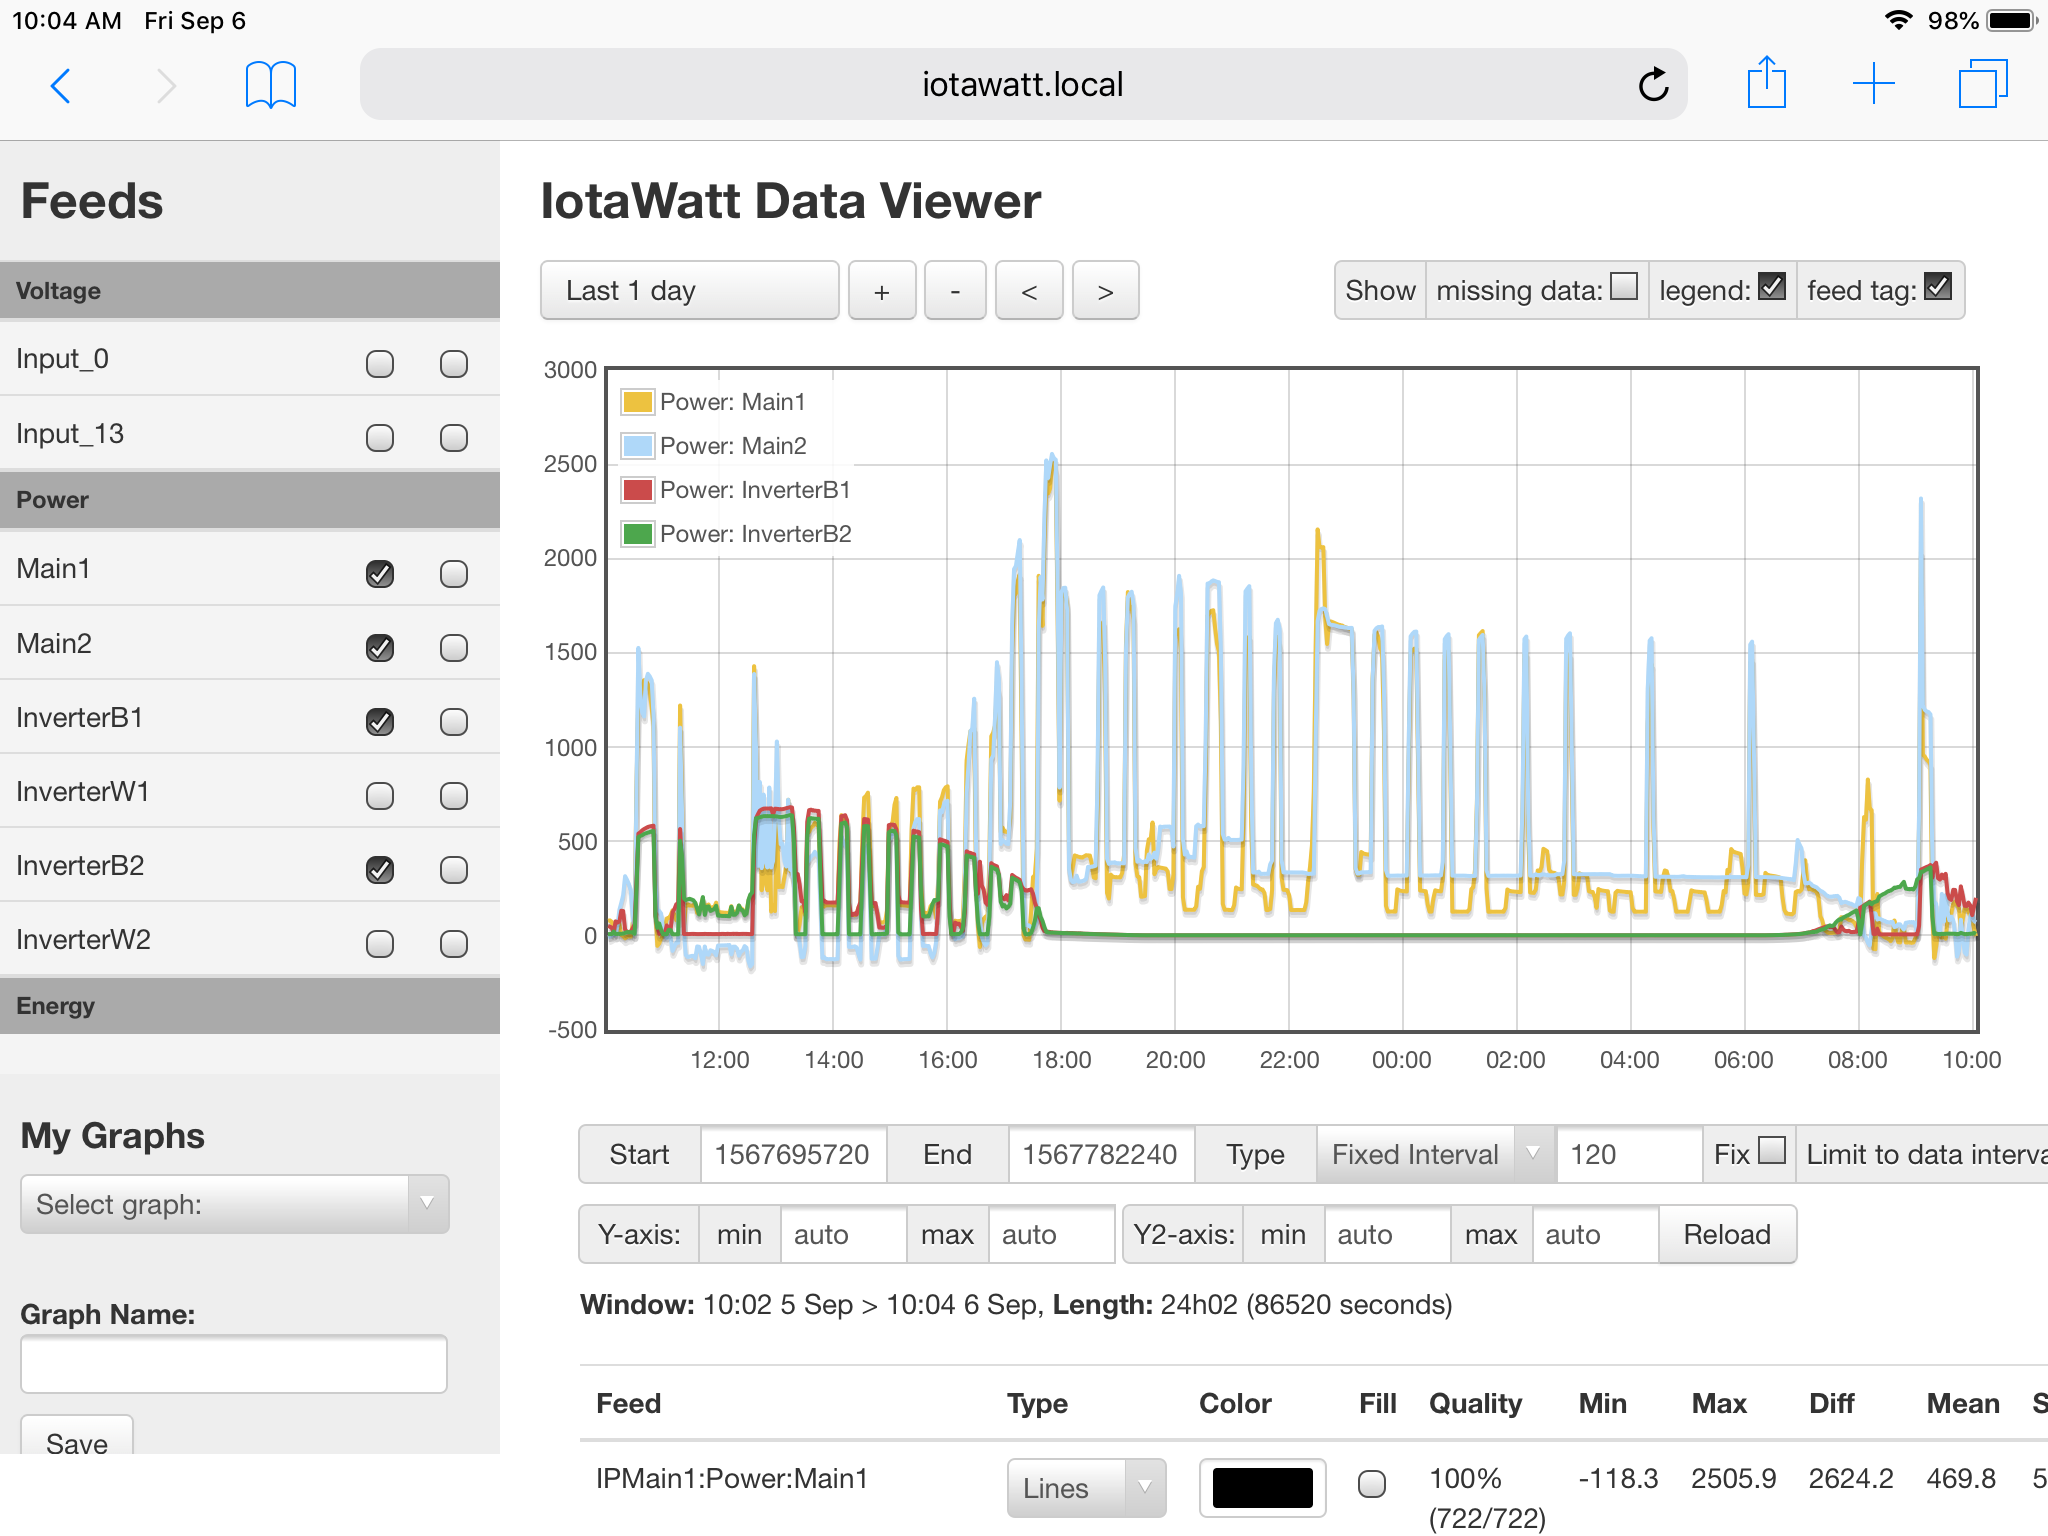
You might want to create outputs that add the two main legs together as well as outputs that add each of the solar legs together.
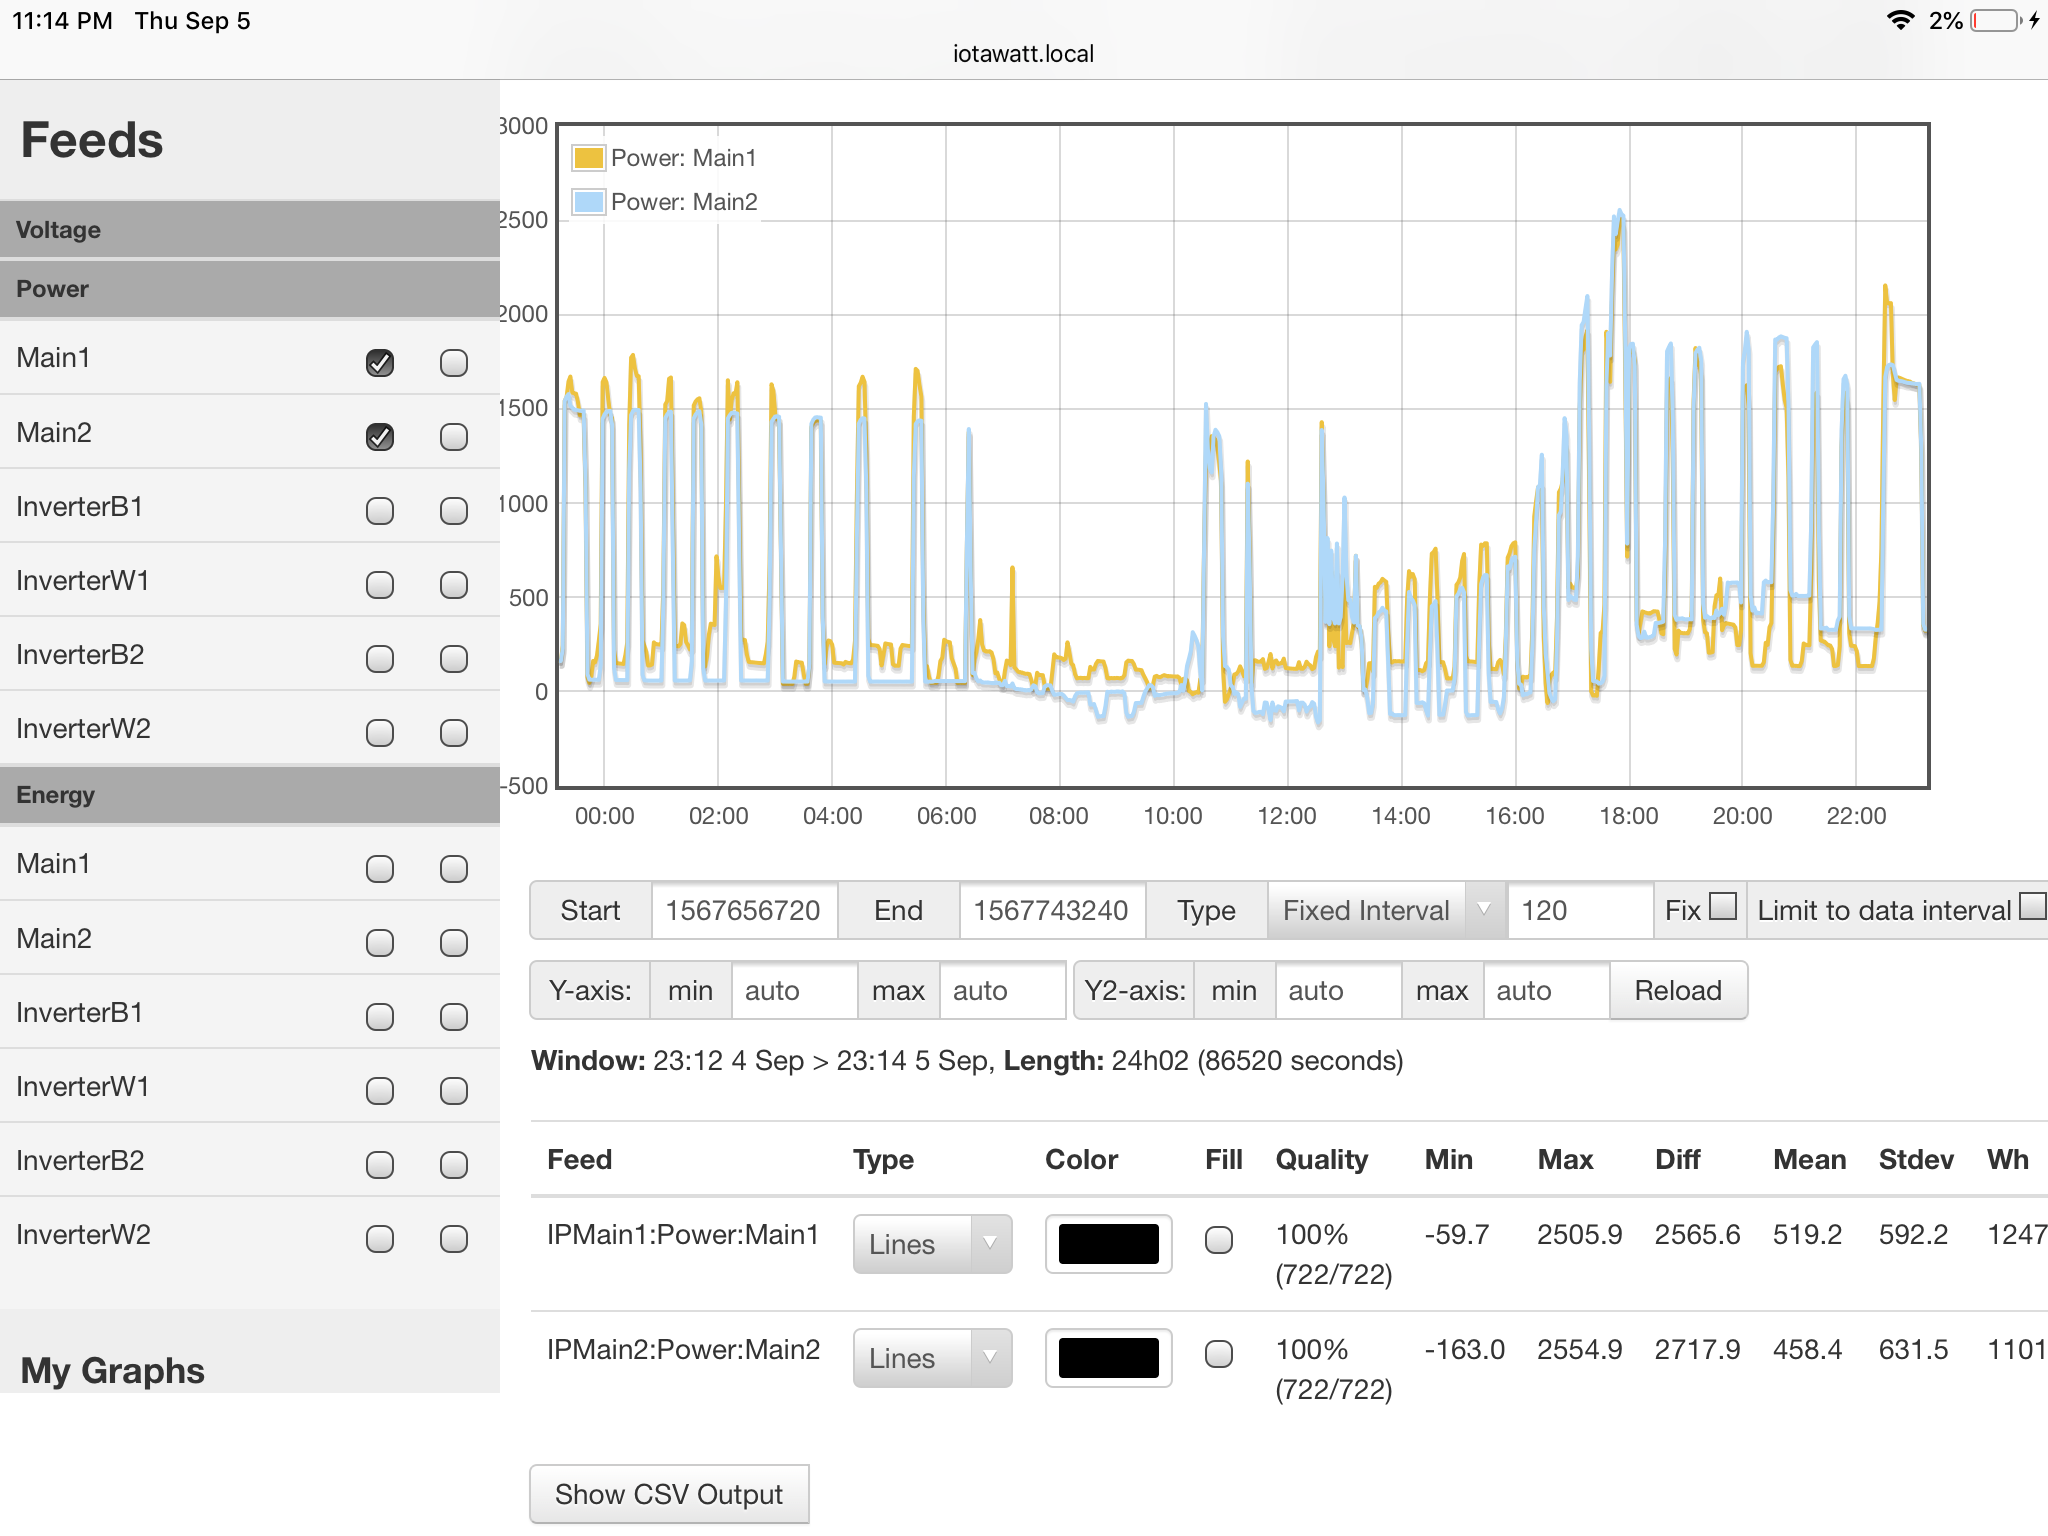
Also, I’m having difficulty understanding what was going on between 8am and about 1pm. I can see the inverted curve of the solar output in the mains, but don’t get why the two mains are a mirror of each other during that period. Did something change after 1pm?
Between 8am and 10am my loads were low enough that my 240v limiting inverters were acting like they were covering all my loads, but it seems as if the inverters are under supplying and over supplying by the same amount…
If the negative reduces my energy count then my electric company meter would have a higher count due to the electric company meter reading negative power (flowing the opposite direction) as positive power which I pay for…that’s if I’m actually reading everything correctly with the cts and my inverters are actually doing what I said above.
I’m really in the dark here about what this equipment does, how your metering is set up, what your tariffs are, how the inverters throttle using the SCT013 CTs on the mains. Without more context, I can’t answer your questions. This is definitely not a typical PV install.
 well that’s not what I wanted to here
Well I have an electric company smart meter on my home, that from what I gathered isn’t like the old meters that could just run backwards reducing power bill…the new meters read power flowing in opposite direction than it normally would as if it was power I was using…
The limiting inverters have a built in limiter, they use the 2 cts to combine the power being used from both legs of main panel and then not produce more than that and still let the grid feed a small amount of wattage to not let the inverters overfeed…
The inverters are supplying power thru their black and white wires then wired to a 240v breaker in main panel
I simply don’t understand how these limiting inverters are supposed to work, or how your electric meter works. It does not appear this is an ordinary setup, so I would need to know if the meter records “net” or only consumption. If it’s only consumption, is that net consumption or per-leg consumption. I think that’s what you are asking me, and I don’t know.
Missed the above posts while typing, let me catch up.
I believe the meter only reads consumption but also reads power flowing in the opposite direction as consumption
Are the inverters designed to work together? Do they communicate with each other?
Yes, if one inverter can supply all loads then it does, if it can’t then other inverter helps
Are you sure about that? That doesn’t sound very “smart”. I know some meters simply do not record export, but charging you for it seems odd. Do you have a picture of the meter?
The two cts combined send same signal to both inverters but both inverters will only power loads if one inverter can’t fully supply loads
Well the only thing smart about them is that the electric company can read them without coming to the house… from what I gathered most of the newer meter just reads power flowing in either direction as magnetism which is calculated as power being used…I’ll run outside and take a pic of it…it’s a grafana I think
Lets just eliminate this two-leg analysis and look at the big picture, compare that to the meter over a day or two, and then if it differs, we can look for the difference.
Can you create an output
Total_power = Main1 + Main2
graph it and post, then graph it’s energy and record the max kWh along with your meter reading. Then do the same each of the next few days and post.
I kinda did something similar but hasn’t been a day yet,last night a 11pm my meter displayed 27252… my mains had 29kwh and 30.6 kwh at that same time…
Now it’s 27261 on meter. And also now mains reads 33.4 and 35.7 kwh
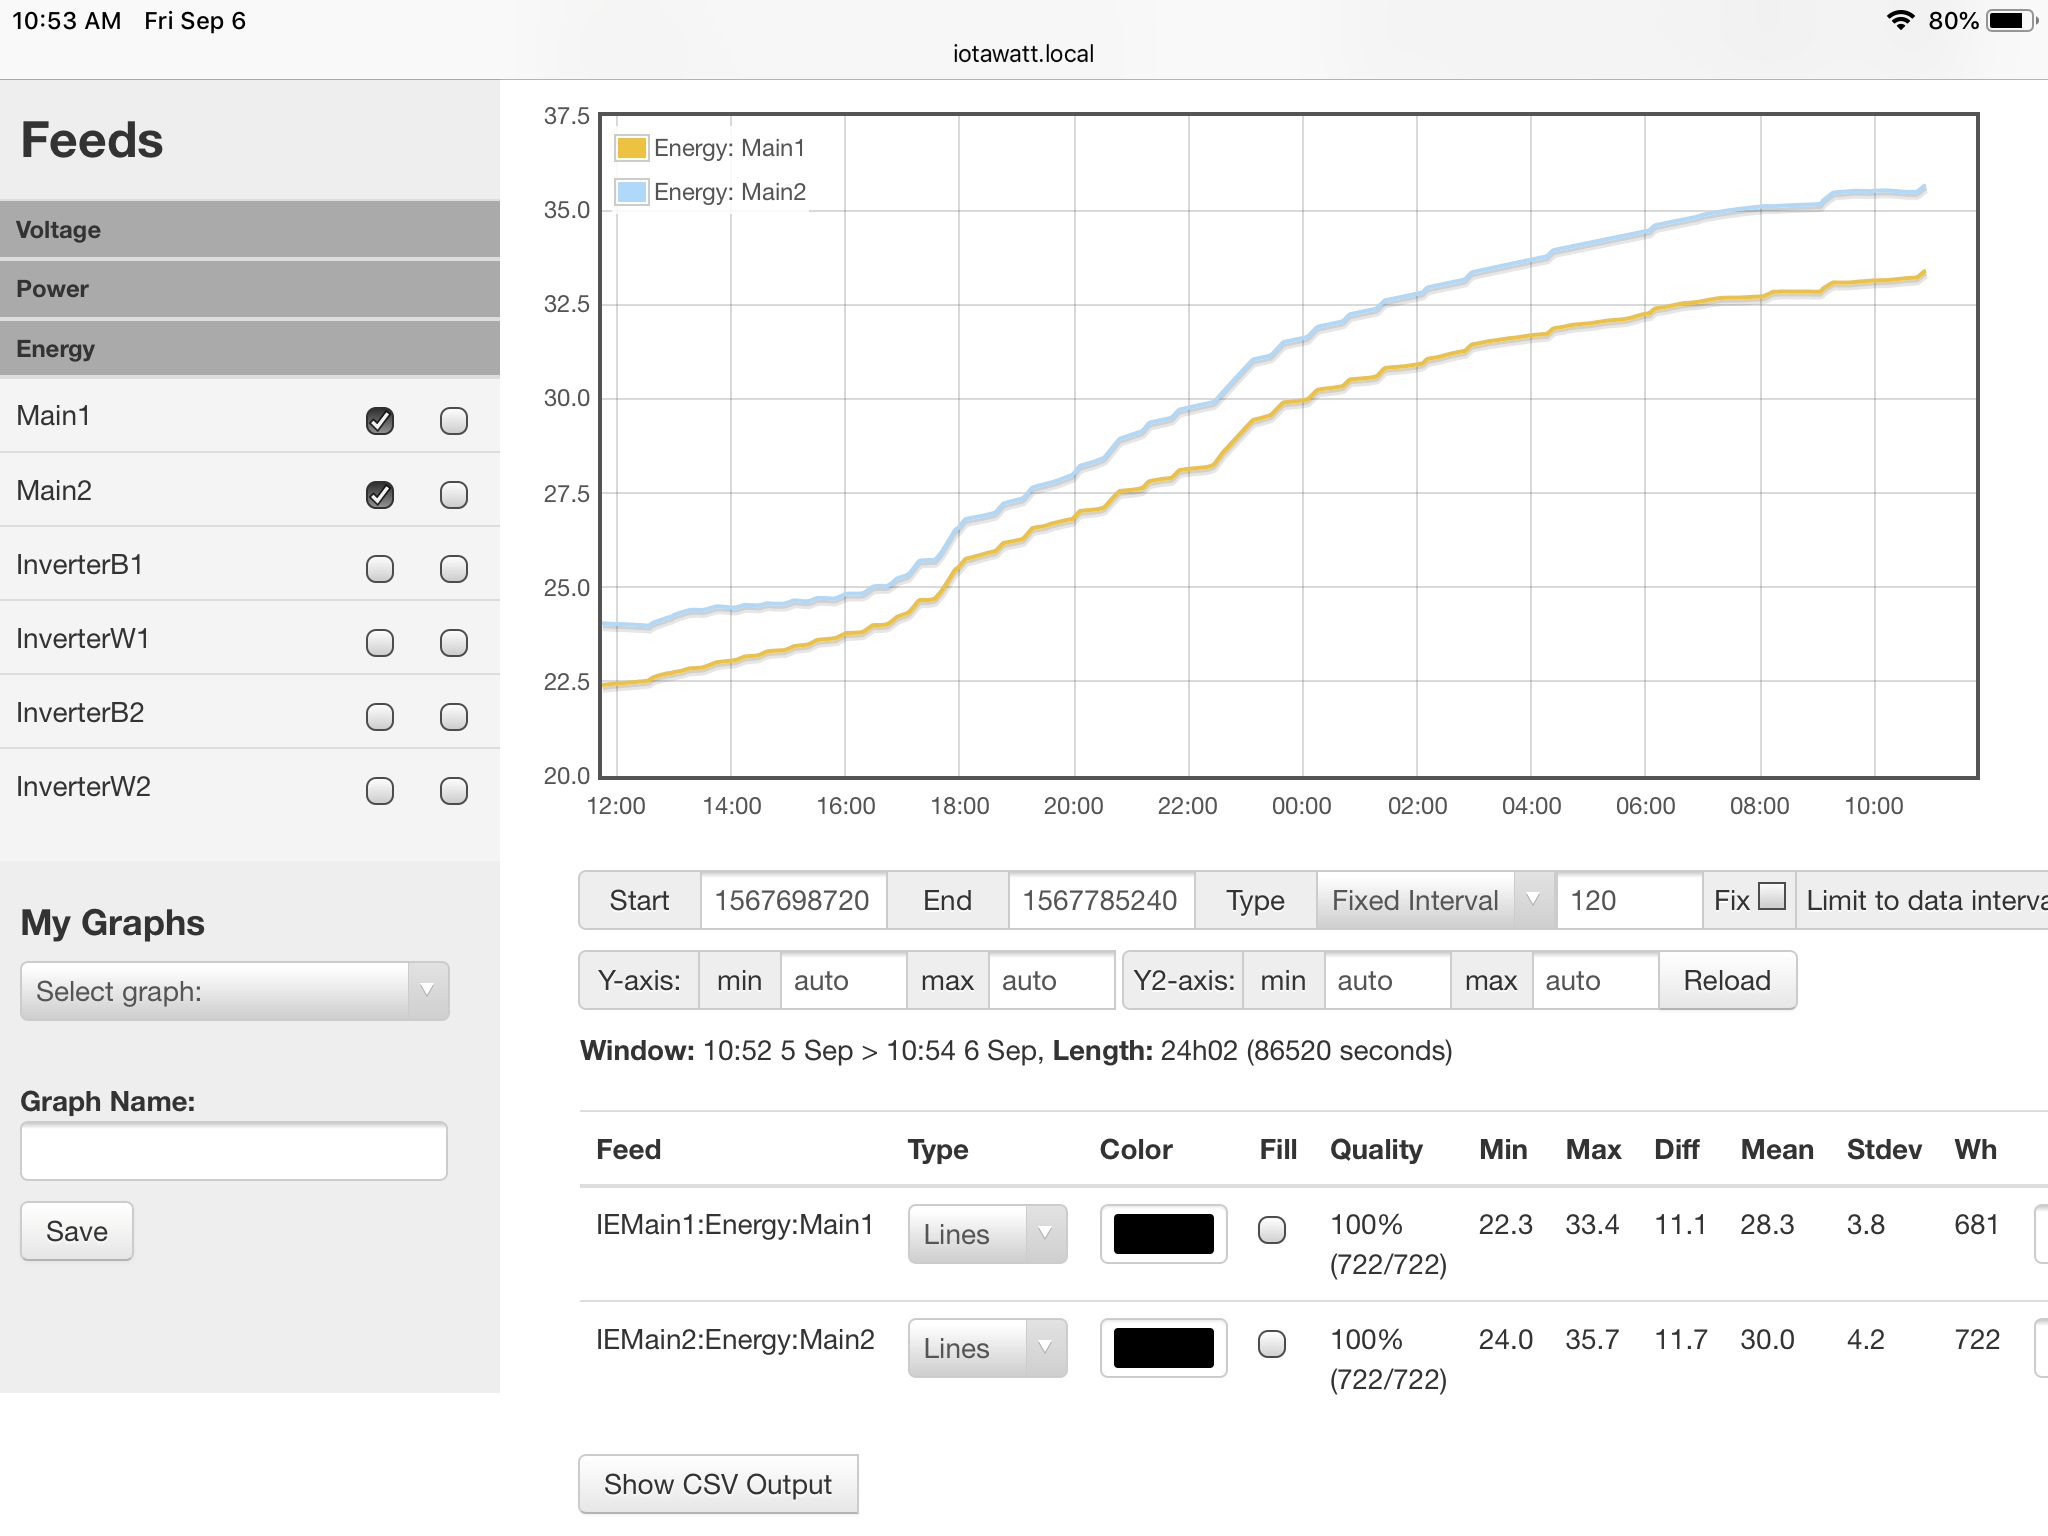
Where do I input to create an output that combines mains?
So far it seems as if the iotawatt measurements match the meter very closely