Thanks @overeasy . I now understand your reasoning much better.
My plan is now to do a hard reset of the IotaWatt and set it up from scratch following your convention here. I will then reconcile graph+ with my solar install before setting up my feed to InfluxDB.
It’ll take me a while, probably next week now. I’ll let you know how it goes.
Just to clarify a few things:
Does the command IoTaWatt.local/command?deletelog=both do a complete factory reset (All data and settings) or just delete all the data leaving the settings (Inputs, outputs, etc, etc) as is?
When doing this should I set everything to Units=Watts and not have any kWh settings?
No, there is no “factory reset”. I would recommend:
Delete your integrator(s)
Edit your config to the desired new config.
Run the deletelog command as above.
Create the new integrator.
It’s set to Load First.
Do you have AC connections to your inverter for both Grid and UPS?
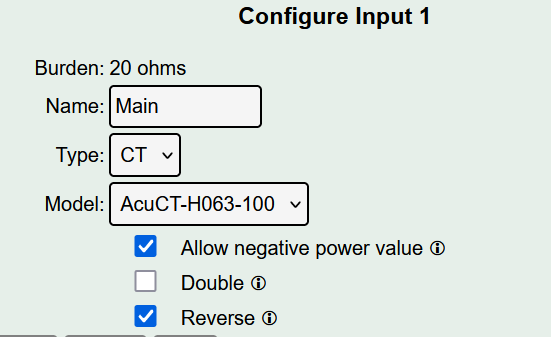
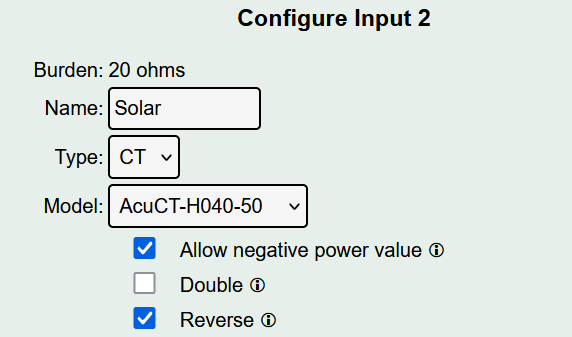
Assuming you only have one connection (Solar), please check allow negative values on Solar.
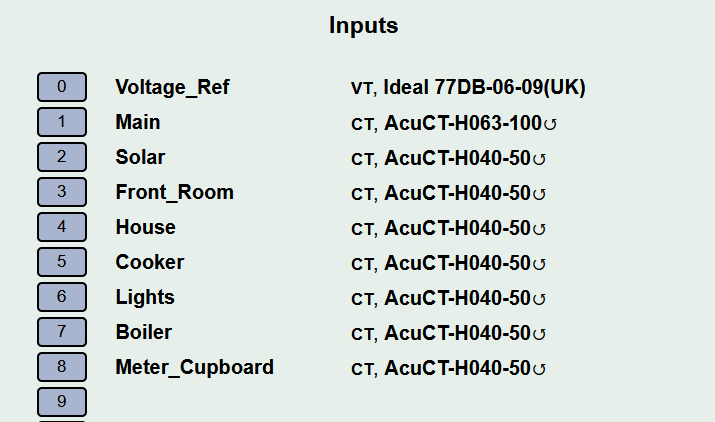
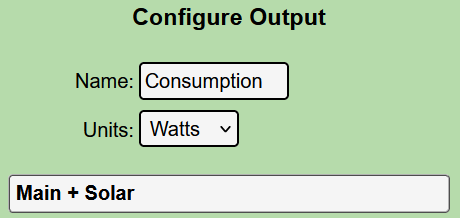
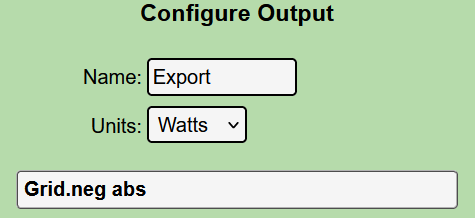
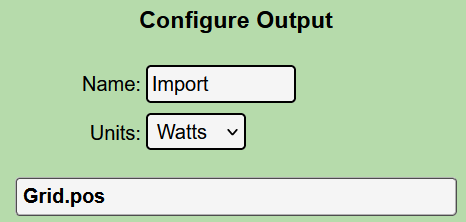
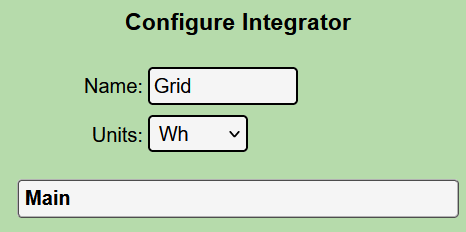
No UPS at this time (maybe in the future). I have checked allow neg values on the Solar CT and set up as per the following images. I think this is as per your naming convention but please give it the once over to check I haven’t screwed up.
I have reset the databases so no data to work with at the moment. I am away for a few days over the weekend so will let it gather data while away and, hopefully have good data to work with on my return.
Thanks again for your help @overeasy

1 Like
So, It’s been running for a few days now. Just run some stats for Saturday 29th Oct (as that is a day where I have 24hours of data and there were no clock changes).
I attach a pic og what Graph+ is showing and a table of what that compared to my Growatt stats and my smart meter is telling me.
Still seems to be a descrepancy?
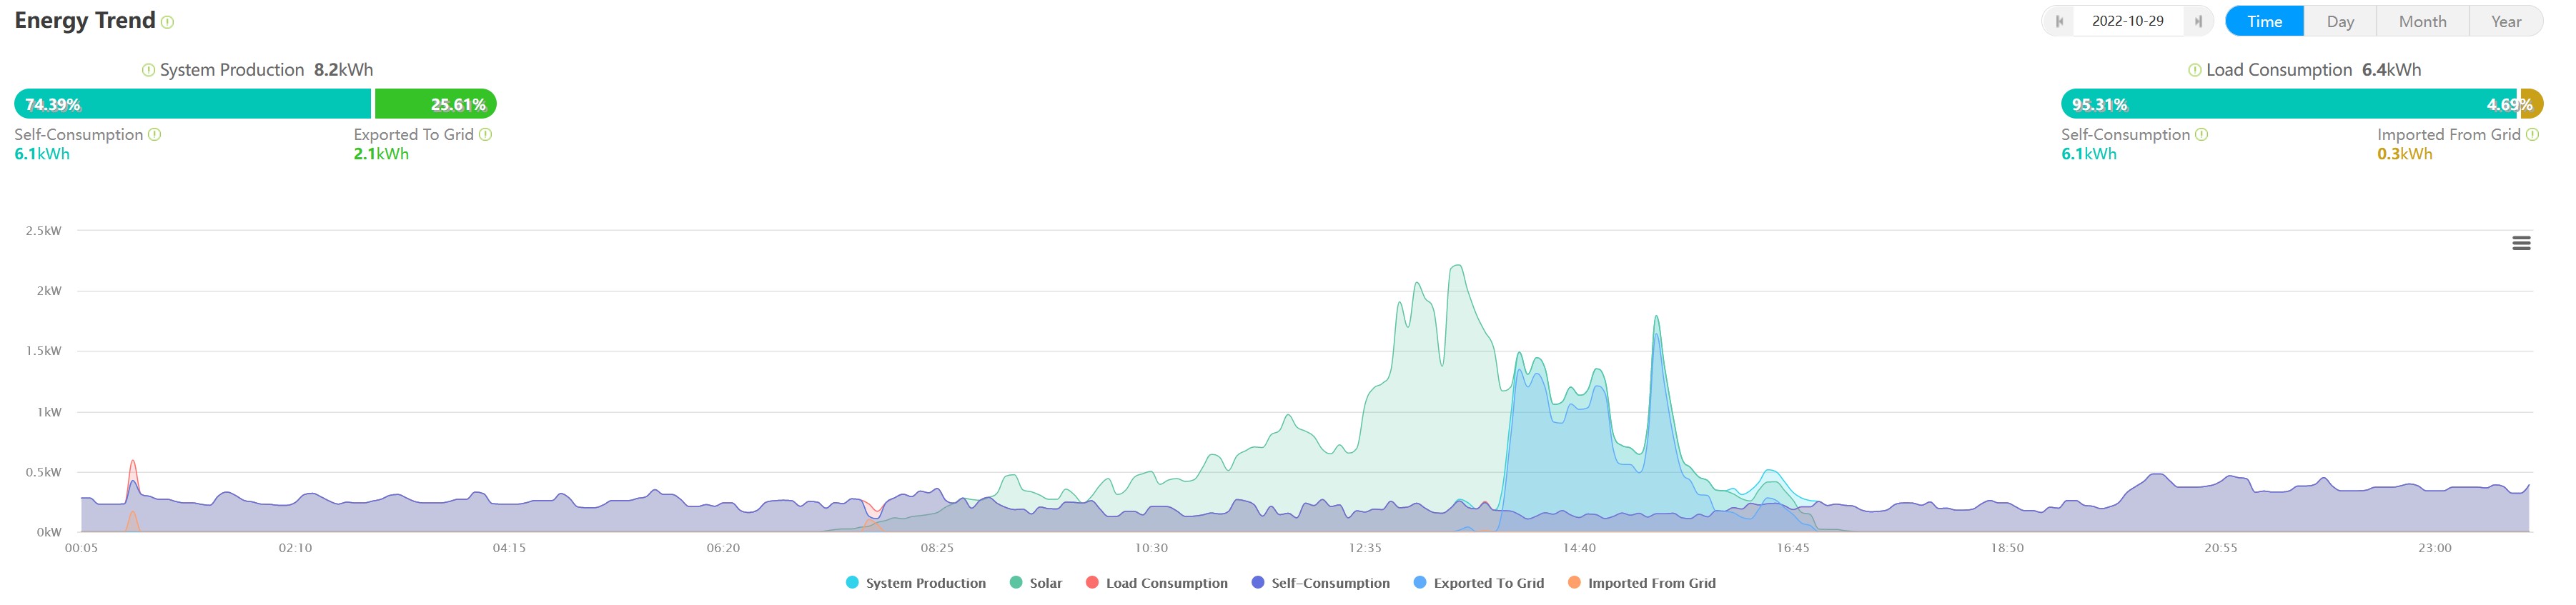
Growatt: Load Consumption=6.4kWh Imported=0.3kWh Exported=2.1kWh
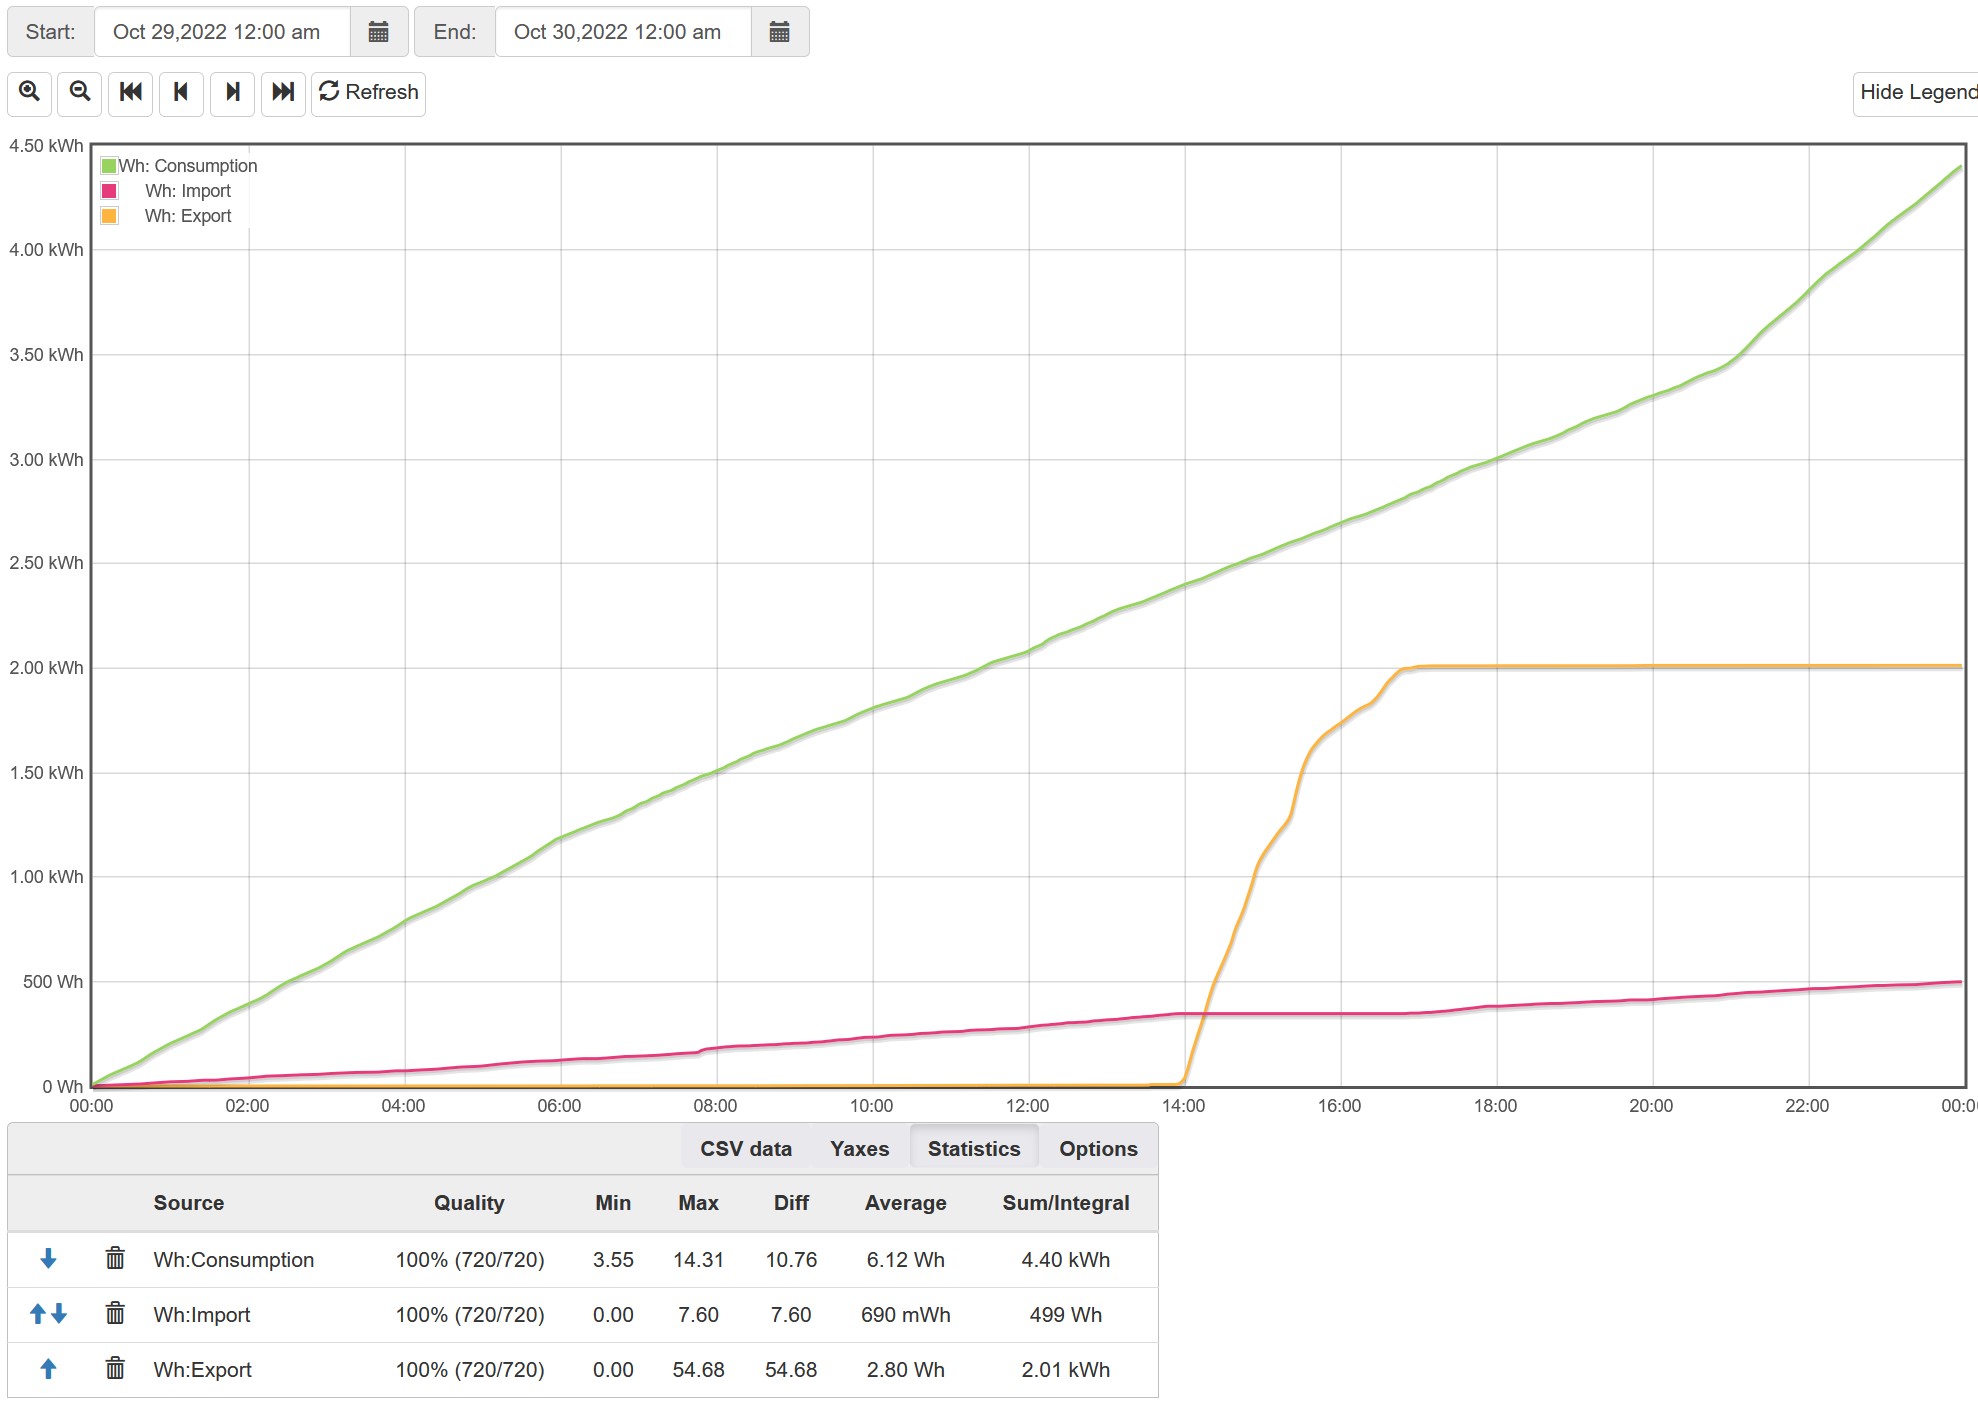
Graph+: Load Consumption=4.1kWh Imported=0.5kWh Exported=2.0kWh
SMETS: Imported=0.55kWh
What is SMETS? It seems to agree with the IoTaWatt.
Import and export are pretty close. Let’s try to reconcile everything. What meter readings do you have for that day?
Can you add the inverter output “Solar” to the Graph+ plot and show the Growatt display for the same day?
Sorry SMETS2 is the type of smart meter I have.
Yes, it seems to be the consumption figure that is out. The others are pretty close.
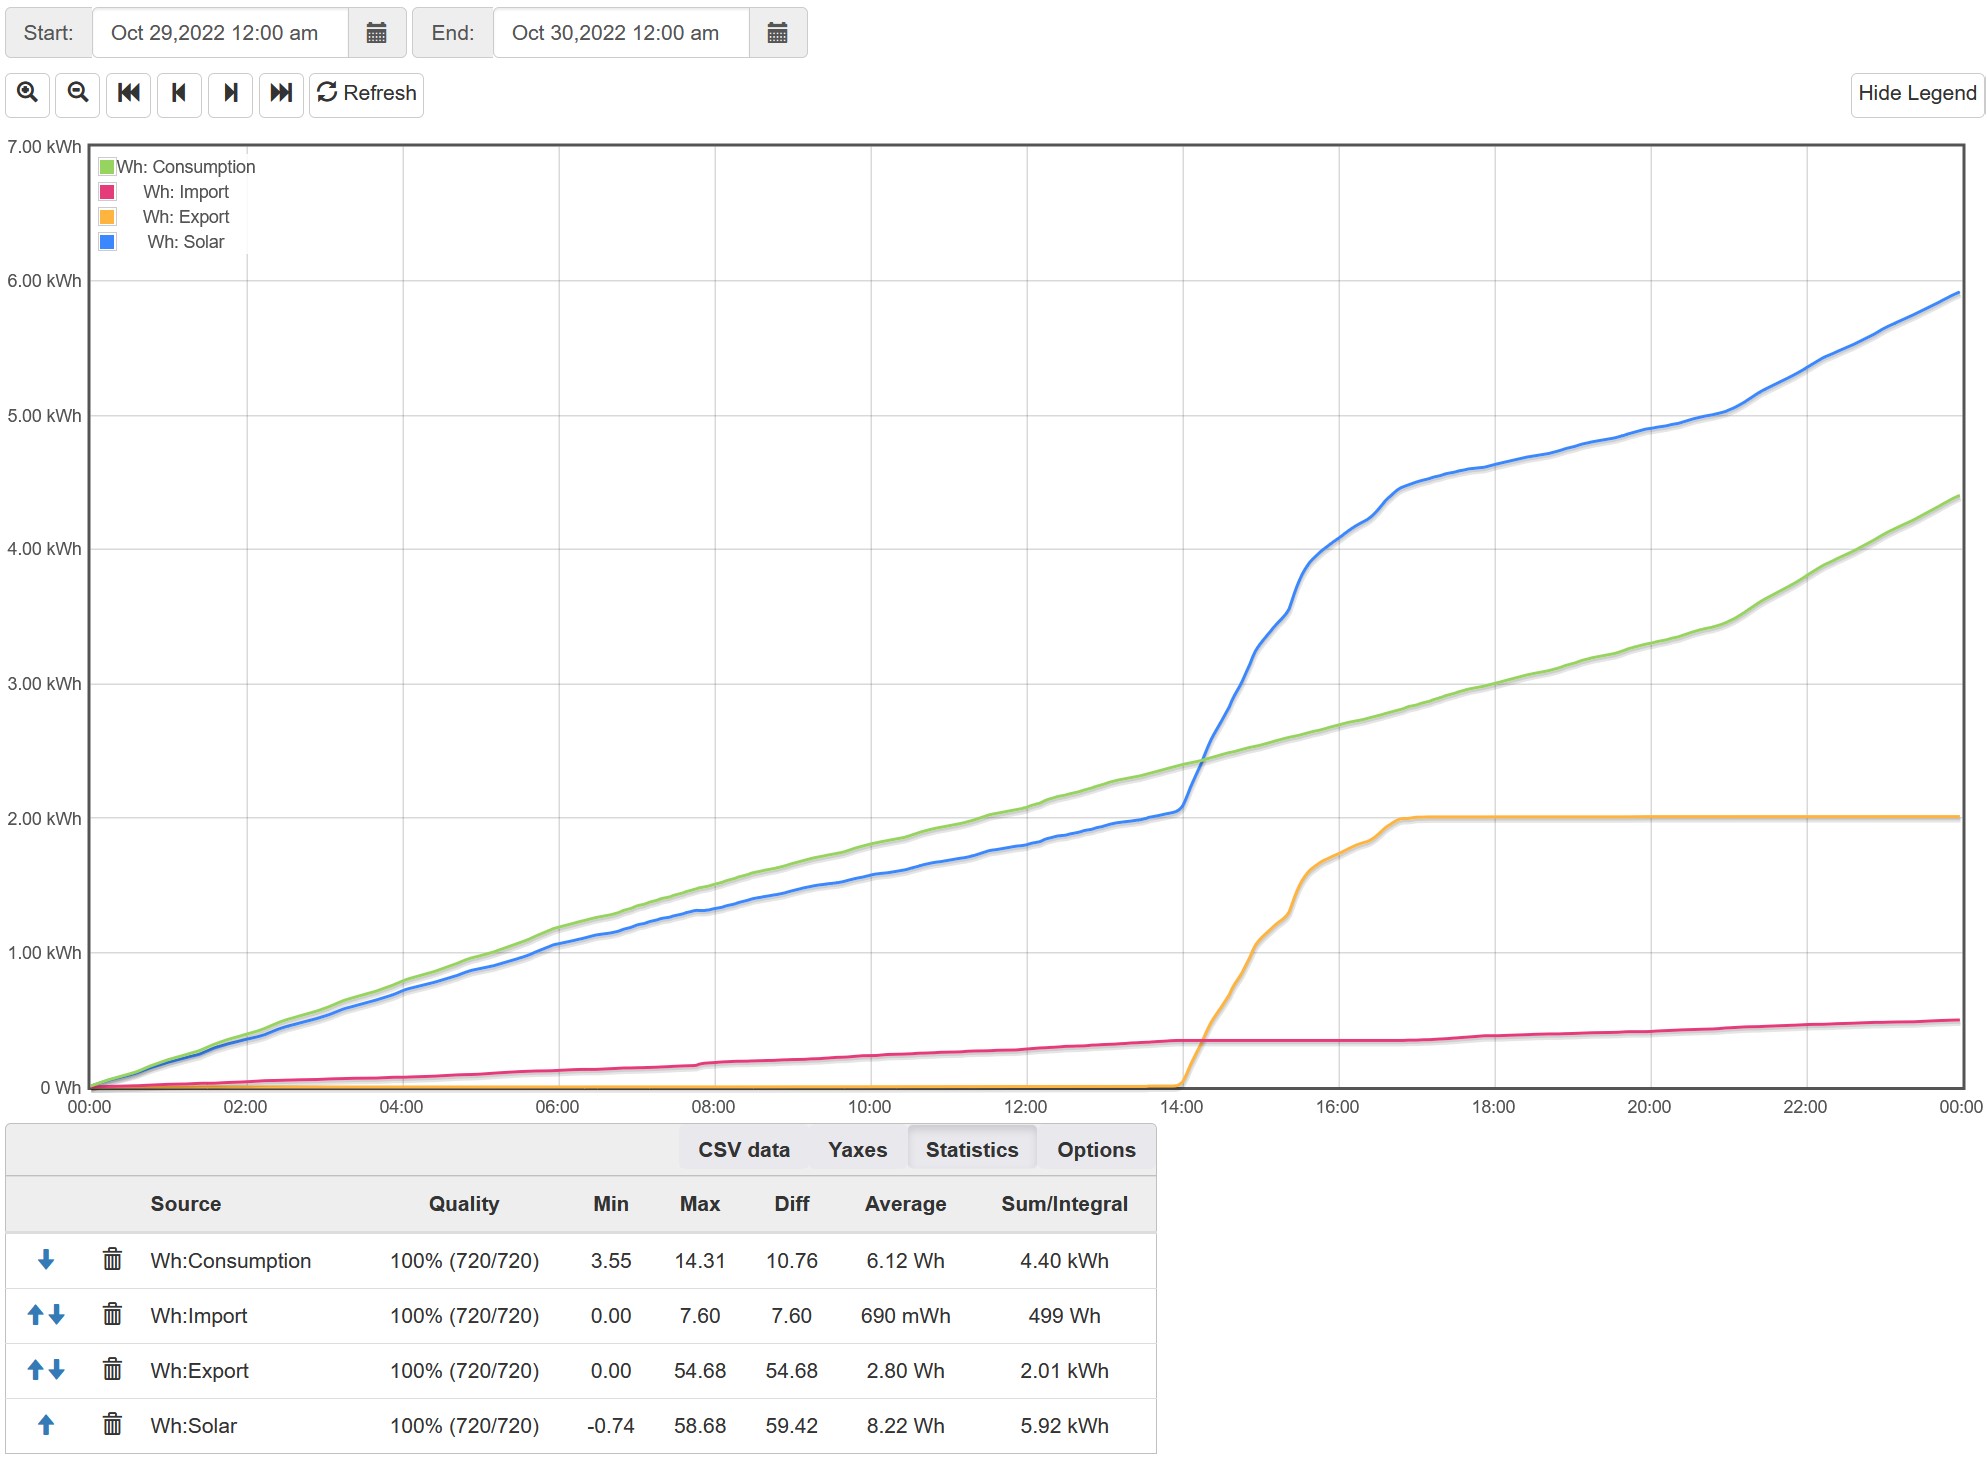
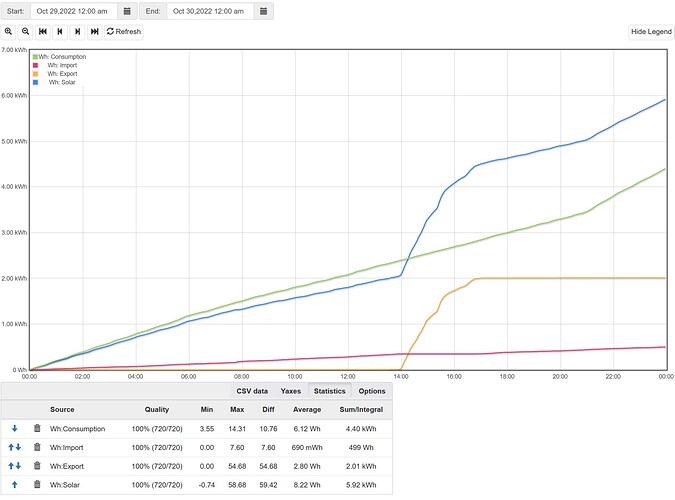
Here’s the Graph+ output with the solar included.
Growatt display for the same period…
I don’t seem to be able to dig pout historical meter readings from my smart meter or from my suppliers (Octopus) web portal.
What I can get is a half hourly report of energy…
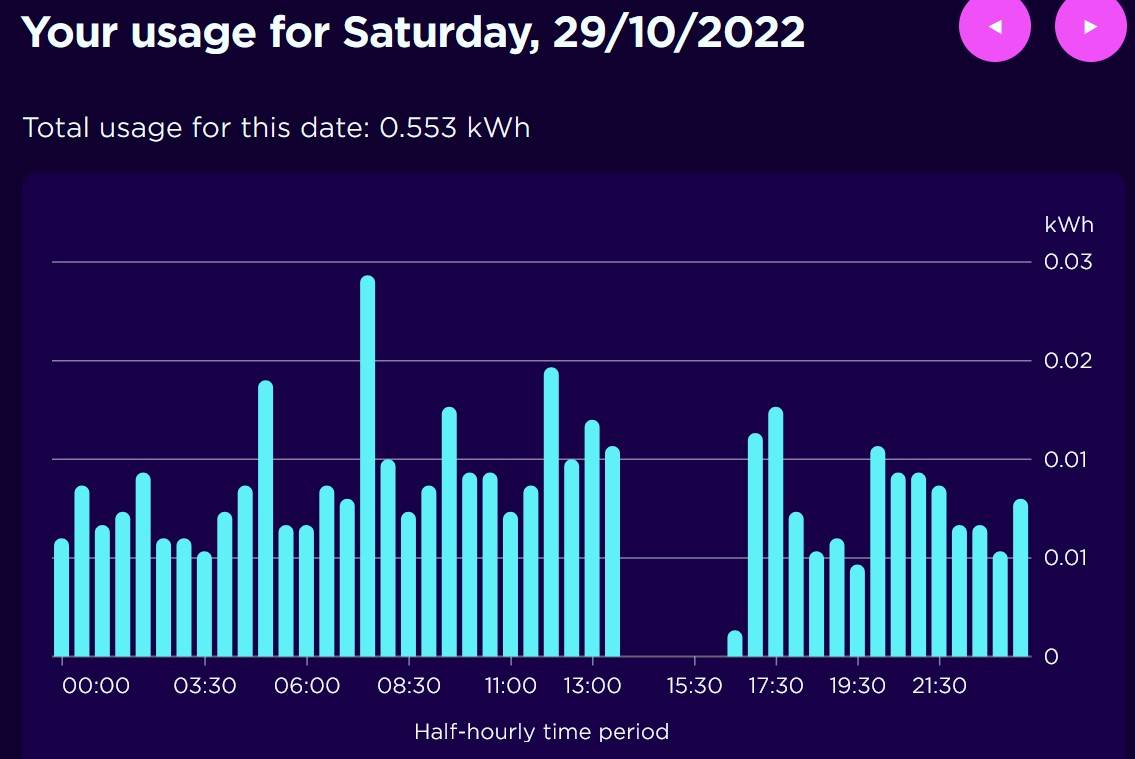
I have that as a spread sheet as well if needed.
Seems like IoTaWatt agrees with the meter regarding import and agrees with Growatt regarding export. The primary disagreement appears to be with Generation (inverter output) and consumption.
Inverter output IoTaWatt 5.92 kWh, Growatt 8.2 kWh = Growatt +2.3 kWh
Consumption IoTaWatt 4.4 kWh, Growatt 6.4 kWh = Growatt +2.0 kWh.
Difference 0.3 kWh
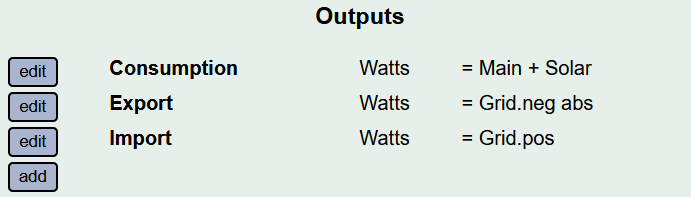
IoTaWatt calculates consumption as Main + Solar. IoTaWatt has a net Main export of 1.5 kWh. Growatt has a net main export of 1.8 kWh.
Difference 0.3 kWh
The IoTaWatt import matches the meter and I believe accounts for the 0.3 difference in net export. That leaves the difference between IoTaWatt and Growatt of 2.3 kWh for inverter output.
Looking at the possibilities:
Since IoTaWatt is lower than Growatt (5.9 vs 8.2), it could be something as simple as the CT is not fully closed or has some impurity between the mating surfaces. Worth checking that or, if you have another CT, putting a second one on the inverter output and seeing if it agrees with the first.
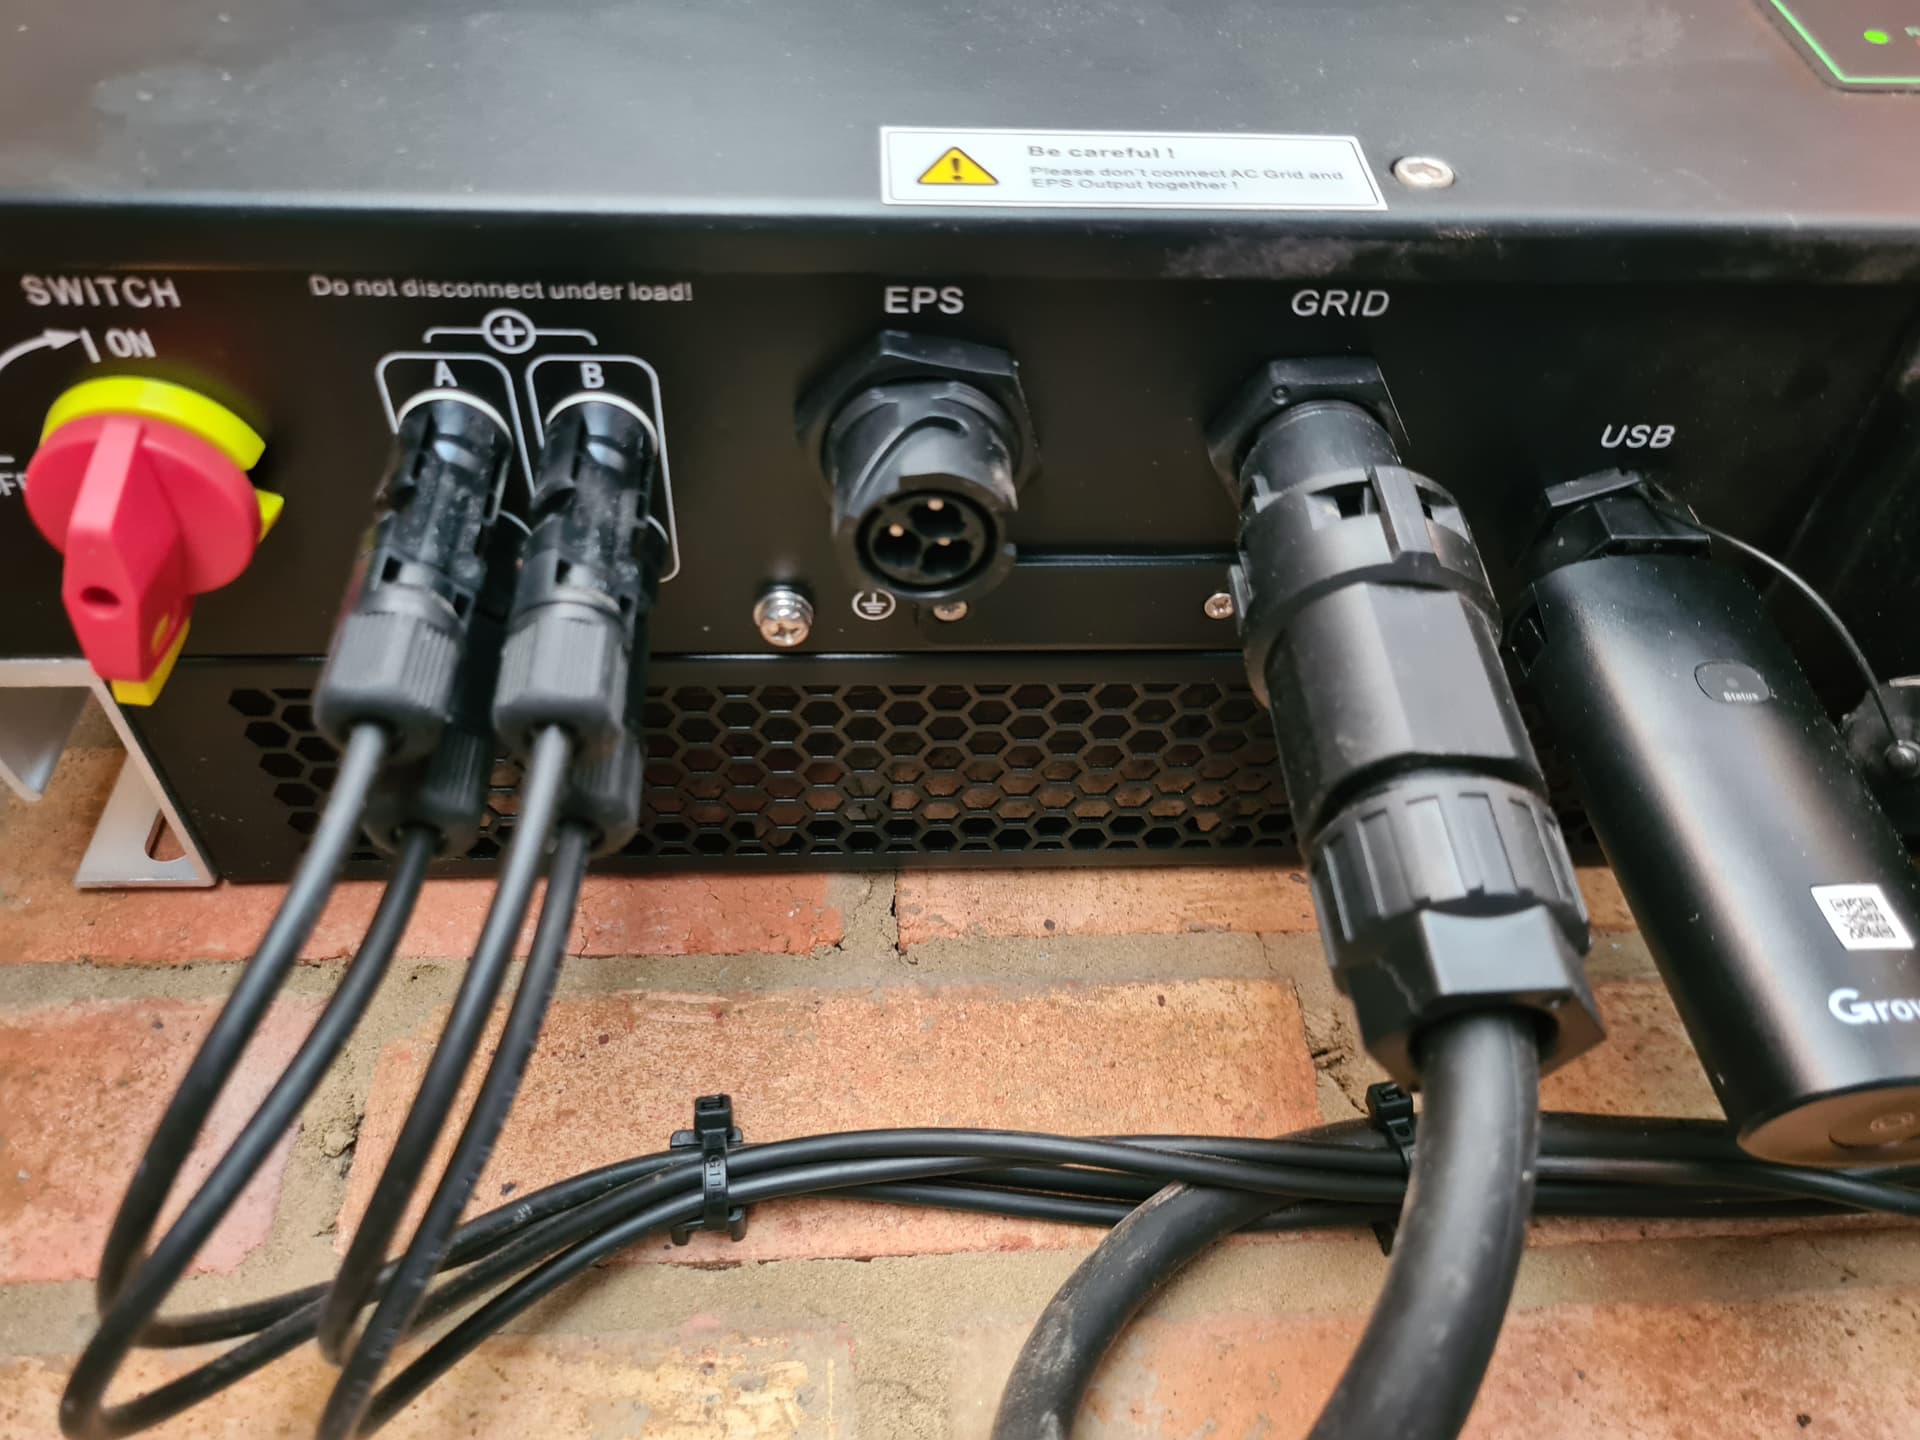
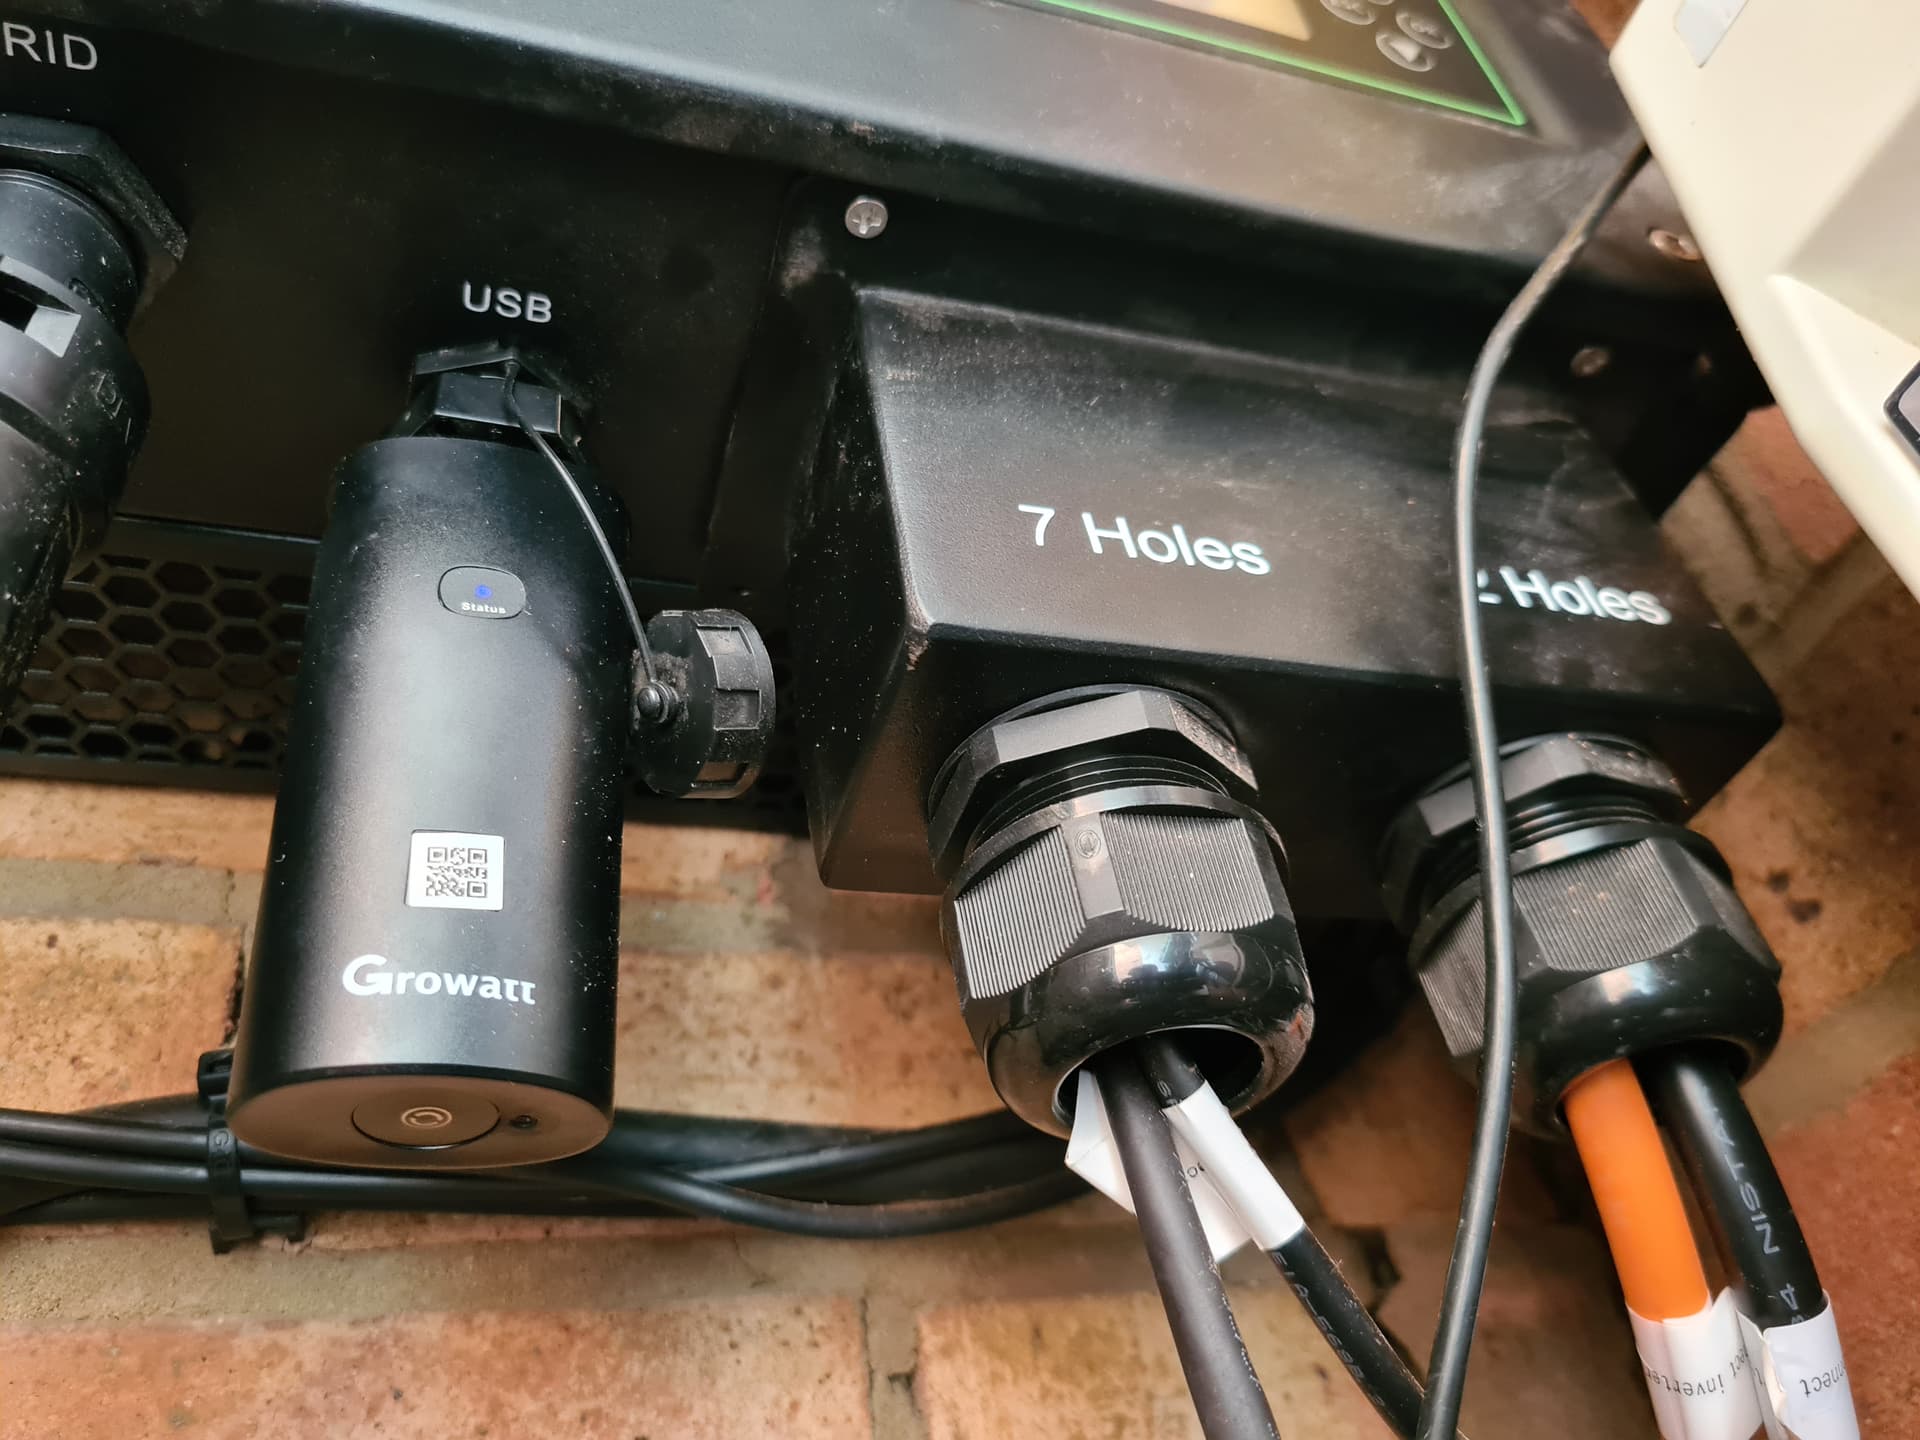
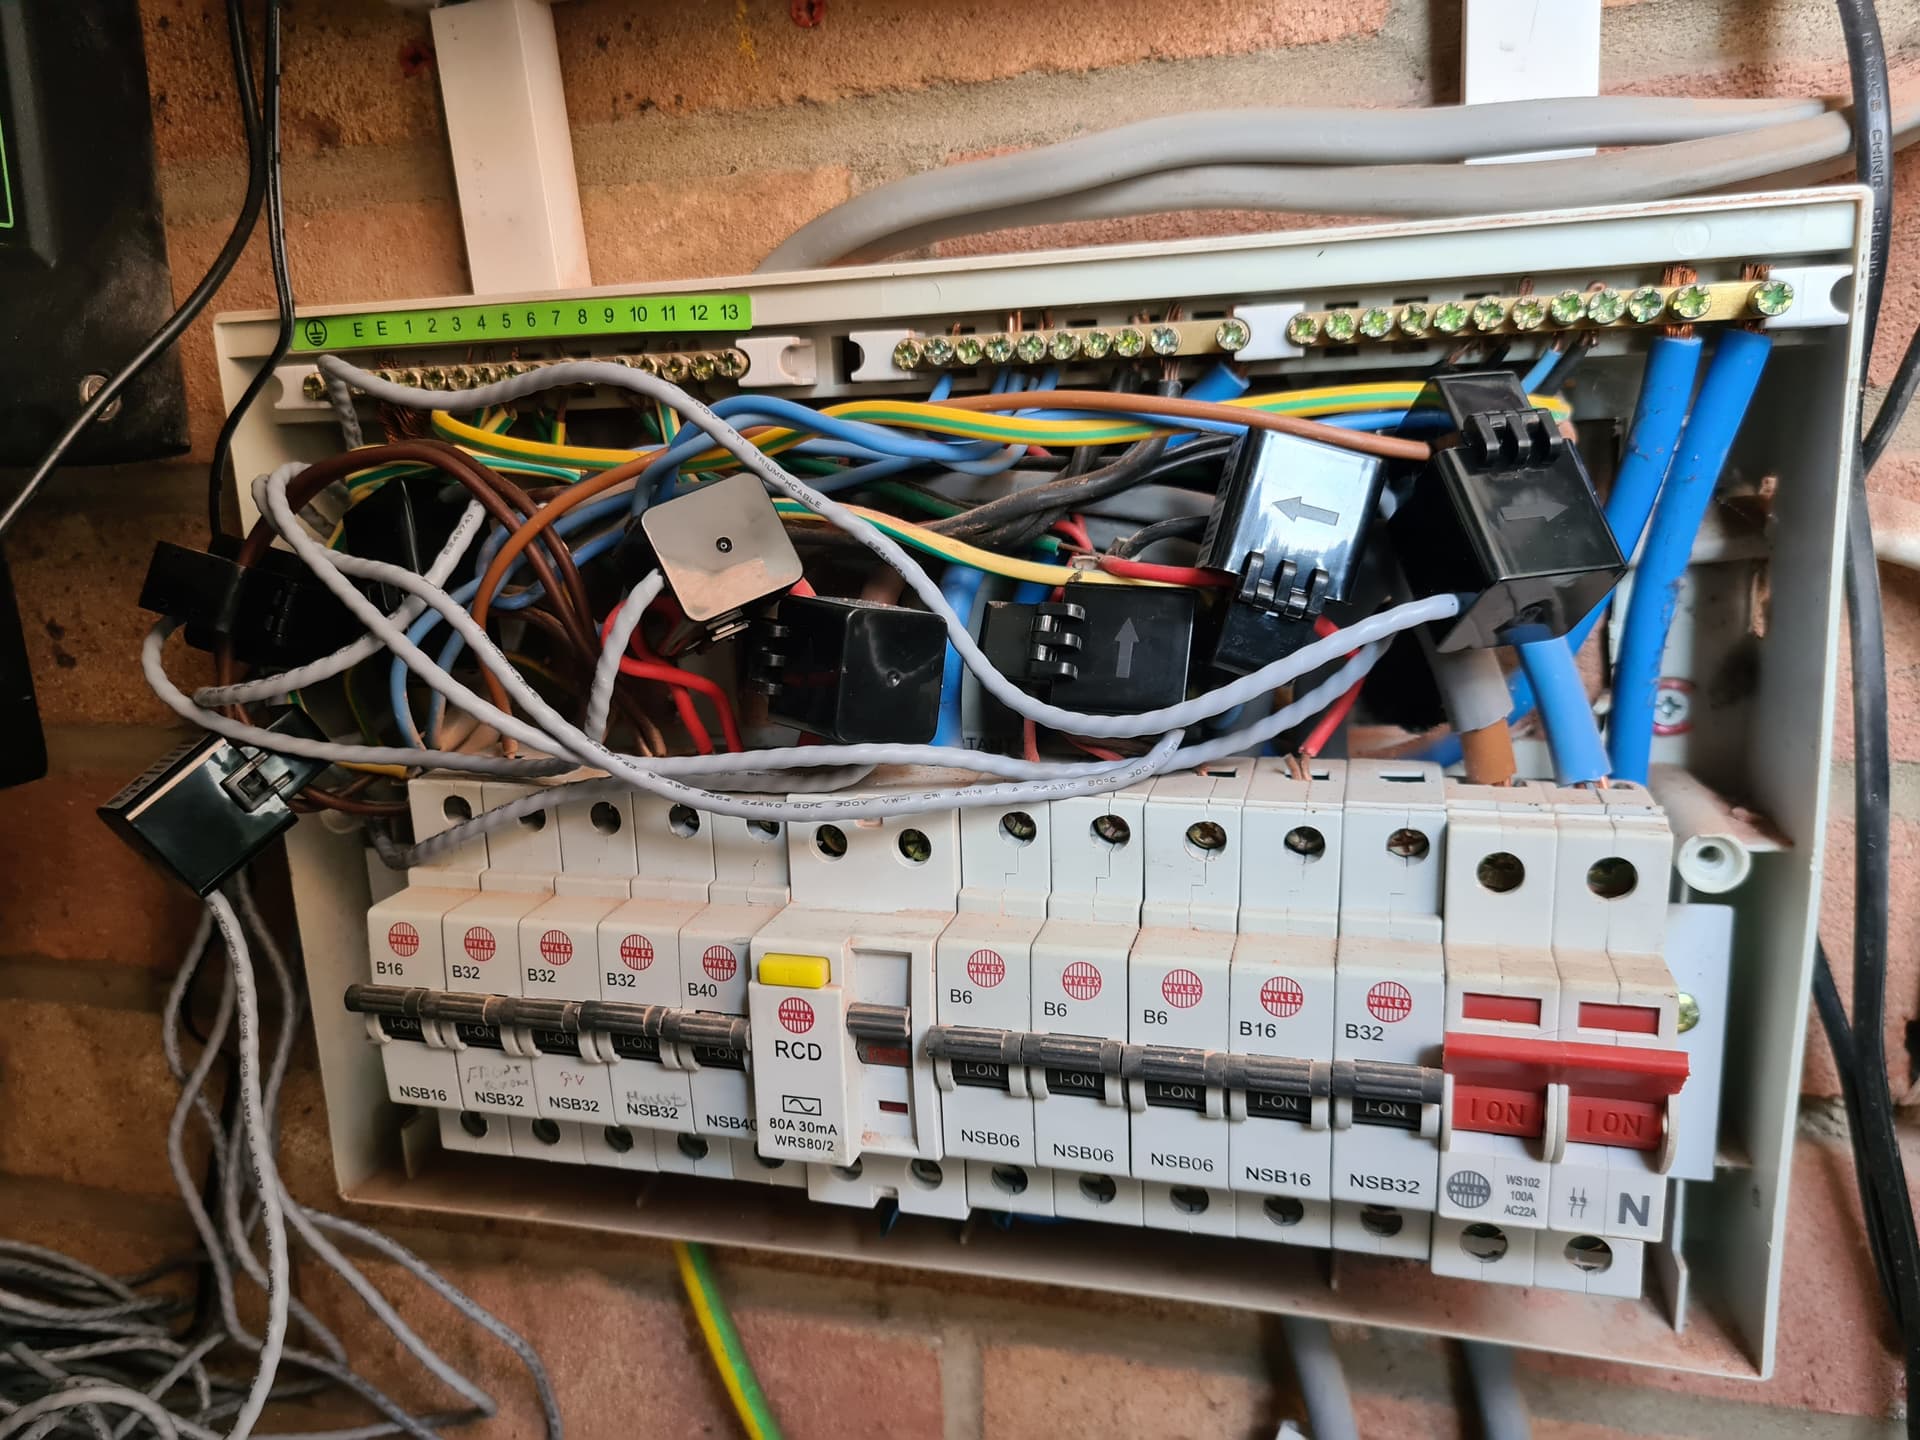
As previously mentioned, the inverter has two outputs. You state that the second one isn’t being used, but if it were, that 2.3 kWh could easily be delivered to load via that output, circumventing the IoTaWatt CT on the other output. How about a picture of the panel and inverter output wires.
Can you add an output that adds the individual loads as “loads” to the plot so we can validate consumption?
I have disconnected and cleaned the original as best I could (it’s quite cramped in my panel)
I have also added a second CT to it A quick 10 min Graph+ of the two as below…
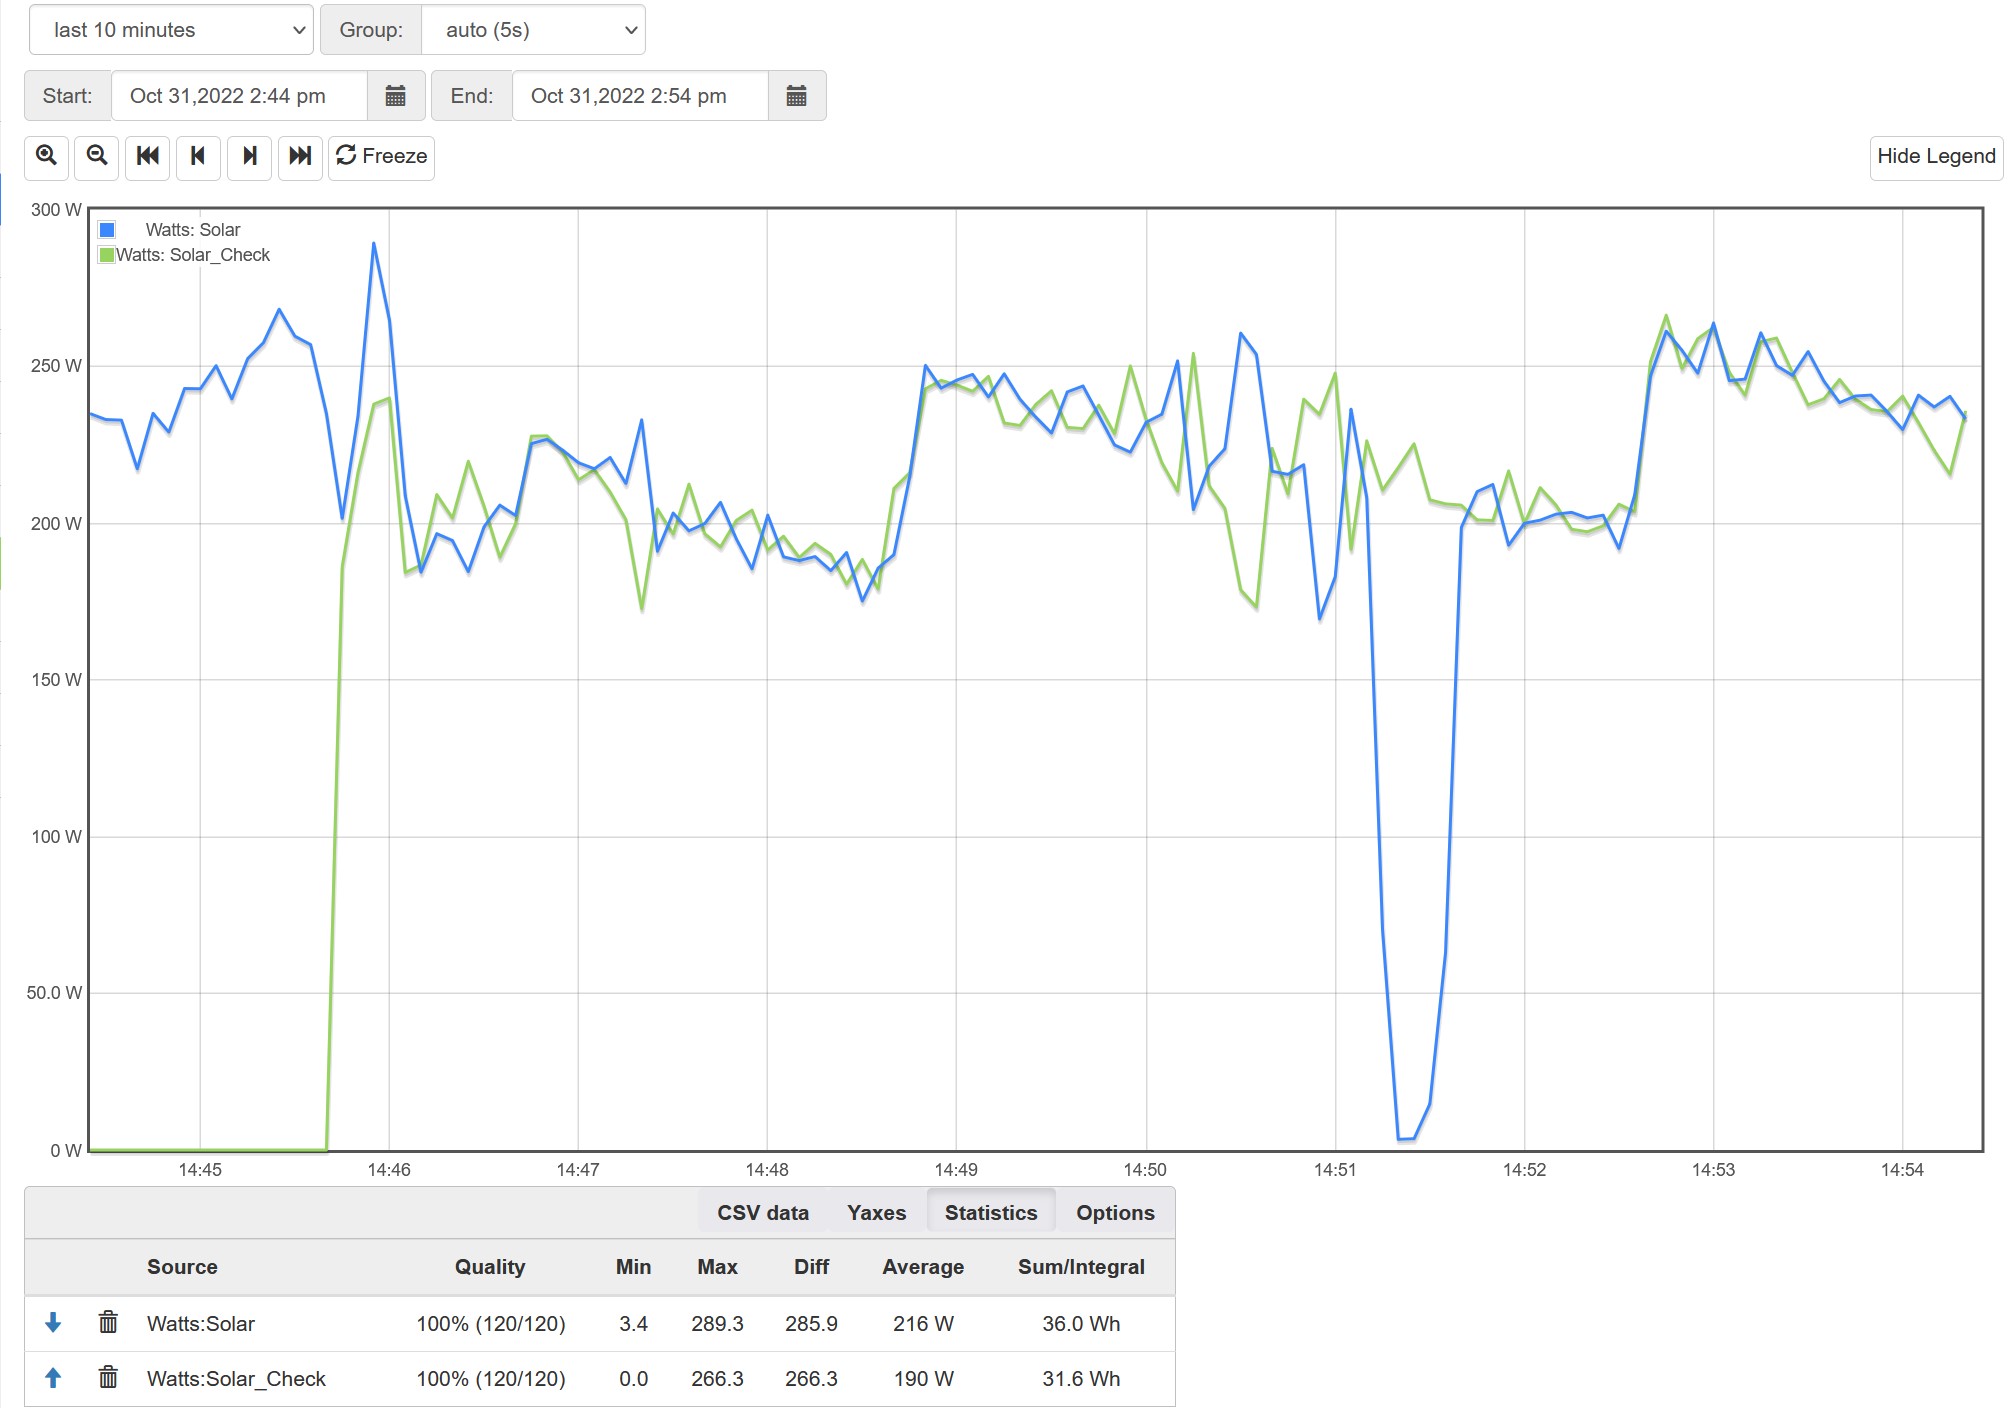
Done and a 10 min Graph+ output here for comparison…
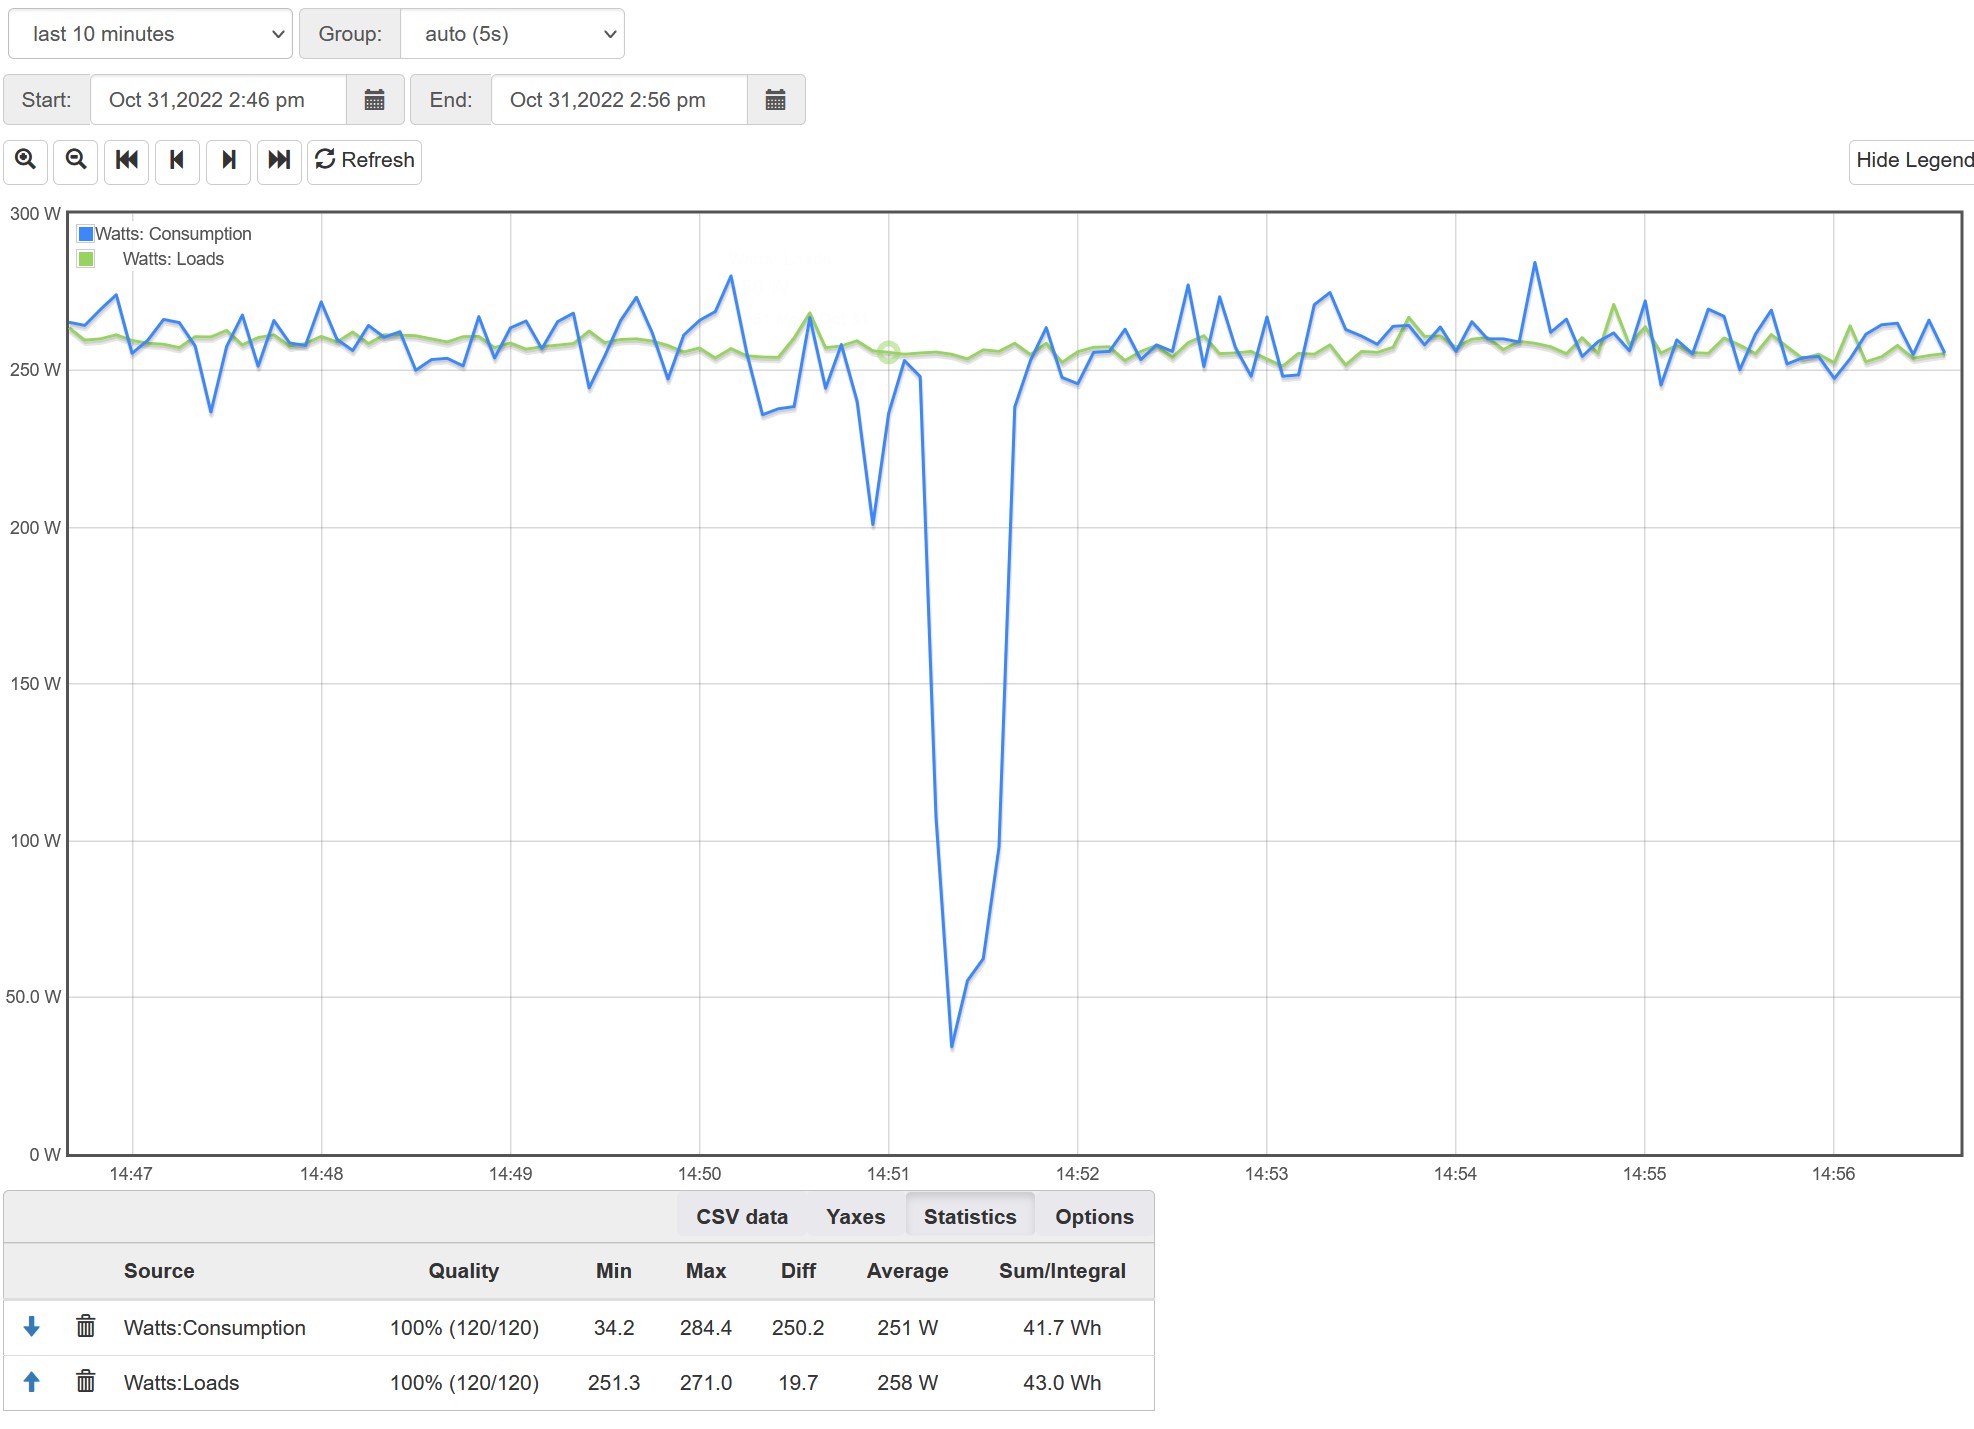
OK, that shows the CT is probably OK.
The consumption as computed from Mains + Solar agrees with the sum of the load CTs, so that seems fine.
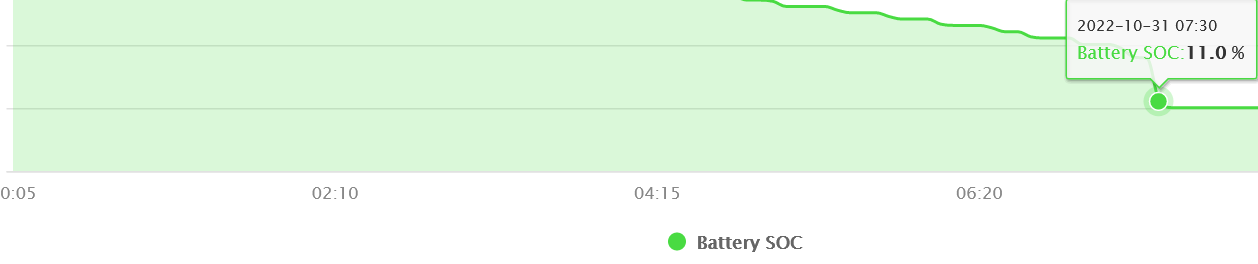
So, the Growatt “Self Consumption” does not agree with what is being used by the sum of your loads. I will look at the documentation again when I have some time. Is it possible that the inverter is counting energy used to charge the battery as part of self-consumption? From your graph below it looks as if the system is running on battery until around 7:45 when it may start charging the battery until about 14:00, at which point the inverter starts to export until about 17:00 when solar would presumably drop low enough that the system begins to use battery to maintain the loads. The load remains fairly constant throughout the day until about 21:00 when it increases, yet the import does not increase indicating it is using the battery again.
The inverter seems to keep the import slightly positive at 20 Watts or so except when excess power causes export. That’s pretty negligible as neutral power. The inverter may be reading that as zero and might account for the minor discrepancy in import.
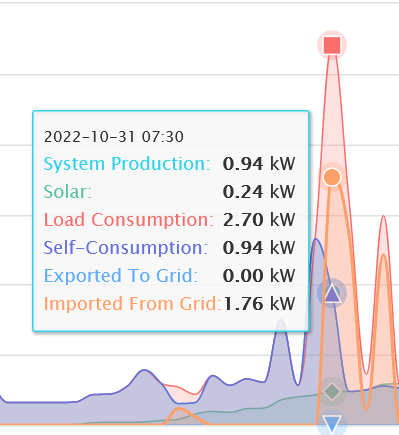
Looking at a snaphot of a time when Load Consumption > Solar,
Thinking logicaly (to my mind at least;)
Load consumption should = Sytem Production + Imported from grid
In this instance 2.7 = 0.94 + 1.76 is true.
Interestingly, at this point in time the solar panels are just waking up but not enough to satisfy demand on their own. The battery is at 10% charge at this time and seems to stop discharging.
However:
Solar alone is only 0.24 with Sytem production at 0.94 wich is the same as Self-Consumption
Surely then
Load Consumption - Imported from Grid is 2.7 - 1.76 = 0.94 which = Both System Production and Self-Consumption.
The 0.94 coming from Self-Consumption or System Production must be made up from:
Solar + Battery?
So Self-Consumption - Solar = “Consumption from battery”
0.94 - 0.24 = 0.70
Although the battery charge seems to stay at 10% for around 45 mins until it starts charging again.
I have noticed on several occasions at this time. When the PV’s are waking up that, even if there is still plenty of charge in the battery (30 or 40%) there is a short spike in the Imported From Grid power.
I’m not sure how relevant or helpful this info is but it’s my musings over the figures in trying to understand what is happening.
Just to add, I have now done a 24hour comparison of consumption vs loads and the two solar feeds. Both were perfectly alligned so have reverted to normal config.
OK, I am happy that IotaWatt is accurately recording data. I still need to reconcile it’s data with that from my Growatt but I’d believe IotaWatt over Growatt anyway. Plus it’s the smart meter that I will get billed/paid from so that’s the one I need to align with.
I now want to set up my data uploader.
To make sure I get is right 1st time I just want to check a few things.
If I want to get power (W) and energy (Wh) in my influxdb can I just set 2 measuremets from the same outputs. as in the measurements below…
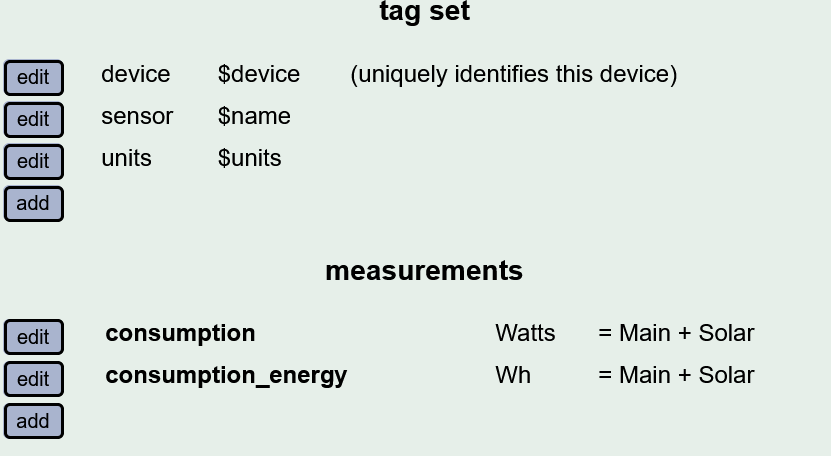
Will these give me one reading in Watts and one in Wh(per post interval)
and so on for Import, Export, Solar etc.?
Just want to check my understanding.
Yes, IoTaWatt records Wh and VAh for each input. From that, using the cumulative hours recorded and the reference voltage, it can calculate all of the available metrics.
1 Like
Great, thanks @overeasy .
Your help has been greatly appreciated.