Happily running with my IoTaWatt, but noted that the CMS needs to accumulate power data from IoTaWatt on 10 second intervals and calculate energy. IoTaWatt is already doing this, but the inputs available from IoTaWatt in CMS don’t expose the energy data, just the power data.
It would seem more efficient and much more accurate to input the energy directly from IoTaWatt.
There are other measurements I would like to see in CMS, like power factor.
Am I just missing something in the input configuration?
I decided to answer this in the Emoncms forum because it straddles the technologies, but as a new IoTaWatt use, I encourage you to continue your questions and dialogue here in the IoTaWatt forum.
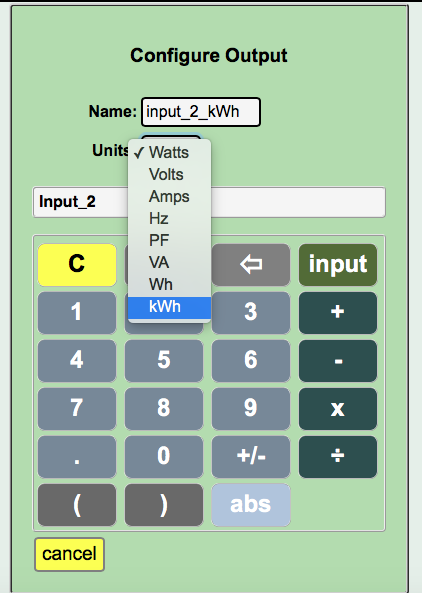
wh and kWh are only available when calculating output values to send to EmonCMS or influxDB. That’s because in those cases data is being sent for specific intervals of time, and energy is an integration over time.
When defining a regular output for the status display, there is no time interval to calculate Wh. Any attempt to produce Wh would require imposing an arbitrary interval. For example it could be:
Wh in last 60 minutes
Wh in current hour
Wh since device last started
Wh since device installed
None of which are particularly meaningful. If you want to use the defined outputs in the local graph utility, the graph provides the time reference, so if you select a Watts output under the Energy tab, you can get the kWh there with respect to the time interval defined in that graph.
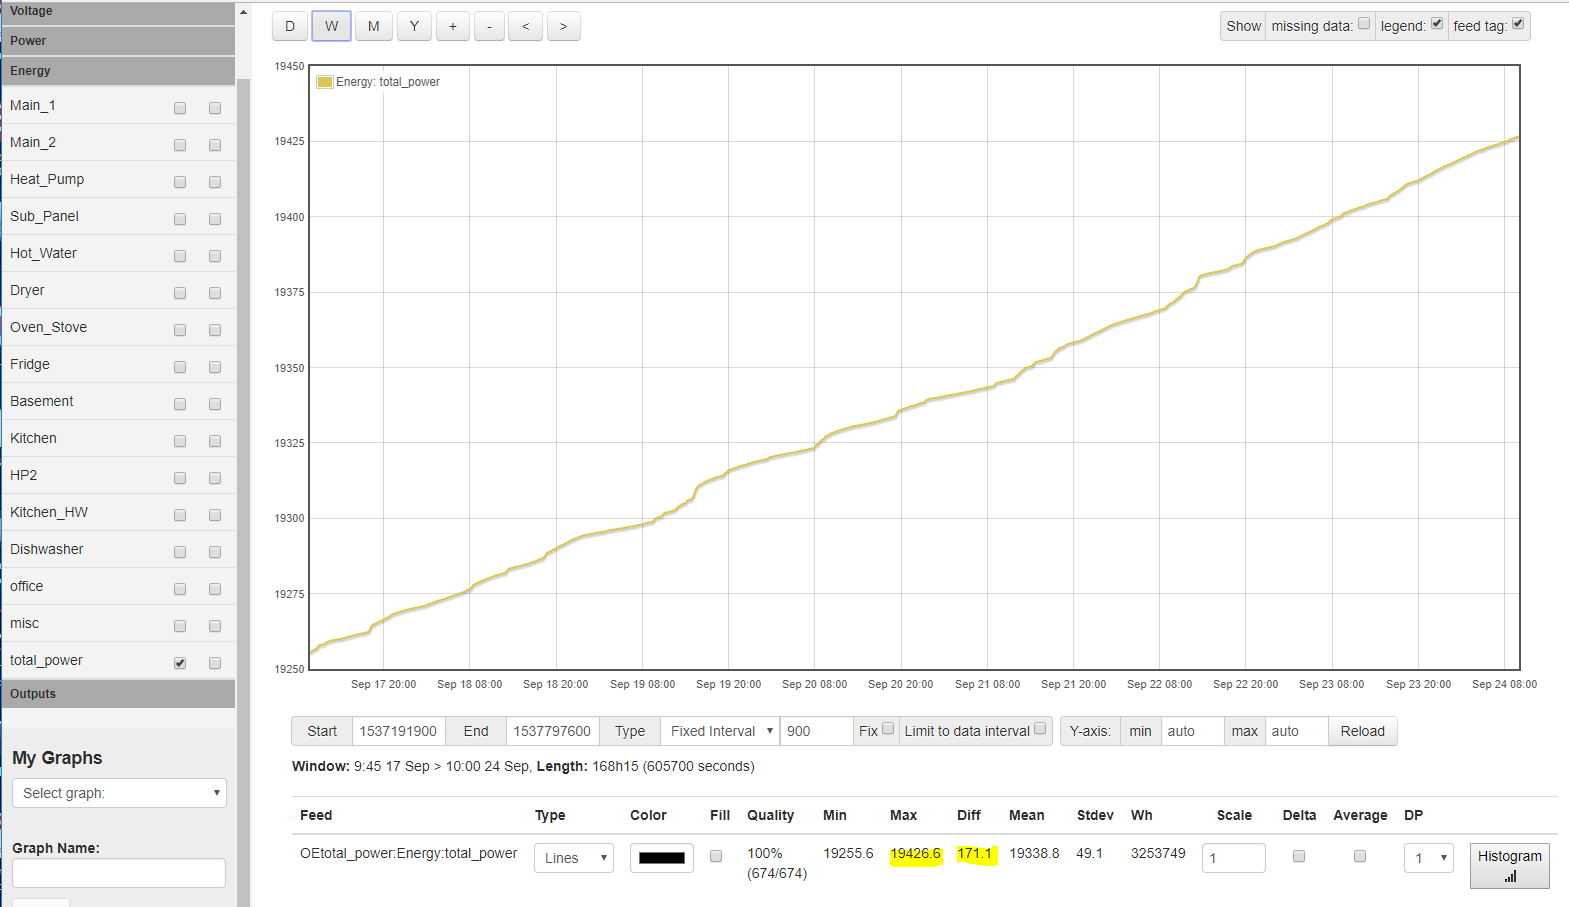
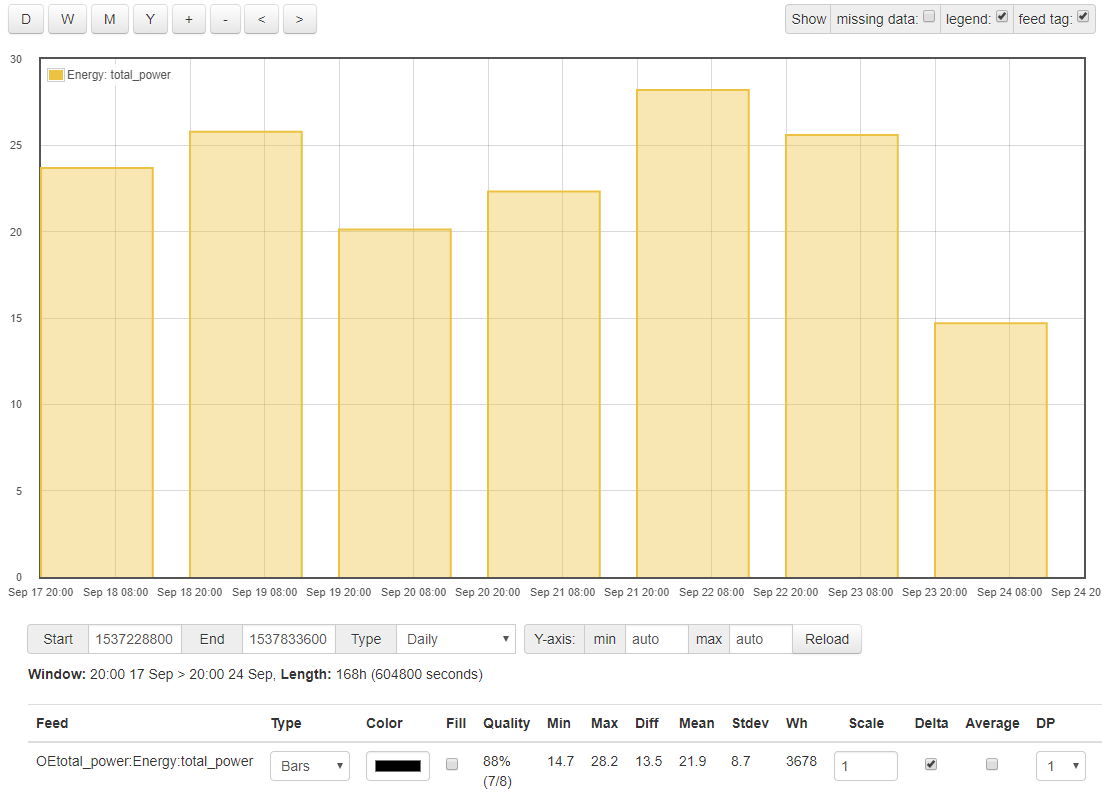
When you plot these, you are plotting total kWh for that input since installation, during the period selected in the graph. Here’s my total kWh for the past week:
This isn’t really very useful yet, but it does have some good information that I’ve highlighted at the bottom:
The Max figure is your up-to-date running kWh total.
The Diff figure is the total kWh used during the week.
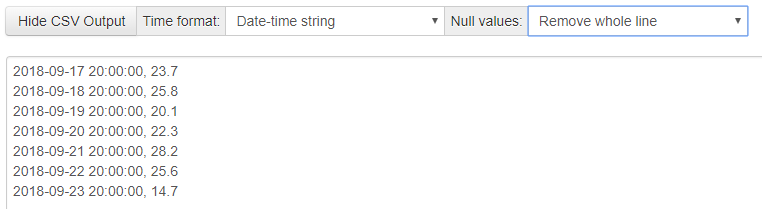
Now if you are interested in something like daily kWh usage, you can use the graph functions to produce that from what you have. Using the various options at the bottom:
Select period Type “Daily” in the top line.
In each detail line, select Type “Bars” and check the “Delta” box. This tells graph to plot the difference in kWh in each day instead of the cumulative total at the end of the day.
There is a caveat here. Days begin and end at 24:00 UTC (GMT) rather than your local time. That’s something that needs to be addressed in a future release.
From influxdb you can get energy with cumulative_sum and group by time what you are feeding to influx. Example influx feed with 5s update, grafana line would be:
SELECT cumulative_sum(mean(“value”)) AS “Wh” FROM “xxxWh” WHERE $timeFilter GROUP BY time(5s) fill(linear)
Unfortunately this will take a lot of cpu when having long timerange (array gets really big). Fortunately there is better way:
SELECT cumulative_sum(sum(“value”)) AS “Wh” FROM “xxxWh” WHERE timeFilter GROUP BY time(__interval) fill(linear)
This lets influxdb sum values in interval and then cumulatively add those interval-values to get energy graph for timerange.
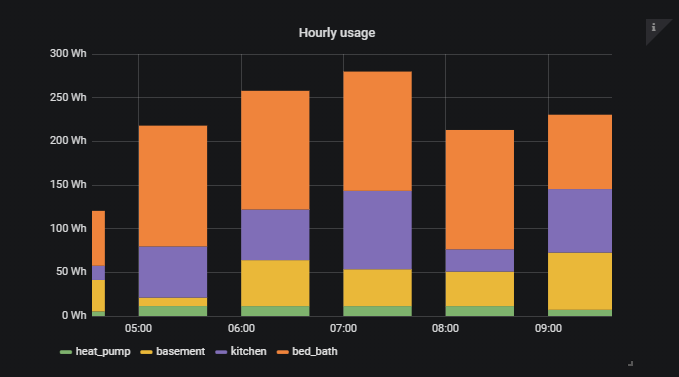
Does that work better than: SELECT integral("value")/3600 FROM "heat_pump" WHERE $timeFilter GROUP BY time($_interval) fill(null)
“heat_pump” measurements in watts so there is no need to save Wh in influx.
Does that work better than: SELECT integral("value")/3600 FROM "heat_pump" WHERE $timeFilter GROUP BY time($_interval) fill(null)
Well, that query returns: error:"unsupported call: integral"
So, sum works much better Upgrading influxdb probably would help, but currently I get it from repository… Anyway, using sum is simpler and probably gets more accurate result. Downside is using a bit more storage space.
For longterm kWh energy calculations, making hourly aggregate (group by) with continous query would make getting those values really fast.
Hi @Jam , I’m trying to get kWh reporting with IotaWatt > Grafana/influxdb1.8.
Is your query quoted above assuming the “value” is in watts or watthours taken from IotaWatt?
Or is it calculating wH from each watt measurement/sample time?
I’m feeding just the power(W) data into influxdb and trying to do the calculation to get kWh in grafana.
My thinking is I need in english to:
Select the cumulative sum of each power “value” in watts divided by 360 (10s updates). This I believe will give me a running kWh total?
My query so far is: SELECT cumulative_sum(sum("value"))/360 AS "kWh" FROM "consumption" WHERE $timeFilter GROUP BY time(10s) fill(linear)
This runs but the math is out.
If I understand correctly I am trying to divide each sample “value” by 360 before adding it to the running total.
Is where I have placed it doing that?
Do I need to move it elsewhere in the query?
Or am I barking up completely the wrong tree?
Any advice appreciated.
I hope this makes sense but I am new to this