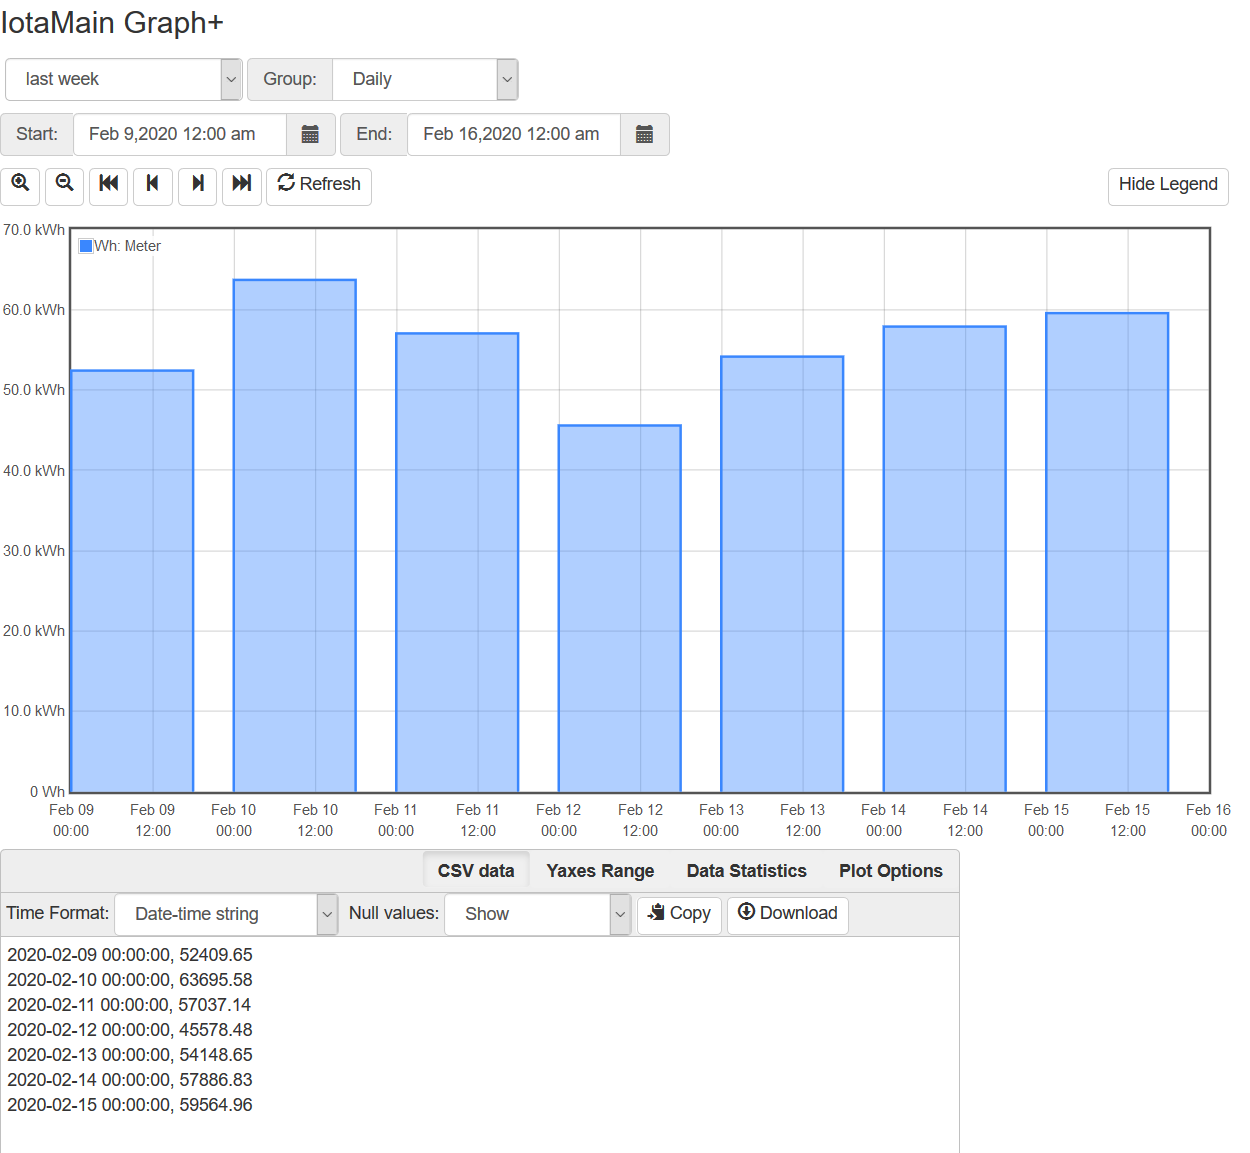
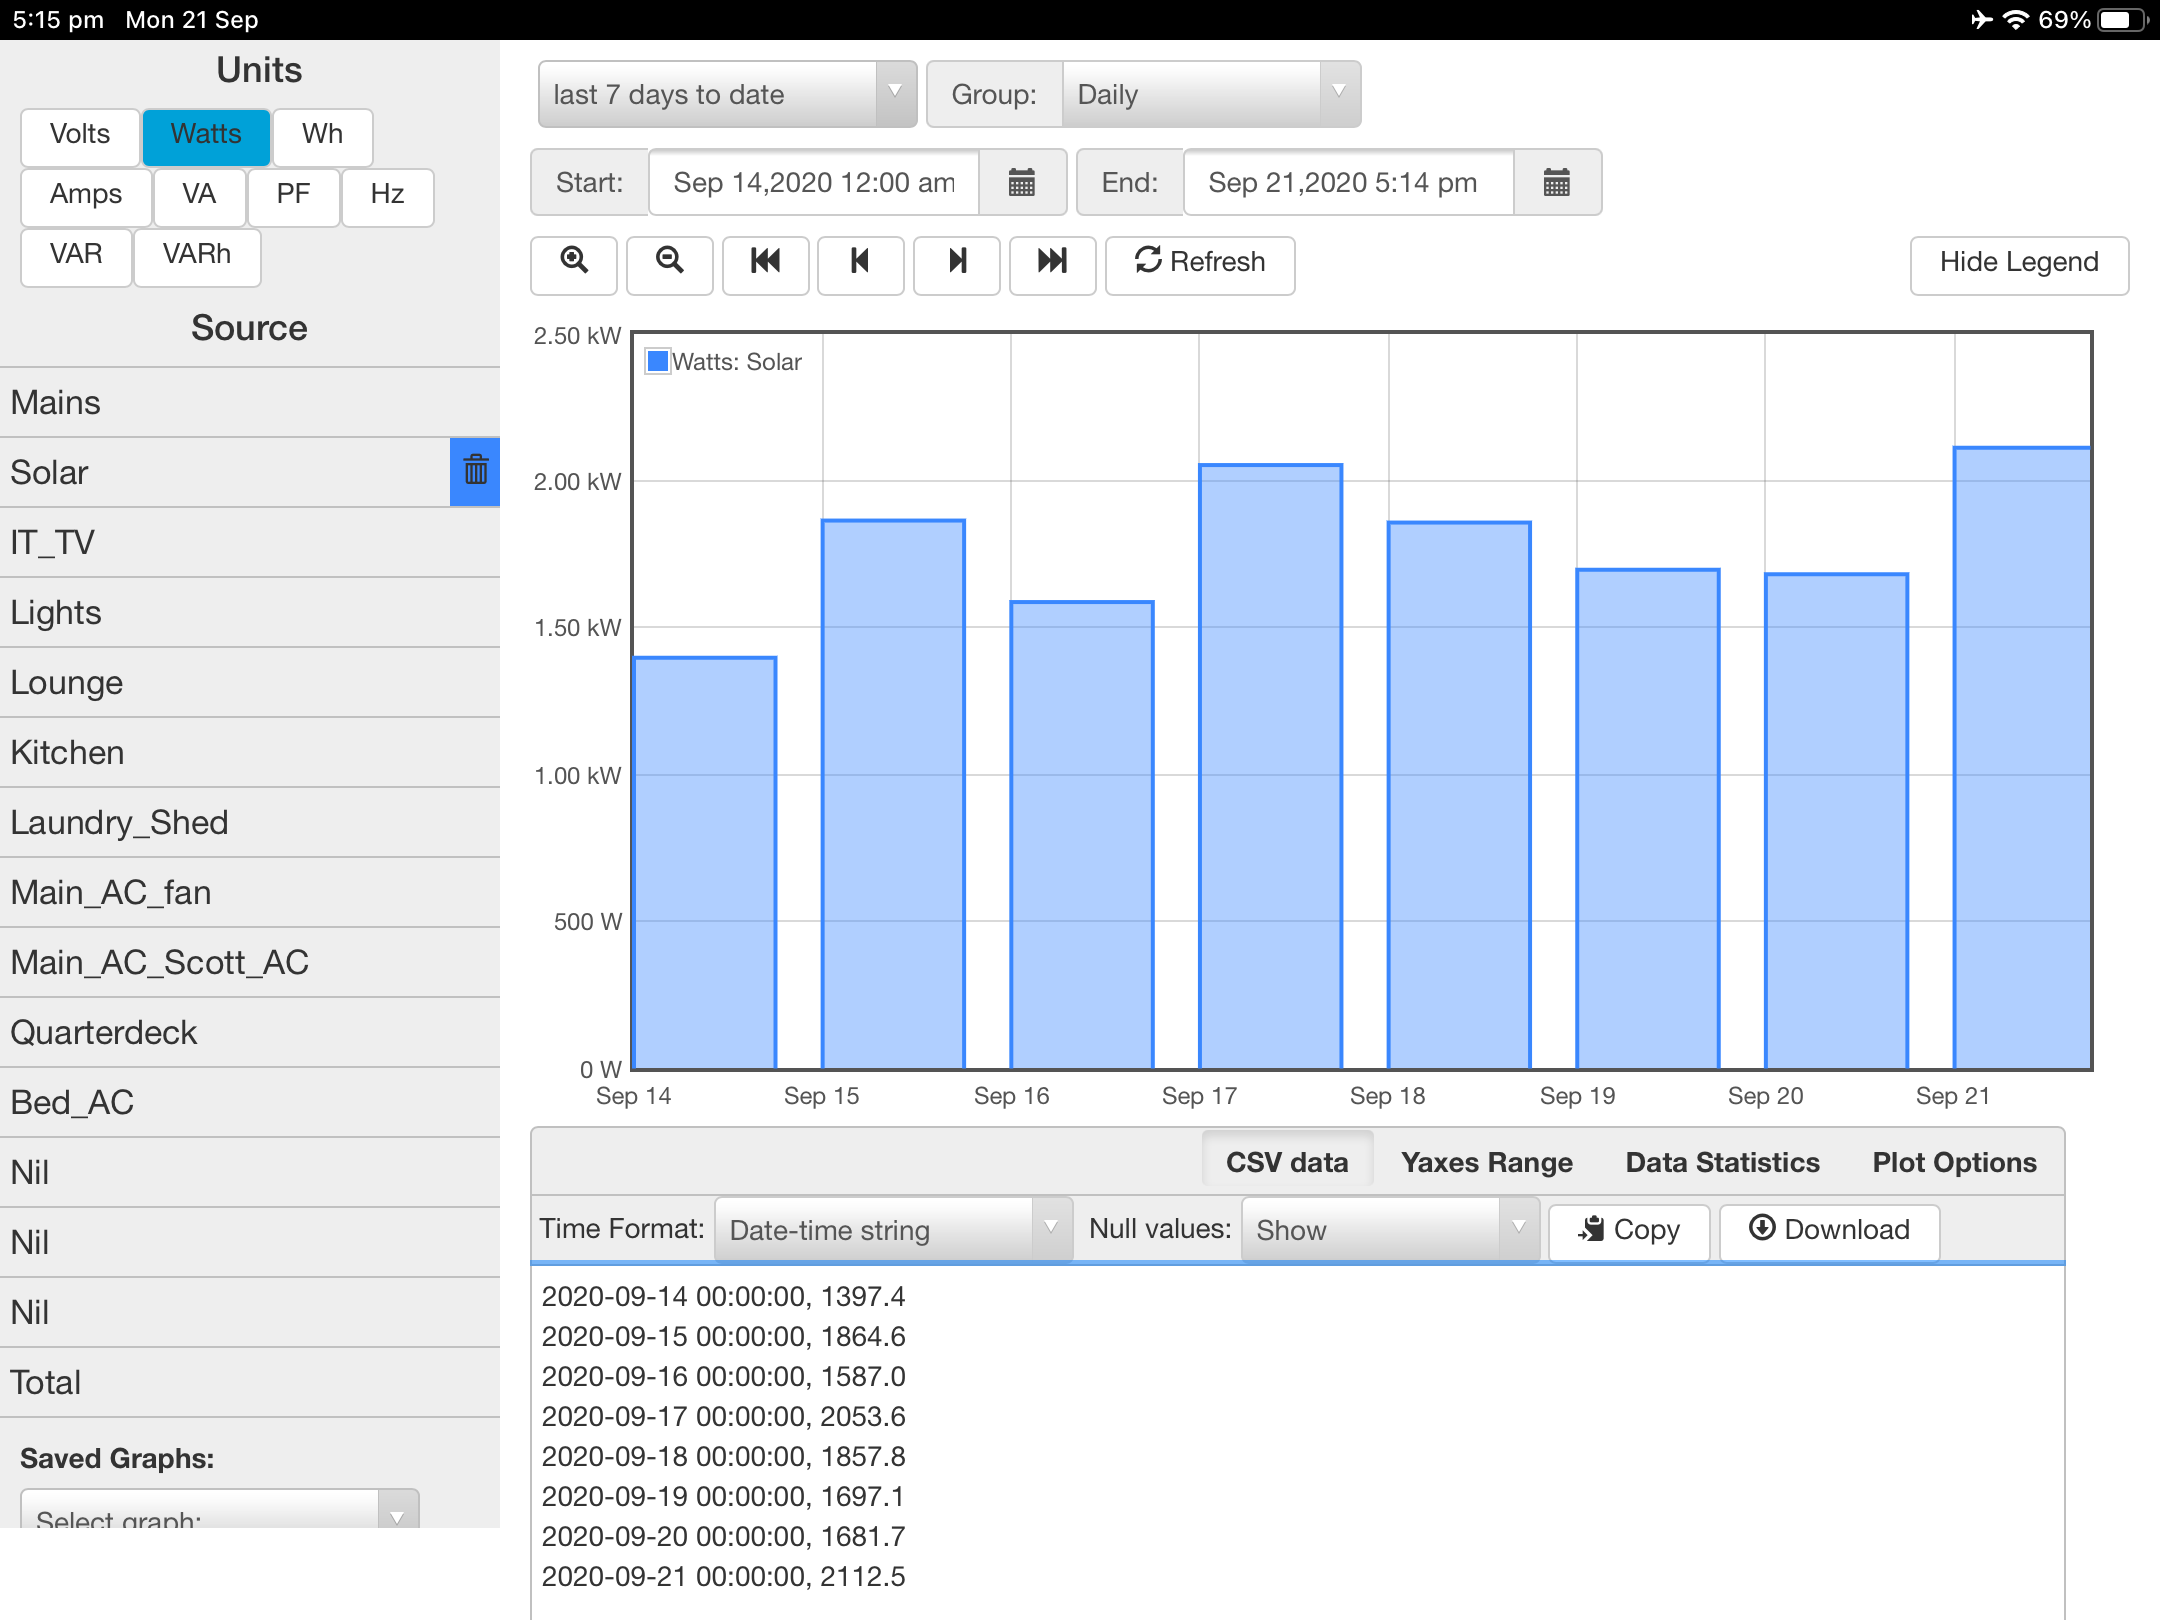
I learnt how to see the daily kWh consumption in the inbuilt graph by referring this article.
I’d love to push it to the Emoncms and I know I can push it in the kWh expression but my question is what is the interval of kWh? Is it for every hour or every 12 hours? How do we export the total kWh recorded for a previous day(resets at the end of day)?
My intention is to display the total kWh consumption of the previous day on Emoncms.
It’s for whatever interval you request it. In the case of export to Emoncms, it would be the upload interval that you set.
You can’t.
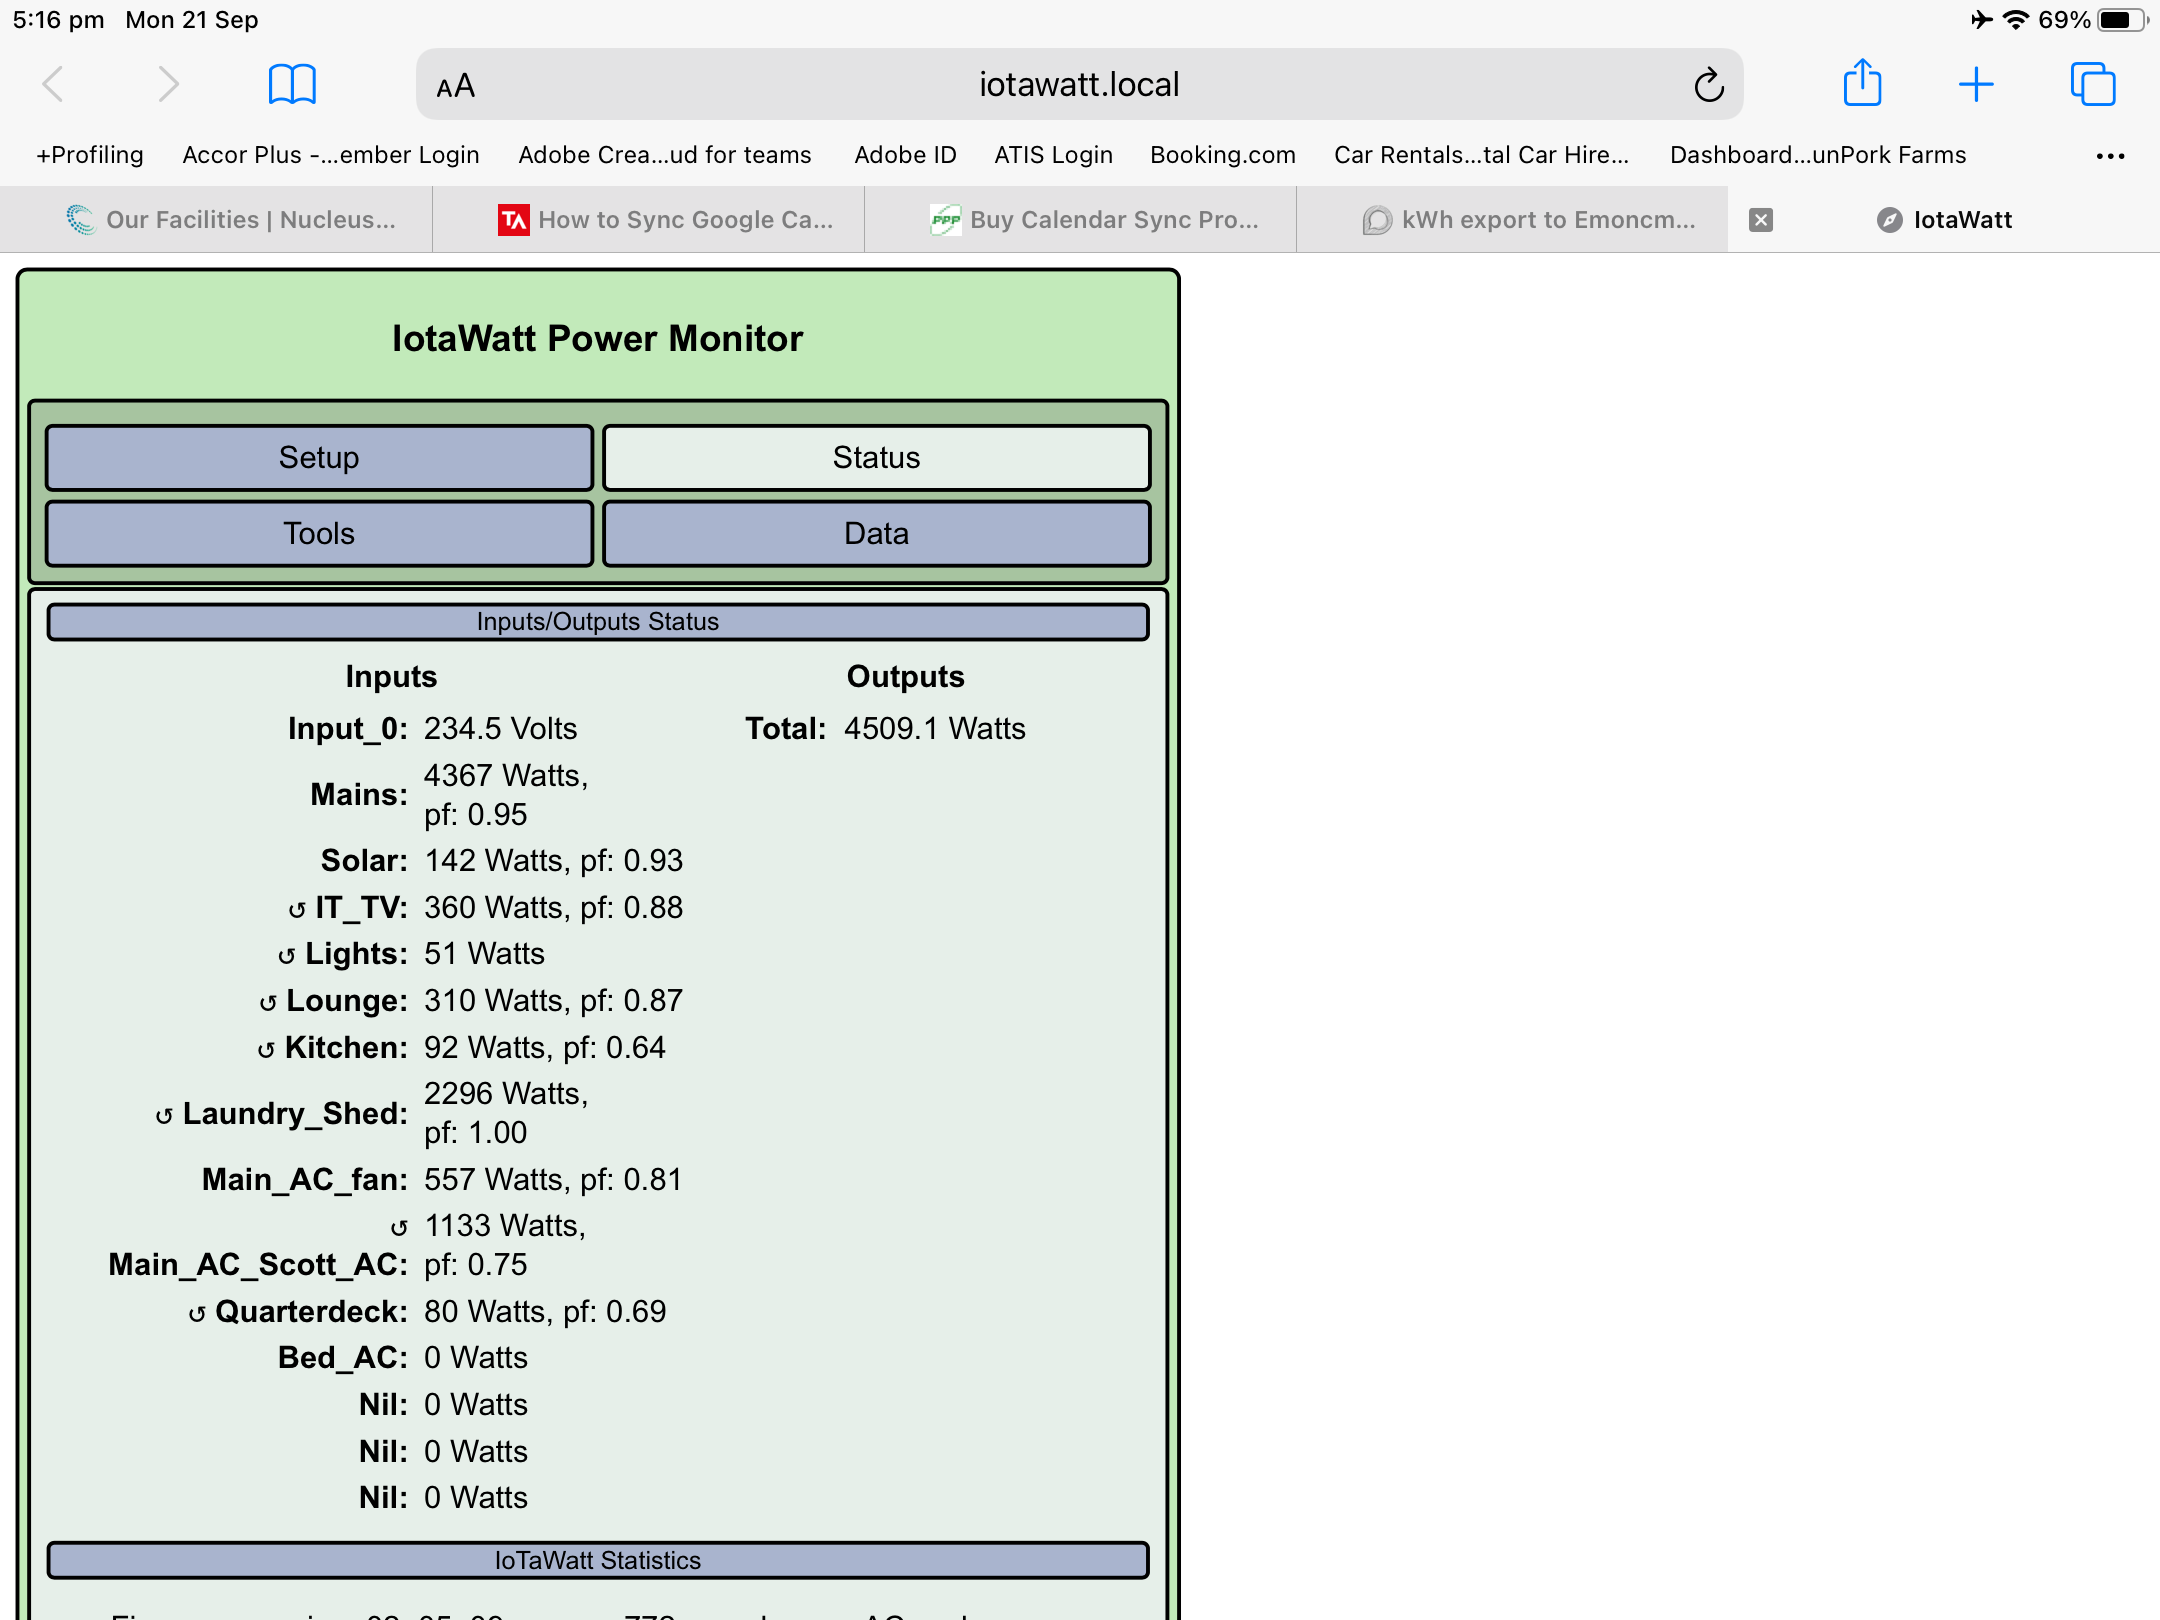
It never resets within the IoTaWatt. Whenever you request kW for a particular interval, it calculates the delta for that period.
Internally, IoTaWatt maintains a running total kWh for each channel since the logs were created. It also maintains a running count of the total hours of measurement (think milliseconds with fractional part). It does the same with VAhrs. That’s it. That’s what is stored. Everything else that you get is derived from that basic data.
If you want the average Watts used in a 10 second interval, we divide the change in kWh by the change in hours. If you want the kWh for any period, we simply serve up the change between the running total at the start and end of the period.
Note that a natural consequence of this scheme is that when you extract Watts for any given period, you get average Watts. In another energy database, where the individual 5 or 10 second Watt values are stored, getting the average requires reading all of those individual measurement, or creating another dataset with the averages. Try it out. Compare an Emoncms graph of something for a day to a Graph+ plot of the same thing. They will look pretty much the same. Now zoom out to a week, month and year. They look very different. Now click the “average” button on Emoncms and suddenly they are alike again. You decide, when looking at last month, which is more useful; a collection of periodic 10 second values or the averages for the intervals in the graph?
Back to your Emoncms questions. There is no appreciable difference between the kWh reported by a “power to kWh” feed in EmonCMS and the Wh dataset in IoTaWatt. Over a period of the last five months, my large industrial test-site has:
meter: 241,200 kWh
IoTaWatt->emoncms: 238,924 kWh (99.1% of meter)
IoTaWatt: 239,895 (99.5% of meter)
As I understand it, Emoncms has a feed that resets daily. I’ve never used it. I’ve found that I can get that data from emoncms by specifying a daily interval and delta values.
Really amazed with this. Emoncms supports different timezone and based on that it resets. I’ve figured out to how to get Kwh/day from Watts in Emoncms.
Will let you know if I stuck in trouble again.
Anyways, As always thanks for your awesome support