Includes all of the influxDB development discussed to date.
Fixes a problem with scripts reporting Amps
Increases available Heap
Better manages the quota of TCP connections used on the ESP8266
Note to previous alpha users, this may break your database. If it changes how you are posting, you can stop posting as soon as the update is restarted using the stop button in the new influxDB status tab. Then make the necessary changes to your influxDB configuration, delete the series that were posted with the new release
DELETE SERIES WHERE TIME > now() - 1h
and start the service back up. Should send the last hour’s data in the altered format.
Moved to the new alpha on Thursday, running smooth since. The new influxdb support (with variable replacements) is awesome!
Thanks for incorporating feedback and executing it so elegantly; the variables allow arbitrary complexity or simplicity. I’ll post some graphs/queries/configs to the influx thread soon. Just wanted to pop in and say thanks!
Also have been using the alpha version and all working well. Did have one hiccup where I could not access the configuration page yesterday, it was still logging data though. I did a power off/on and all works OK now. May or may not have been related to new version.
I have used the ‘default configuration’ and reworked some elements of my solar dashboard (been cloudy and its Autumn here so generation is limited).
Worked out how to graph just yesterdays data and also show import and export.
I wanted to show percentages like:
x% of your consumption was supplied from your solar today
y% of your solar generation today was exported
z% of your consumption today was imported
but this involves a calculation across two measurements which I don’t think infuxDB and hence Grafana can do. If I change and submit all sensor readings as one measurement then I think I could do this but then I move away from the default.
I can’t change the date in the influxDB setup below
The date selector box shows up but when I click a new date it does not change what is displayed.
(Update - while the date does not update in the field when the ‘tick’ is clicked the value is updated when save is clicked at the bottom of the panel. If you come back into the panel the new date is displayed. There is still a formatting error and it would be better if the date updated when selected.)
Another observation that may or may not be intended functionality.
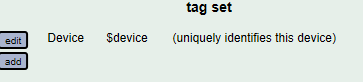
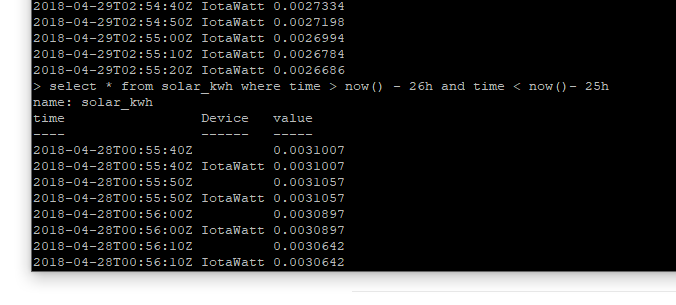
I added tag as below and the data from 2018-04-10 was reposted to influxDB however it added duplicate records with the tag so now I have a record at each time with and without a tag as shown.
The most recent posts don’t have the duplicated record as expected.
I am going to get into the database and delete all the records with no tag as many graphs that sum data are no longer working properly as both records are being summed.
I’ve run across this a couple of times as well. Seems to be related to a poor WiFi link that is error prone. The new core that I’ve switched to has a newer lwip that seems to be a lot faster as well as working with a vpn. I wouldn’t be surprised if it fixes this as well. Nevertheless, I have identified a couple of paths through error handling code that could manifest itself this way and I’ve made some changes in the development stage.
In both of the instances I experienced, uploading had stopped for about 12 hours. Power cycling restarted everything and all of the data was completely uploaded.
I’ve put the new software on that stressed machine that has an mbtf of about 2-3 days, so I should have some confidence in the fixes in a week or so.
Another problem I found was when I added some additional measurements to the influx setup panel.
There were 25 measurements and I had bulk send set to 6 with 10s logging.
I realised later that after adding the new measurements data had stopped being logged to influx. After going down lots of rabbit holes I discovered that if I reduced the number of measurements and reduced bulk send (was 6 now 1) that data started getting sent to influx again.
I expect there is some limit to the size of the packet being sent to influx that I hit. The log file showed no errors at all, would be good to have more errors reported if possible.
Either need to expand this limit or have error trapping to highlight limit exceeded.
There well could be an issue here. Any limitations would be with the IoTaWatt as influx can handle (and prefers) large payloads. With the new core and extra heap I can increase the size, but also I’m looking into using compression (gZip) which influx says they support. The nature of the protocol with lots of repetition should compress very well. If that works, historical upload should get faster as well.
I too have had a couple of WiFi dropouts which can only be resolved by powercycling the IoTaWatt. The LED goes red but continues logging. InfluxDB catches up pretty quick after restarting.
Other than that issue, 02_03_05 has been working well for me.
I did find the problem above and have fixed it in my development branch. It was a simple buffer full issue. The problem you’re reporting is different. One of my home systems has been having that problem with a MBTF of several days. I have not had enough incidents to see any kind of pattern. It seems to have started with the introduction of async HTTP. My development system uses a newer ESP/Arduino core and it is the same.
This is turning into a trade off between intermittent problems and improving general functionality. The async HTTP was huge in both keeping the sampling rate high and not timing out in poor connection environments.
The new core is generally faster and more robust in other ways, but has a temporary memory leak issue with high I/O rates.
To mitigate these problems, the development branch has a watch-dog-timer on the WiFi connection that restarts the ESP if disconnected for 2 hours. The restart takes a couple of seconds and then all of the backed up data is uploaded. Pretty harmless.
The memory leak affects the history upload in that it has to keep pausing to allow the low-level IP code to timeout and release memory. I have a commitment from the ESP folks to resolve that issue, so hopefully it’s a temporary fix.
So the next release will not require that you power cycle, and if I can figure out what I can do to fix the disconnect short of a restart, I’ll fold that in as well.
I also have the problem with a device and the current alpha version and can also confirm that it is probably related to difficult Wifi connections. In this case, the Wifi is completely deactivated overnight and reactivated in the morning. Here, the device on which the alpha version runs must be regularly disconnected from the power supply so that it sends data to the server again.
The second device running with the stable version is not affected by this and transmits all data reliably in the morning after the wifi is back (although no data has arrived here for two days, but this may have another reason).
With the mentioned workaround, would the device restart continuously after the Wifi is off for two hours? Is it better not to use the new alpha version for the scenario described?
I do not have access at the moment, but the update class was not changed after OEM delivered this device. (I use emoncms.org in this case, not InfluxDB).
Can you already estimate when the new Alpha version will be available?