Those look like grafana plots of the heap. How are you generating them? Are you using the firmware from the IoTaWatt update or are you compiling and loading it yourself?
I’m trying to reproduce this problem with little success, so I’m missing some part of the puzzle. I can easily reproduce it if I use a downrev version of asyncHTTPrequest, but with the current version 1.1.6, it runs solid. I had fixed this problem and updated asyncHTTPrequest a day before releasing this ALPHA, so I need to verify what you are running.
There was the possibility that the firmware in the release blob on IoTaWatt.com and in the Github release file are different I suppose, as they come from the same source but not one from the other (I’ll fix that), but I have downloaded both and cannot reproduce with either.
So can you both confirm the source of your firmware? In particular, I’d like to know if you compiled it and if so, what version of asyncHTTPrequest is specified in your platformio.ini file.
I am continuing to research the state of the underlying lwip2 TIME_WAIT situation that causes the problem, but at the same time, I think if you are running an older asyncHTTPrequest, the most expeditious way to solve it is to upgrade that component.
I’ll dig into it deeper after I get verification that you are using the official firmware.
Indeed those plots are from Grafana. I am using collectd to poll the /status endpoint every 10 seconds and am feeding that into Graphite.
I am using the firmware.bin file from Release Development Release · boblemaire/IoTaWatt · GitHub which I manually flashed.
The pausing problem only occurred for me when there is a backlog of data to upload to InfluxDB. During normal operation there does not appear to be any issues with free heap dropping and thus the uploading pausing. The free heap seems quite stable during normal operation.
It seems like this morning I am having a few WiFi issues which you can see in the gaps on the following chart. Free heap drops during catch up and then it stabilises again around 21k:
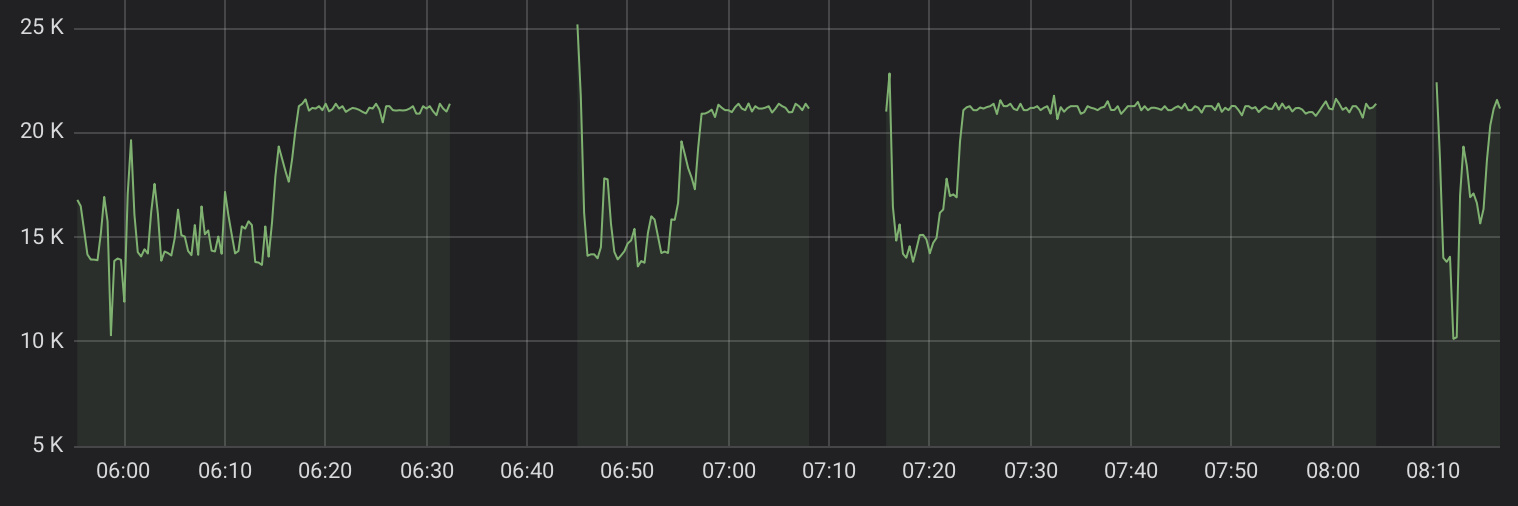
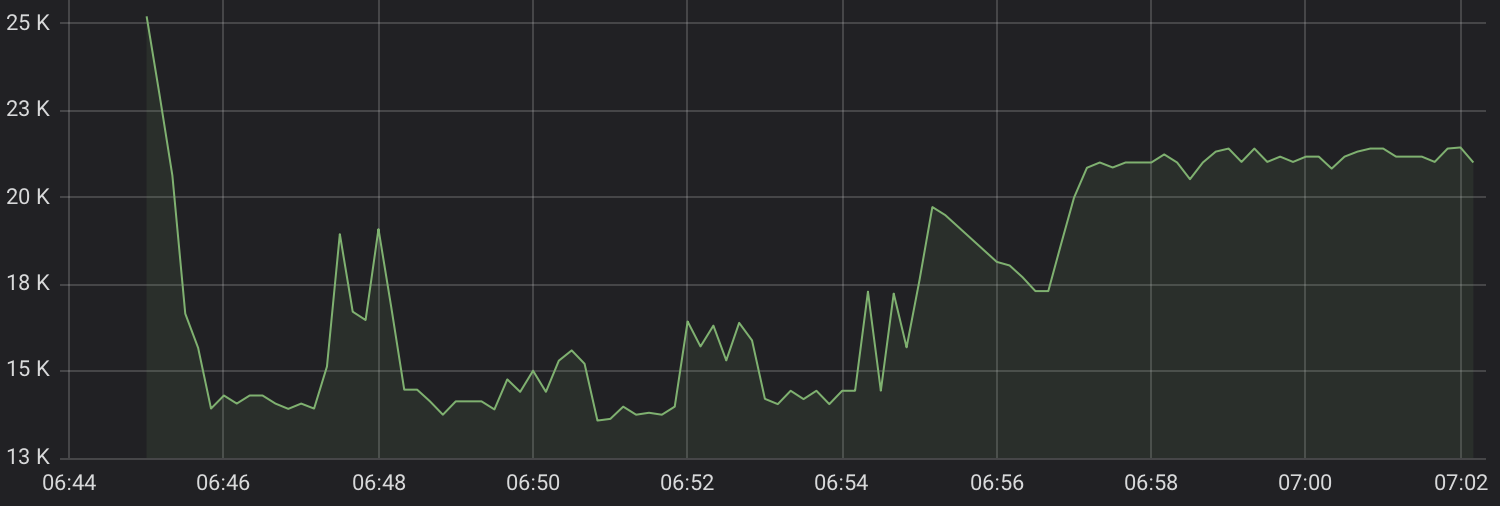
Here’s a more detailed look at one of these events which shows the free heap fluctuating:
My version is from the autoupdate, I did not compile and flash.
My issue was also only obvious when there is a backlog of data. Now that influx is up to date it is not evident.
C@jasoncodes, @Giraffe,
Thanks to you both for the replies.
Jason, The heap graphs are nice. They really show the whole story. The reason that it only bogs down during a backlog is that when current, the I/Os are less frequent and so the 168 bytes lost per update doesn’t drag it down low enough to pause. In about two minutes that’s about 2K, then it gets into “balance” with the timeout freeing memory as often as a new request consumes it. That’s also evident in the graph where the average heap when caught up is about 21K where 23-24K is typical.Note after the WiFi outages that there is nearly 25K available before it starts in again.
It is bouncing back, but at that rate, it would take 2 days to recover a day’s outage. That takes a few minutes here, so I need to get to the bottom of it. It would be so easy to trace and figure out if I could recreate it here…
UPDATE: Just checking the ESP/Arduino repo and it looks like the TIME_WAIT fix was merged 3 days ago. There probably won’t be a release for quite awhile, but I’ll work try to merge that fix into the 2.4.1 release next week.
I’m local testing a new version for release Monday that incorporates a temporary version of the fix for the time-wait problem based on the official fix that was merged last week. There’s a lot of other new stuff in the current core master, so I don’t want to start cutting releases based on that moving target.
For any others, this new release will contain the first cut at authentication that I will explain in another post.