Not expected, but a symptom of a problem that I had believed solved. At issue is the new core and specifically lwip 2, the updated IP layer. The new IP layer is supposed to solve a rash of problems associated with the old 1.4 layer, and it does. Unfortunately, it brings with it some new (old?) problems that were not evident in 1.4. This is a relatively new component, and there are some issues filed against it that are being actively addressed. This looks like one of them.
There is a problem called TIME-WAIT where a server does not explicitly close a connection and the ESP waits about two minutes before doing so unilaterally. Unfortunately, each open connection consumes memory, so in aggregate, the problem eats up the heap if there are a lot of transactions.
There is a safety valve in IoTaWatt where transactions are suspended when heap falls below a threshold. That appears to be what you are experiencing. There is another defense against this problem, which is to simply continue to use the existing connection for subsequent transactions. That’s what other IoTaWatt are doing, and it’s actually very fast. The question is why yours isn’t doing that.
There are some changes coming in the core to limit the number of connections that can be left in TIME-WAIT state, and those should be available soon as well. So I’m optimistic that will be overcome.
In this case, I’d like to better understand what’s different here. My experience is that if it can run in Australia, it can run anywhere. There are communications challenges there that seem to bring out the worst in a firmware and so I’d like to take advantage of this opportunity to fix what can be fixed.
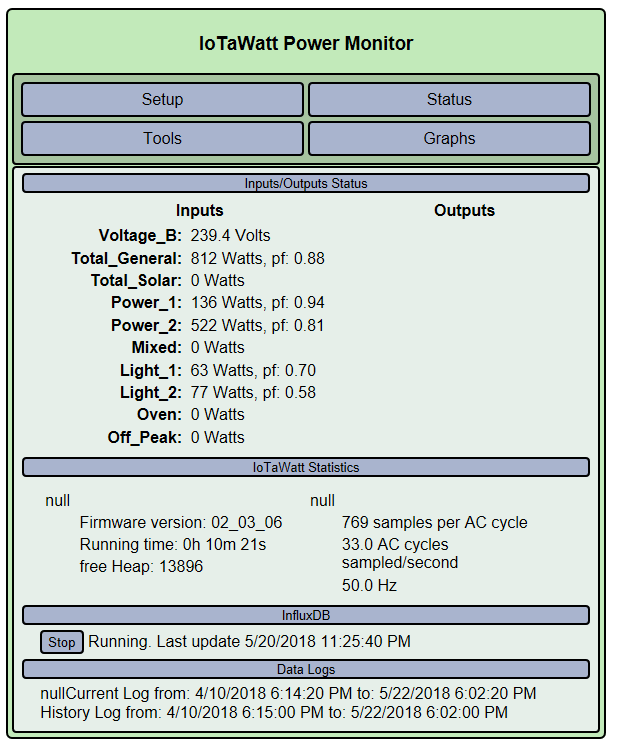
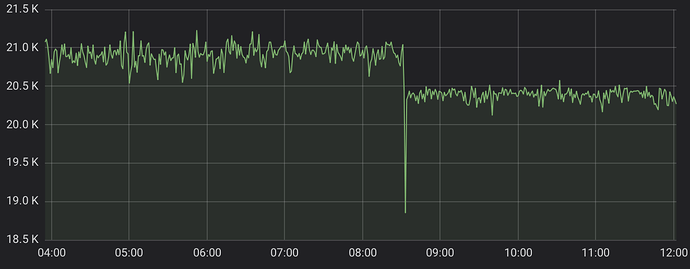
First, could you restart the IoTaWatt and note the amount of Heap immediately after restart? Then watch as it degrades, and tell me how long before it get to the paused state.
Now restart again and when the heap gets below, say 19K or so, hit the STOP button on the influx tab of the status display. When it shows stopped, note the available heap. Wait a few minutes and see if the heap comes back to something near restart levels.
Next, could you explain the environment better. Are you also uploading to Emoncms? Is it local on the Rpi or is it Emoncms.org? Is the raspberry pi on your local LAN? Is the instance of influxDB on the RPi? What version of influx is it?
If you are using Emoncms, could you stop the influx posting and let Emoncms update until current. Note if the heap stays healthy during that process. When it’s up to date, restarting influx, does it work any better?
All this will help me to understand what’s unique about this occurrence.
Thanks
EDIT: Also noticed the null entries in some of the HTML tables of your status display. Those appear to be peculiar to Edge and somewhat benign. I will look into that as well.


