02_03_19 ALPHA adds PVoutput

This release is now available for ALPHA auto-update.

  • PVoutput support. Will upload to PVoutput both free and donor mode with or without PV (generation)

  • Enhanced local-time support - supports daylight time in North America, Europe and Australia.

  • Adds min/max to script (calculator).

  • Reduces use of WiFi Manager to reduce exposure to hang on most restarts.

3 Likes

Bob,

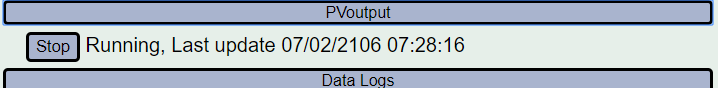
Might have hit a bug. A strange date and no uploading happening.

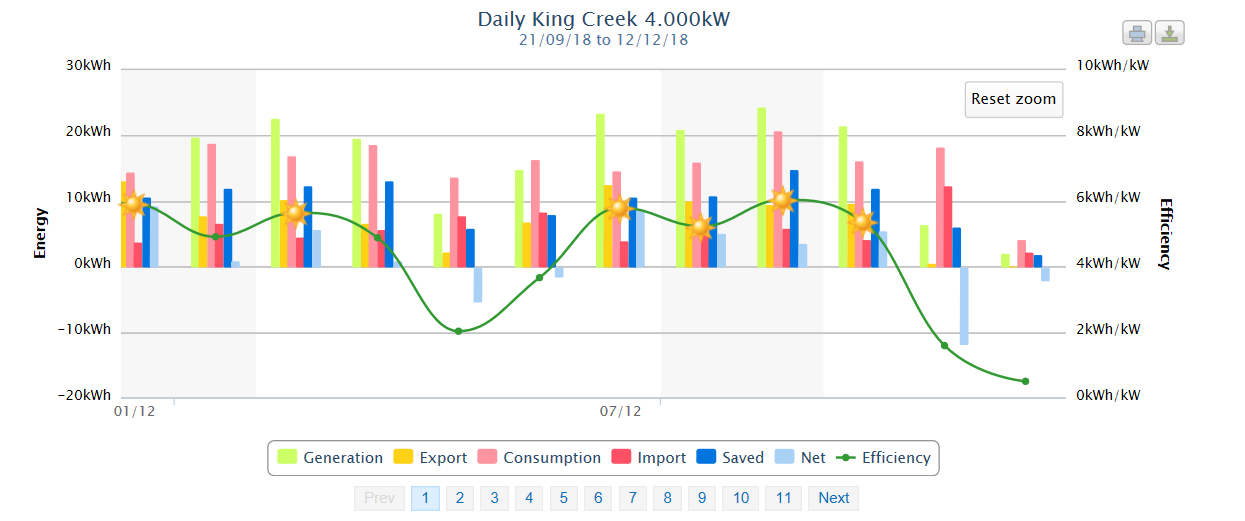
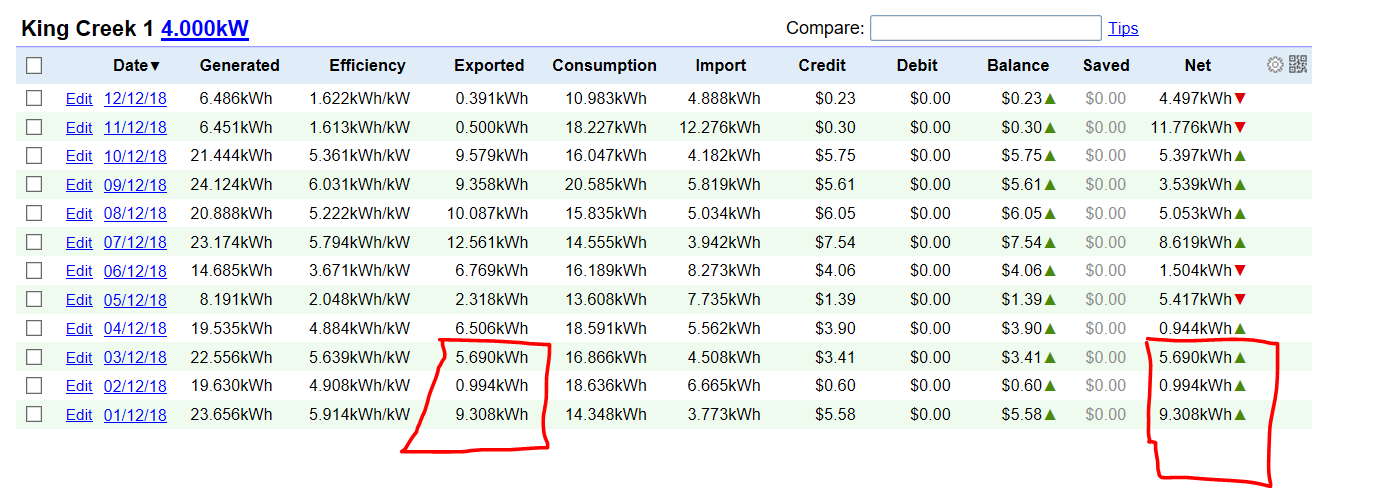
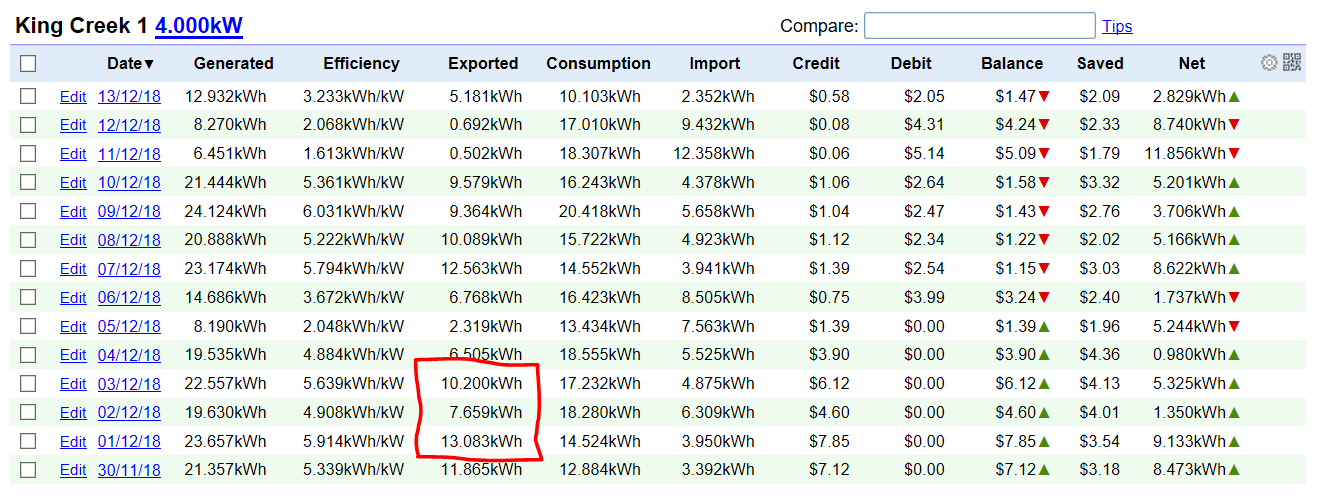
I added the PVoutput server and picked a date six months ago to start loading data. I checked the status and saw that data was not being uploaded. If I looked in PVoutput I could see the daily totals data but no 5 minute data. My guess was that I was expecting too much by loading that much data and PVoutput only allows a limited amount of 5 min data for the free version.

My Log had these entries, will put full log below.

12/11/18 20:53:27 PVoutput: Transaction Rate-Limit exceeded. Waiting until 21:00
12/11/18 21:01:28 PVoutput: Transaction Rate-Limit exceeded. Waiting until 22:00

Can’t remember all the steps or the order that got me here but included stopping and starting upload from Iotawatt status screen, restarting, deleting PVoutput server and adding again. deleting some daily data from PVoutput and trying to load only last 10 days data.

Now that I have this future date then I think that means nothing is going to happen till I can fix this. Looking for where I can clear this date and try to start from scratch with a PVoutput upload.

12/11/18 13:36:47 Updater: firmware upgraded to version 02_03_19
12/11/18 13:36:47 Firmware updated, restarting.

** Restart **

SD initialized.
12/11/18 03:36:53z Real Time Clock is running. Unix time 1544499413
12/11/18 03:36:53z Version 02_03_19
12/11/18 03:36:53z Updater: Installing update files for version 02_03_19
12/11/18 03:36:53z Updater: Installing EDIT.HTM
12/11/18 03:36:53z Updater: Installing GRAPH.HTM
12/11/18 03:36:54z Updater: Installing GRAPH.JS
12/11/18 03:36:55z Updater: Installing INDEX.HTM
12/11/18 03:36:57z Updater: Installing TABLES.TXT
12/11/18 03:36:57z Updater: Installing CNFSTYLE.CSS
12/11/18 03:36:57z Updater: Installation complete.
12/11/18 03:36:57z Reset reason: Software/System restart
12/11/18 03:36:58z Trace: 1:4, 1:5[19], 1:6, 1:1[8], 1:2[9], 9:0[9], 9:0, 9:1, 8:4, 8:6, 8:8, 8:9, 9:3, 9:5, 9:9, 1:2, 1:3, 1:4, 1:5[19], 1:6, 1:1[9], 1:2, 9:0, 9:0, 8:4, 8:6, 8:8, 8:9, 1:2, 1:3, 1:4, 1:5[5]
12/11/18 03:36:58z ESP8266 ChipID: 2991982
12/11/18 03:36:58z SPIFFS mounted.
12/11/18 13:36:59 Local time zone: +10:00
12/11/18 13:37:00 device name: IotaWatt
12/11/18 13:37:00 MDNS responder started for hostname IotaWatt
12/11/18 13:37:00 LLMNR responder started for hostname IotaWatt
12/11/18 13:37:00 HTTP server started
12/11/18 13:37:00 WiFi connected. SSID=Telstra82C2AA, IP=10.0.0.173, channel=1, RSSI -83db
12/11/18 13:37:01 timeSync: service started.
12/11/18 13:37:01 statService: started.
12/11/18 13:37:01 Updater: service started. Auto-update class is ALPHA
12/11/18 13:37:01 dataLog: service started.
12/11/18 13:37:03 dataLog: Last log entry 12/11/18 13:36:15
12/11/18 13:37:03 historyLog: service started.
12/11/18 13:37:04 historyLog: Last log entry 12/11/18 13:36:00
12/11/18 13:37:05 influxDB: started, url=10.0.0.166:8086, db=iotawattnew, interval=10
12/11/18 13:37:08 Updater: Auto-update is current for class ALPHA.
12/11/18 13:37:12 influxDB: Start posting at 12/11/18 13:36:00
12/11/18 20:48:35 PVoutput: started
12/11/18 20:48:36 PVoutput: System King Creek, interval 5, freeload mode
12/11/18 20:52:01 PVoutput: Start status beginning 07/11/18 00:05:00
12/11/18 20:53:27 PVoutput: Transaction Rate-Limit exceeded. Waiting until 21:00
12/11/18 21:01:28 PVoutput: Transaction Rate-Limit exceeded. Waiting until 22:00
12/11/18 21:09:34 Restart command received.

** Restart **

SD initialized.
12/11/18 11:09:36z Real Time Clock is running. Unix time 1544526576
12/11/18 11:09:36z Version 02_03_19
12/11/18 11:09:36z Reset reason: Software/System restart
12/11/18 11:09:36z Trace: 1:3, 1:4, 1:3, 1:4, 1:3, 1:4, 1:3, 1:4, 1:3, 1:4, 1:3, 1:4, 1:3, 1:4, 1:3, 1:4, 1:1[1], 1:2[2], 9:0[2], 9:0, 9:1, 8:4, 8:6, 8:8, 8:9, 9:3, 9:5, 9:9, 1:2, 1:3, 10:2, 10:3
12/11/18 11:09:36z ESP8266 ChipID: 2991982
12/11/18 11:09:36z SPIFFS mounted.
12/11/18 21:09:38 Local time zone: +10:00
12/11/18 21:09:38 device name: IotaWatt
12/11/18 21:09:38 MDNS responder started for hostname IotaWatt
12/11/18 21:09:38 LLMNR responder started for hostname IotaWatt
12/11/18 21:09:38 HTTP server started
12/11/18 21:09:38 PVoutput: started
12/11/18 21:09:38 timeSync: service started.
12/11/18 21:09:39 statService: started.
12/11/18 21:09:39 dataLog: service started.
12/11/18 21:09:40 dataLog: Last log entry 12/11/18 21:09:30
12/11/18 21:09:40 historyLog: service started.
12/11/18 21:09:41 historyLog: Last log entry 12/11/18 21:09:00
12/11/18 21:09:41 WiFi connected. SSID=Telstra82C2AA, IP=10.0.0.173, channel=1, RSSI -85db
12/11/18 21:09:42 Updater: service started. Auto-update class is ALPHA
12/11/18 21:09:42 PVoutput: Transaction Rate-Limit exceeded. Waiting until 22:00
12/11/18 21:09:43 influxDB: started, url=10.0.0.166:8086, db=iotawattnew, interval=10
12/11/18 21:09:43 Updater: Auto-update is current for class ALPHA.
12/11/18 21:09:43 PVoutput: Transaction Rate-Limit exceeded. Waiting until 22:00
12/11/18 21:09:47 influxDB: Start posting at 12/11/18 21:09:40
12/11/18 21:24:31 Restart command received.

** Restart **

SD initialized.
12/11/18 11:24:33z Real Time Clock is running. Unix time 1544527473
12/11/18 11:24:33z Version 02_03_19
12/11/18 11:24:33z Reset reason: Software/System restart
12/11/18 11:24:33z Trace: 1:3, 1:4, 1:3, 1:4, 1:3, 1:4, 1:3, 1:4, 1:3, 1:4, 1:3, 1:4, 1:3, 1:4, 1:3, 1:4, 1:1, 1:2[1], 9:0[1], 9:0, 9:1, 8:4, 8:6, 8:8, 8:9, 9:3, 9:5, 9:9, 1:2, 1:3, 10:2, 10:3
12/11/18 11:24:33z ESP8266 ChipID: 2991982
12/11/18 11:24:33z SPIFFS mounted.
12/11/18 21:24:35 Local time zone: +10:00
12/11/18 21:24:35 device name: IotaWatt
12/11/18 21:24:35 MDNS responder started for hostname IotaWatt
12/11/18 21:24:35 LLMNR responder started for hostname IotaWatt
12/11/18 21:24:35 HTTP server started
12/11/18 21:24:35 PVoutput: started
12/11/18 21:24:35 WiFi connected. SSID=Telstra82C2AA, IP=10.0.0.173, channel=1, RSSI -85db
12/11/18 21:24:36 timeSync: service started.
12/11/18 21:24:36 statService: started.
12/11/18 21:24:36 Updater: service started. Auto-update class is ALPHA
12/11/18 21:24:36 dataLog: service started.
12/11/18 21:24:37 dataLog: Last log entry 12/11/18 21:24:30
12/11/18 21:24:38 historyLog: service started.
12/11/18 21:24:39 historyLog: Last log entry 12/11/18 21:24:00
12/11/18 21:24:39 PVoutput: Transaction Rate-Limit exceeded. Waiting until 22:00
12/11/18 21:24:40 influxDB: started, url=10.0.0.166:8086, db=iotawattnew, interval=10
12/11/18 21:24:40 PVoutput: Transaction Rate-Limit exceeded. Waiting until 22:00
12/11/18 21:24:42 Updater: Auto-update is current for class ALPHA.
12/11/18 21:24:44 influxDB: Start posting at 12/11/18 21:24:40
12/11/18 21:24:46 Restart command received.

** Restart **

SD initialized.
12/11/18 11:24:47z Real Time Clock is running. Unix time 1544527487
12/11/18 11:24:47z Version 02_03_19
12/11/18 11:24:47z Reset reason: Software/System restart
12/11/18 11:24:47z Trace: 1:5[7], 7:0, 7:9, 1:6, 1:3, 1:4, 1:5[7], 7:0, 7:9, 1:6, 1:3, 1:4, 1:5[7], 7:0, 7:9, 1:6, 1:1[1], 1:2[2], 9:0[2], 9:0, 9:1, 8:4, 8:6, 8:8, 8:9, 9:3, 9:5, 9:9, 1:2, 1:3, 10:2, 10:3
12/11/18 11:24:47z ESP8266 ChipID: 2991982
12/11/18 11:24:47z SPIFFS mounted.
12/11/18 21:24:49 Local time zone: +10:00
12/11/18 21:24:49 device name: IotaWatt
12/11/18 21:24:49 MDNS responder started for hostname IotaWatt
12/11/18 21:24:49 LLMNR responder started for hostname IotaWatt
12/11/18 21:24:49 HTTP server started
12/11/18 21:24:49 PVoutput: started
12/11/18 21:24:49 timeSync: service started.
12/11/18 21:24:50 statService: started.
12/11/18 21:24:50 dataLog: service started.
12/11/18 21:24:51 dataLog: Last log entry 12/11/18 21:24:45
12/11/18 21:24:51 historyLog: service started.
12/11/18 21:24:52 historyLog: Last log entry 12/11/18 21:24:00
12/11/18 21:24:52 WiFi connected. SSID=Telstra82C2AA, IP=10.0.0.173, channel=1, RSSI -83db
12/11/18 21:24:53 Updater: service started. Auto-update class is ALPHA
12/11/18 21:24:54 influxDB: started, url=10.0.0.166:8086, db=iotawattnew, interval=10
12/11/18 21:24:54 Updater: Auto-update is current for class ALPHA.
12/11/18 21:24:54 PVoutput: Transaction Rate-Limit exceeded. Waiting until 22:00
12/11/18 21:24:55 PVoutput: Transaction Rate-Limit exceeded. Waiting until 22:00
12/11/18 21:24:58 influxDB: Start posting at 12/11/18 21:24:50

Not sure there’s a problem here. The transaction rate is quite limited in free mode, and this log only shows that the limit was exceeded with the bulk upload and waiting until 22:00 local time to do more. The message in the log is something that I’ll look at, but what is the status now? Did you first get it working with one day of history as r3commended in the wiki?

BTW, a small donation will buy you a lot of increased capacity. I uploaded a month of history in about 10 minutes once I did that.

EDIT: Just to explain how these limits work. There is a maximum write count per hour for any account. This applies to all writes, including writes containing queries or writes that are rejected because PVoutput may still be processing a prior transaction to your account. The limit is 60 per hour in free mode, and 300 per hour in donation mode. When the limit is reached, IoTaWatt just logs that message and stops posting until the hour rolls over and the limits are reset.

Those limits are compounded by the individual batch posting limits. In free mode, one write can contain no more than 30 output or status entries. In donation mode, they can contain up to 100.

So you can see that donation mode has more than 10 times the historical upload capacity. Once history is loaded, free mode is more than adequate to maintain, but you can see that uploading even 14 days history in free mode will take 3-4 hours. It will take about 5 minutes in donation mode.

PVOutput working well, thanks for the hard work.

Im Point Cook 29 if you would like to look at the data.

Thanks @overeasy

1 Like

Patience was the other skill I was lacking yesterday.

Checked this morning and my historical daily data and 5 min data since start of December is on PVoutput and looks great. Confirmed that the totals for generation, consumption, import, export, etc all line up very close to my data and graphs in Grafana.

Created more energy than I used on Monday, was sunny. Pool pump uses most energy in the middle of the day

2 Likes

Saw post was deleted but happy to answer, I made a heap of changes to my import/export/house use calculations around then so I’m assuming it’s something to do with that.

Although having said that, the calculations I changed were for influxdb, so not sure why it’s missing from PVOutput.

Only deleted as I was doing some more calculations and didn’t want to lead you on wild goose chase till I had it clear in my head. Will do some more work and if I see something useful or interesting will point it out.

This is the anomoly I am trying to understand.

Why are the Exported and Net numbers on these three lines exactly the same ? It shouldn’t be so.

As a check for kWh over the day - Generation + Import should equal Consumption + Export. But for these three lines that it does not equal.

I exported the 5 min data and can calculate the same import value at PVoutput but I get a different export value. For example on 1/12/18 I calculate 13.082kWh but PVoutput calculates 9.308.

I went back to my data in Grafana from Influx and there I calculate 13.082. Using 13.082 then Generation + Import equals Consumption + Export

Its a mystery but seems to correct itself after the first three days so maybe I should move on.

Its only that I saw your data had anomolies for the first few days that I thought there might be a common theme here.

Edit If I take the 13.082 export I calculated and subtract the 3.773 import I calculated then I get the 9.308 that PVoutput calculates - 9.308 is the net export - import energy so PVoutput for some reason is calculating the first few days wrong !

Check my graph again, I created a new plant ID to upload to and made iotawatt do a full upload to it. Those earlier days look better now. I noticed in the comments there was no “updated time” on those earlier 4 days, I’ve got a feeling I may have had manual data on those days and maybe iotawatt wouldn’t write over it? PVOutput was saying no live data on those days, but now it has live data.

Username is still Point Cook 29

Think I’m going back to my original data now, for some reason now my credit/debit is showing huge credits per day which is not correct since my change even though the tariffs are correct.

Will wait till its all loaded and take another look then

You might be on to something here. Iotawatt uploads daily summary first (outputs), and there is no limit on how far back it can go, then it uploads the live data (statuses) subject to a look back window. This may be a problem with the output upload. I’ll take a look, but it would be interesting to see if you uploaded yet older data.

@Giraffe, @mobile0408,

I think I see what’s going on here. When doing a history upload, IoTaWatt first uploads daily output summaries for as far back as requested. PVoutput has no limitation on how far back it can go, and IoTaWatt uses the greater of the specified date and the earliest date in it’s history log.

The output records have three metrics:

  • energy generation (generation)
  • energy used (consumption)
  • energy exported

When sending this data, IoTaWatt is computing energy exported as generation - consumption using the daily totals.

When uploading live data (at lets assume 5 minutes), once again the only two metrics are generation and consumption, but it appears the PVoutput computes an import/export value for each of those and then adds up the exports to produce the daily output record.

The net figure is the same either way, but if you have different tariffs for import and export, it is probably important to know how that breaks down. You get it with any outputs created from live statuses, but not for the historical data.

I can read the detail at 5 minute (or whatever it’s set to) intervals, and do the same calculation for the historical data. I’m assuming that will produce the same result as the live data statuses. I will probably do that, although it will slow down the update process somewhat. (won’t impact limits because still the same writes, just different data).

Here’s the dilemma. In true net metering situations, there is one meter that essentially “runs backward” during export. The current method is good for that and will produce the same result. If the export is being measured by a separate meter that only records exported energy, there is a granularity issue. The meter will be very fine granularity. You could say that a mechanical meter has granularity of one AC cycle. I don’t know the granularity of electronic meters, but it is probably small enough to match results of a mechanical meter. IoTaWatt, with 5 second granularity in the current log, is capable of producing an export only value that the sum of the net export at 5 second intervals. With 5 minute intervals to PVoutput, the number is the sum of the net export of those intervals. At some point, the netting is going to diverge from what an export only revenue meter is reporting.

It’s only an issue for tariff calculation, but that’s a big deal in some installations.

So now the question is whether IoTaWatt should use it’s greater granularity to compute more accurate export data. In the case of the status records, there is a way to upload export and import data for each interval. I could do that as well.

If you two would ponder these issues and give me your feedback - and anyone else interested in this, I will start to formulate what changes can/should be made to address this.

I am most likely missing something but let me lead with this first before thinking about the live data.

When using daily totals shouldn’t the calculation be energy exported is generation + import - consumption.

Daily import and export totals can only be calculated from the sum of import or export at each time interval

For example say I generate 10 during the day and consume no energy at all (everything turned off) then the whole 10 will be exported but then I come home and consume 10 at night when there is no generation.

generation- consumption = 0 export which is not correct

generation + import - consumption = 10+10-10=10 correct export.

For the time period of the whole day, it is the net export, so correct in that sense.

Right, if you have import, you can get export, but isn’t it the same problem? If you have generation and consumption you can develop either import or export with the other. The problem is that the import number (or export) must be developed by adding the detail data from the intervals. So if I’m going to do that, I might as well just add up the export.

And even then, it is the sum of 288 net export calculations. Not the same as calculating from say 1 minute intervals (1,440 net calculations).

I’m not hung up on this. I think using the 288 sum to match the outputs created by PVoutput is probably fine and is definitely consistent.

Been thinking through a different approach and this might actually simplify the whole thing.

My thinking is that (generation - consumption) using a single daily generation and consumption number is like using an interval of 1 for the day and not really sensible to calculate import and export, 288 for the day would be more accurate and 1440 better again.

As I understand it the realtime data loaded to PVoutput is just 5 minute data and is only generation and consumption and if you can’t load a 5min import (or export) value that has been calculate from the granular data then there is not much more that can be done. If you could load an import (or export) number then this can be calculated by Iotawatt using granular data and it would be accurate.

The sample rate of the Iotawatt should allow calculation accuracy to be quite close to that of the meter but only if the import (or export) is calculated with the reatime data. Even if its then summarised up to 5 min intervals or even chunkier then over a period of time the result will still be accurate.

1 Like

There is another API for 5 minute import/export, but I have not investigated how that works with the regular status updates. I guess there’s more work to be done. Thanks.

So I set the upload history from 25 November 18 and turned reload history on (previously 1 Dec without reload history off). After a couple of hours I ended up with this being loaded.

Two interesting things happened.

The numbers in red box now look correct and align with my manual calculation using 5 min data and are quite different to what I posted in screen shot above. Looks like what I expected to see.

The live data only loaded back to 30 Nov which was expected as the free PVoutput has 14 day limit for live data. I was expecting earlier dates would populate with daily summaries but that didn’t happen. Was my expectation wrong ?

Also an error is only introduced if there are swings between import and export within 5 min period. If its all import or all export then the 5 min generation - consumption is accurate with positive being export and negative being import.

Eg Export = Generation + Import - Consumption if Import = 0 then we have Export = Generation - Consumption

Has an impact (of unknow size) if the load and generation are tracking closely with significant swings (broken cloud swinging generation output or loads coming on and off or both). As a practical example the graph below shows the most swinging data I could find for my system recently. Over the day there are not many 5min intervals with import and export so the error would be small.