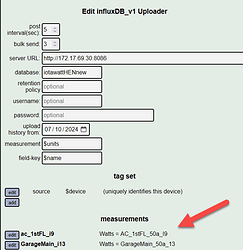
thank you for the additional info (and for all your work on iotawatt- i really love it, and both of my units work perfectly for several months now!).
(and thanks for the clarification on the 15sec resolution- that is what i assumed to be the case, ie a “better” number for the 15 sec polling would be the average over the last 15 sec which the iota-uploader would output ) - but in my case im mainly trying to see if different devices are ON or OFF so a snapshot works for that.
as i said this is rough code below, mostly done by working with chatGPT alot and tweaking what im able to (so I strongly advise anyone against copying and pasting for their own environment).
but below Is what I’m running , and it polls that url/api every 5 seconds via python 2.7 on a Debian OS vm, which manages /runs it as a systemd service (or whatever you call systemctl status myIotaWattPoller).
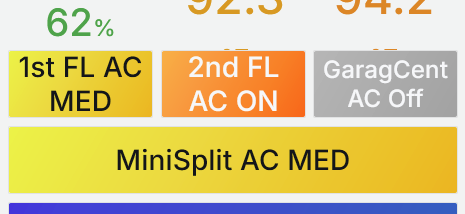
you can see im using watt thresholds to then tell grafana if my variable speed air-condition unit is running off/low/medium/high - i could do that ALL over in grafana but i prefer this)
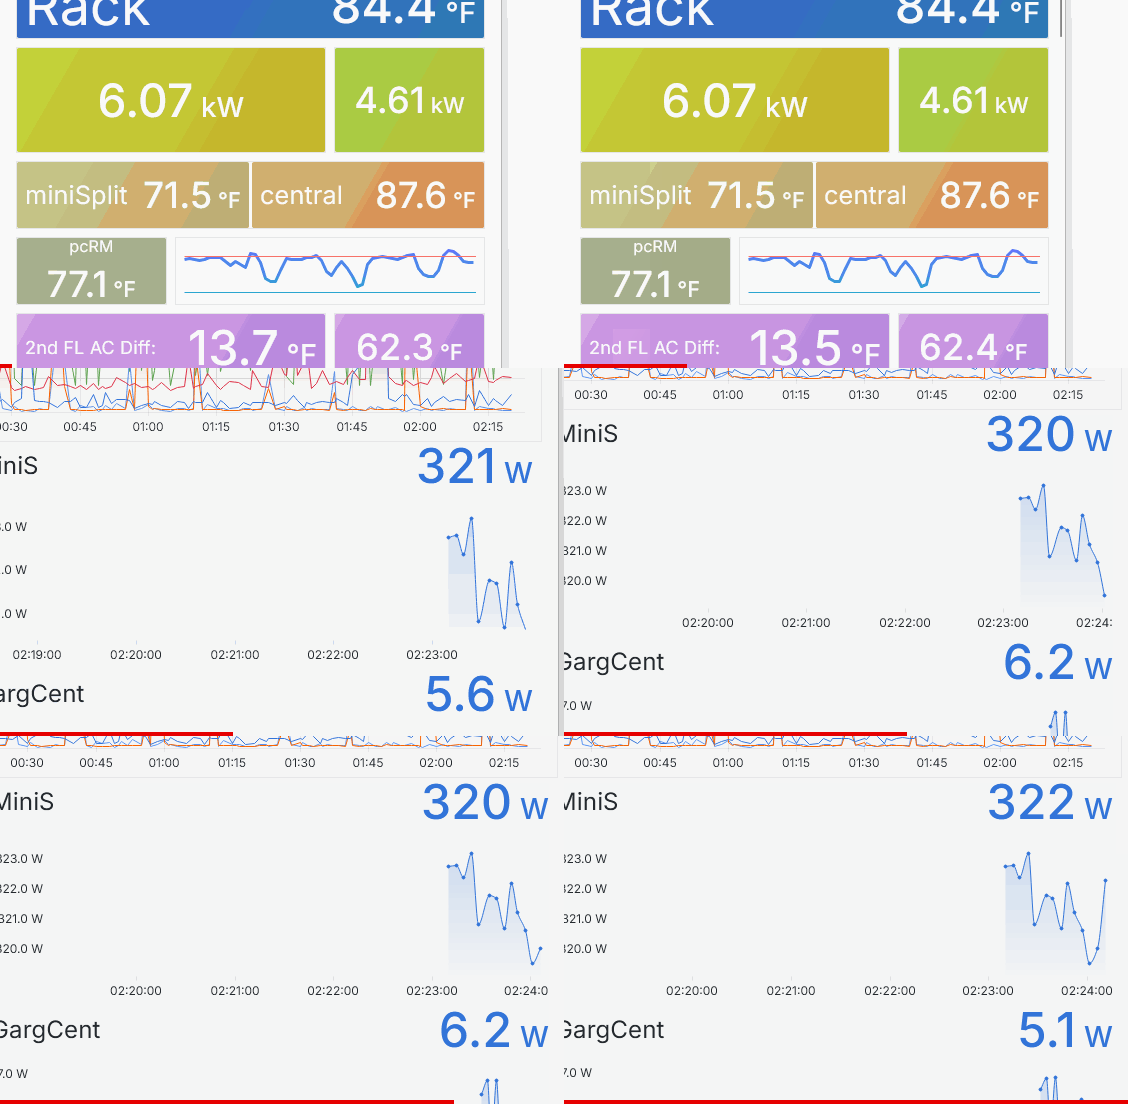
one example usage of this data are these which update in realtime (and wo dashboard reloads) over in grafana. i have several grafana dashboards displaying 24/7 on monitors - 1x set via a windows PCs + nativefier (browser app) and some using rasPIs 4b or pi-5’s accessing the dashboard url → a hdmi monitor at full screen): it all works very well and reliably. (im happy to share whatever, just ask/reply here)

(a note on rasPi’s in a un-attended setup - I have a few different use cases for raspberry pis that display XYZ 24/7, I have found that the best way to monitor if a ras-pi is doing what it’s supposed to be doing , is by monitoring bandwidth usage over its network interface. IE: if MB moved over prior 3 minutes drops below 5MB, then restart the service (or just reboot the entire rasPI) - assuming bw usage correlates to whatever your raspberry pie is displaying (like showing grafana dashboards, or displaying CCTV cameras / a VNC client session)
import requests
import time
import socket
import json
from websocket import create_connection, WebSocketConnectionClosedException
from threading import Thread, Event
import subprocess  # Added for executing shell commands

#

GRAPHITE_SERVER = '172.17.69.40'  # Replace with your Graphite server
GRAPHITE_PORT = 2003
GRAPHITE_PREFIX = 'telegraphFASTsnmp.iotaWatt.MainPanel'  # Replace with your desired prefix
DEBUG = False  # Set to True to enable debug mode - Script will only output to console and NOT send to Graphite OR Grafana Live.

GRAFANA_ENABLED = True  # Set to True to enable Grafana streaming
SPECIFIED_METRICS = ['outputs.sum_bothMAINs', 'outputs.AC_1stFL_i9', 'inputs.inpt0_Input_0.Vrms', 'outputs.GarageFeed_i13']  # ONLY these will be live streamed to grafana
GRAFANA_LIVE_MEASUREMENTS_URL = 'ws://172.17.69.40:3000/api/live/push/iotaMain'  # Grafana WebSocket URL
GRAFANA_API_TOKEN = 'glsa_Vz9qmAATNcXqXXX'  # Replace with your Grafana API key

# Below is IOTAWATT URL to pull stats from
STATUS_URL = 'http://10.6.6.243/status?state&inputs&outputs&stats&wifi'
SERIES_URL = 'http://10.6.6.243/query?show=series'

channel_names = {}
stop_event = Event()

# Counters for failed connections
failed_connection_count = 0
MAX_FAILED_CONNECTIONS = 5  # Threshold for restarting the service

def fetch_channel_names():
    global channel_names, failed_connection_count
    while not stop_event.is_set():
        try:
            response = requests.get(SERIES_URL, timeout=5)
            data = response.json()
            series = data['series']
            channel_names = {index: series[index]['name'] for index in range(len(series))}
            if DEBUG:
                print('Fetched channel names:', channel_names)
            failed_connection_count = 0  # Reset the counter on success
        except requests.RequestException as e:
            failed_connection_count += 1
            if DEBUG:
                print('Error fetching channel names:', e)
            if failed_connection_count >= MAX_FAILED_CONNECTIONS:
                restart_service()
                failed_connection_count = 0
        for _ in range(3 * 60 * 60):  # Sleep for 3 hours in 1-second increments
            if stop_event.is_set():
                break
            time.sleep(1)

def is_numeric(value):
    try:
        float(value)
        return True
    except ValueError:
        return False

def convert_value(value):
    if isinstance(value, bool):
        return int(value)
    if is_numeric(value):
        return float(value)
    return None

def send_to_graphite(path, value, timestamp):
    global failed_connection_count
    value = convert_value(value)
    if value is None:
        return
    full_path = '{}.{}'.format(GRAPHITE_PREFIX, path)
    message = '{} {} {}\n'.format(full_path, value, timestamp)
    message = ' '.join(message.split())
    if DEBUG:
        print(message)
    else:
        try:
            sock = socket.socket()
            sock.settimeout(5)  # Added timeout
            sock.connect((GRAPHITE_SERVER, GRAPHITE_PORT))
            sock.sendall((message + '\n').encode('utf-8'))
            sock.close()
            failed_connection_count = 0  # Reset on success
        except (socket.error, socket.timeout) as e:
            failed_connection_count += 1
            if DEBUG:
                print('Socket error:', e)
            log_error('Socket error: {}'.format(e))
            if failed_connection_count >= MAX_FAILED_CONNECTIONS:
                restart_service()
                failed_connection_count = 0  # Reset after restarting

def send_to_grafana(metric, value, timestamp, ws):
    global failed_connection_count
    value = convert_value(value)
    if value is None:
        return  # Skip non-numeric data
    line_protocol = '{},metric={} value={} {}'.format(GRAPHITE_PREFIX, metric, value, timestamp * 1000000000)
    if DEBUG:
        print(line_protocol)
    else:
        try:
            ws.send(line_protocol)
            failed_connection_count = 0  # Reset on success
        except (WebSocketConnectionClosedException, socket.error, socket.timeout) as e:
            failed_connection_count += 1
            if DEBUG:
                print("WebSocket error: {}, attempting to reconnect".format(e))
            ws.close()
            try:
                ws = create_connection(GRAFANA_LIVE_MEASUREMENTS_URL, header=["Authorization: Bearer {}".format(GRAFANA_API_TOKEN)], timeout=5)
                ws.send(line_protocol)
                failed_connection_count = 0  # Reset on success
            except Exception as e:
                if DEBUG:
                    print("Failed to reconnect WebSocket:", e)
                if failed_connection_count >= MAX_FAILED_CONNECTIONS:
                    restart_service()
                    failed_connection_count = 0  # Reset after restarting

def should_send_to_grafana(metric):
    for specified_metric in SPECIFIED_METRICS:
        if metric.startswith(specified_metric):
            return True
    return False

def parse_and_send_data(ws):
    global failed_connection_count
    if not channel_names:
        return

    try:
        response = requests.get(STATUS_URL, timeout=5)
        data = response.json()
        timestamp = int(time.time())
        failed_connection_count = 0  # Reset the counter on success

        stats = data['stats']
        for key, value in stats.items():
            metric = 'stats.{}'.format(key)
            send_to_graphite(metric, value, timestamp)
            if should_send_to_grafana(metric):
                send_to_grafana(metric, value, timestamp, ws)

        inputs = data['inputs']
        for index, input_data in enumerate(inputs):
            channel = input_data["channel"]
            channel_name = channel_names.get(index, 'channel{}'.format(channel))
            for key, value in input_data.items():
                if key != 'channel':
                    metric = 'inputs.inpt{}_{}.{}'.format(channel, channel_name, key)
                    send_to_graphite(metric, value, timestamp)
                    if should_send_to_grafana(metric):
                        send_to_grafana(metric, value, timestamp, ws)

        outputs = data['outputs']
        for output_data in outputs:
            name = output_data['name']
            metric = 'outputs.{}'.format(name)
            send_to_graphite(metric, output_data['value'], timestamp)
            if should_send_to_grafana(metric):
                send_to_grafana(metric, output_data['value'], timestamp, ws)

            if 'AC_1stFL_i9' in name:
                ac_status_value = output_data['value']
                if 0 <= ac_status_value < 400:
                    ac_status = 0
                elif 400 <= ac_status_value < 1200:
                    ac_status = 1
                elif 1200 <= ac_status_value < 4000:
                    ac_status = 2
                else:
                    ac_status = -1
                send_to_graphite('ACs_ON_OFF_Status.AC_1stFL_i9', ac_status, timestamp)
                send_to_grafana('ACs_ON_OFF-AC_1stFL_i9', ac_status, timestamp, ws)

        wifi = data['wifi']
        for key, value in wifi.items():
            metric = 'wifi.{}'.format(key)
            if is_numeric(value):
                send_to_graphite(metric, value, timestamp)
                if should_send_to_grafana(metric):
                    send_to_grafana(metric, value, timestamp, ws)
            else:
                if DEBUG:
                    print('Skipping non-numeric wifi data:', metric, value)
    except requests.RequestException as e:
        if DEBUG:
            print('Error fetching data:', e)
        failed_connection_count += 1
        if failed_connection_count >= MAX_FAILED_CONNECTIONS:
            restart_service()
            failed_connection_count = 0
        time.sleep(5)

def restart_service():
    try:
        result = subprocess.call(['service', 'iotaWattMAIN_pythonTO_graphite', 'restart'])
        if DEBUG:
            if result == 0:
                print("Service iotaWattMAIN_pythonTO_graphite restarted successfully.")
            else:
                print("Failed to restart service with exit code: {}".format(result))
    except Exception as e:
        if DEBUG:
            print("Failed to restart service: {}".format(e))

def main():
    if GRAFANA_ENABLED and not DEBUG:
        try:
            ws = create_connection(GRAFANA_LIVE_MEASUREMENTS_URL, header=["Authorization: Bearer {}".format(GRAFANA_API_TOKEN)], timeout=5)
        except Exception as e:
            if DEBUG:
                print("Failed to establish WebSocket connection:", e)
            ws = None
    else:
        ws = None
    fetch_thread = Thread(target=fetch_channel_names)
    fetch_thread.start()
    try:
        while not stop_event.is_set():
            parse_and_send_data(ws)
            for _ in range(4):
                if stop_event.is_set():
                    break
                time.sleep(1)
    except KeyboardInterrupt:
        stop_event.set()
    finally:
        stop_event.set()
        fetch_thread.join()
        if ws:
            ws.close()

if __name__ == '__main__':
    main()


