So I just got my first monthly bill since having the IotaWatt installed and the IoTaWatt readings are about 3% high and low compared to my bill.
.
From what I’ve been reading here I should be able to do better, 1% seems to be the accepted accuracy.
I double checked the Input0 calibration. The voltage was within 0.1V (at 238Vrms) according to my Fluke 179 DMM when measured in the socket next to the Powertech MP-3027(AUS).
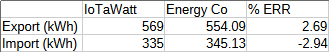
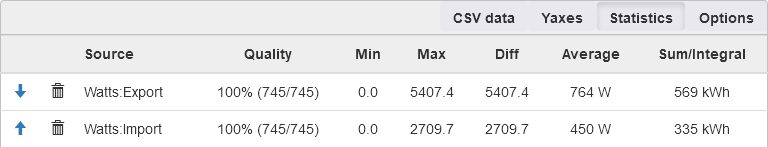
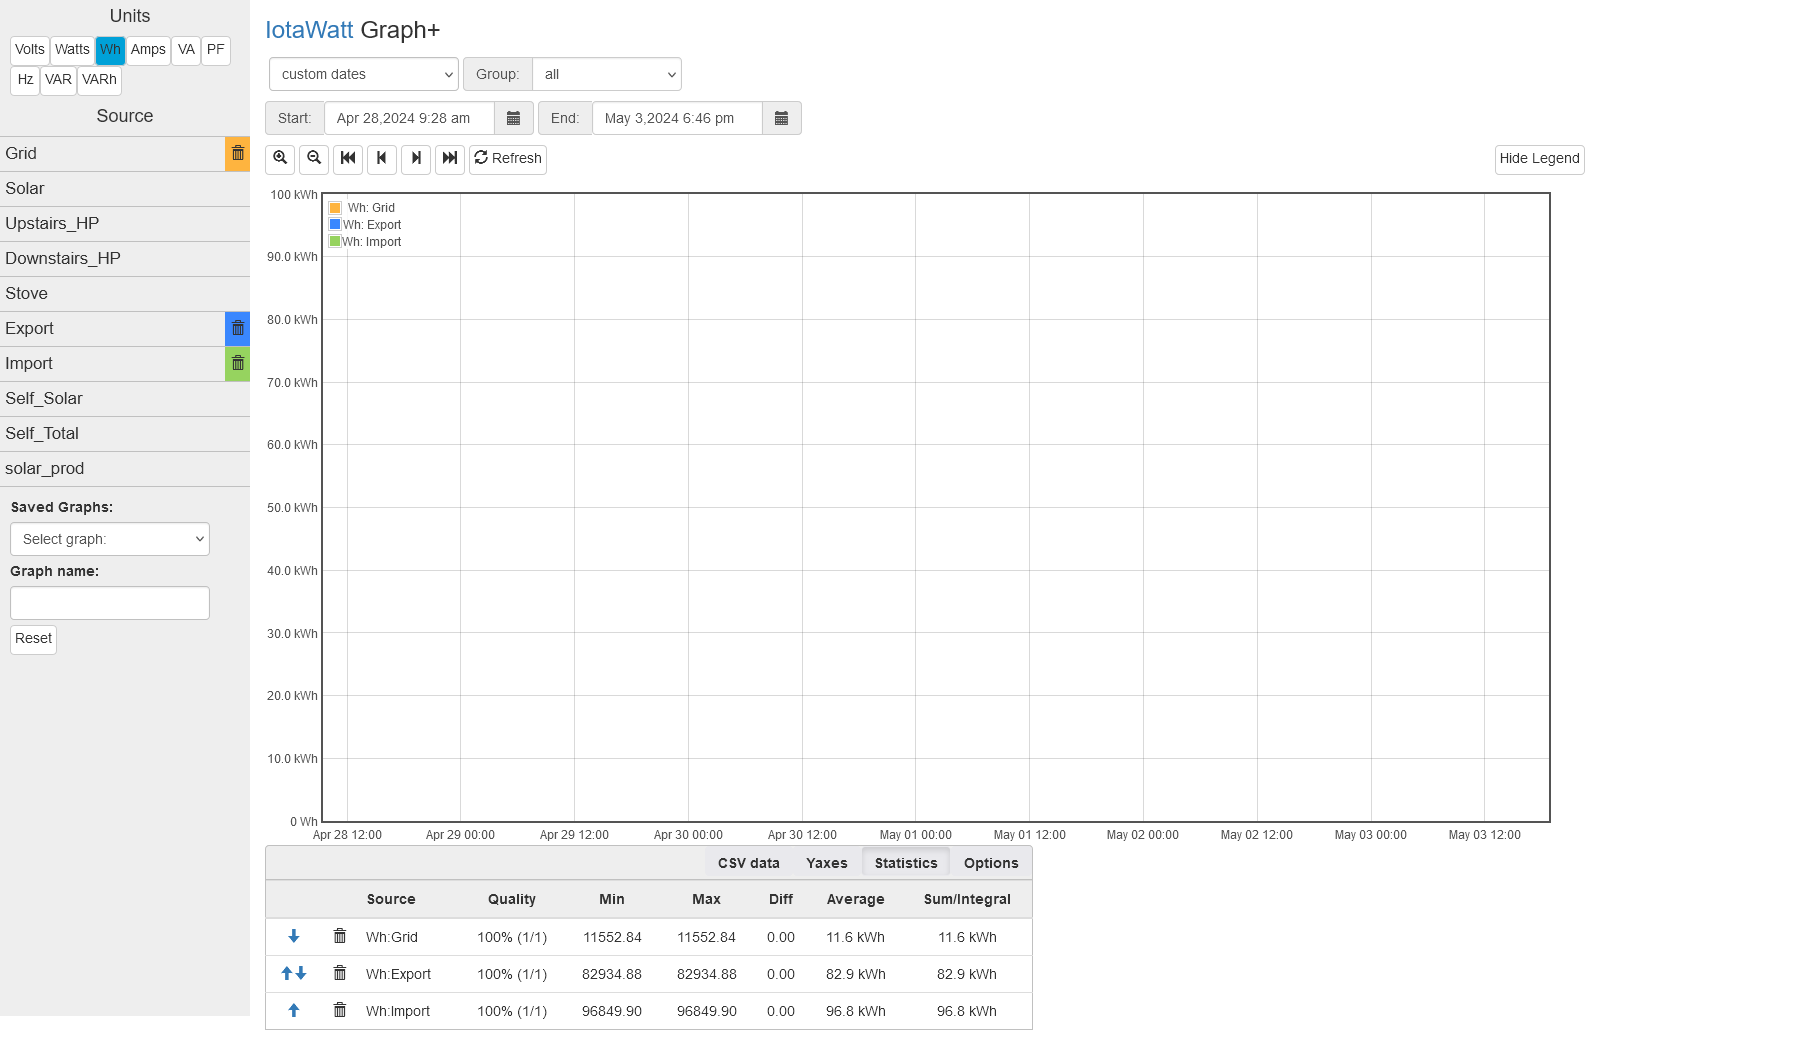
It appears that the IoTaWatt export is high by 15 kWh and the import is low by 10 kWh, so a net difference of 5kWh.
Assuming this is a monthly bill covering about 30 days, you are exporting an average of 19kWh/day and importing an average of 10 kWh/day. As those are averages, an individual day could be quite a bit higher or lower depending on weather. I think it’s safe to assume those values could vary 30% or more.
A monthly bill usually only states the reading dates, not the time. As the import/export activity is usually concentrated over about 8 hours of the day and your average variation is less than a typical day’s activity, the time of those billing readings is important and could easily create the discrepancy. So what is needed is more control over the measurement time.
If you simply plug the reading dates into Graph+ as the period start and end dates, the time defaults to12:00am and so includes all of the begin day, and none of the ending day.
If you keep track of each month and do the same analysys over say 6 months, the effect of starting and ending days as a percentage of error should go down. But you probably want a faster way to resolve this. If you cannot be certain of the meter reading times, you can read the meter yourself:
Electric meters are required to have a display of the kWh used. You need to read net usage, so if the meter shows that, great, if it shows import and export, you will need to net those figures.
Watch you meter for awhile until you notice it changing value.
Record the reading, date and time.
Wait a couple of days and do the same.
Compare the meter net usage to an IoTaWatt query using those dates and times as begin and end.
I mean the accuracy is already acceptable compared to what I was using which was out by over 10-15% sometimes. I’m just wondering why my accuracy is a little worse than expected and if there is anything I can do to make it better.
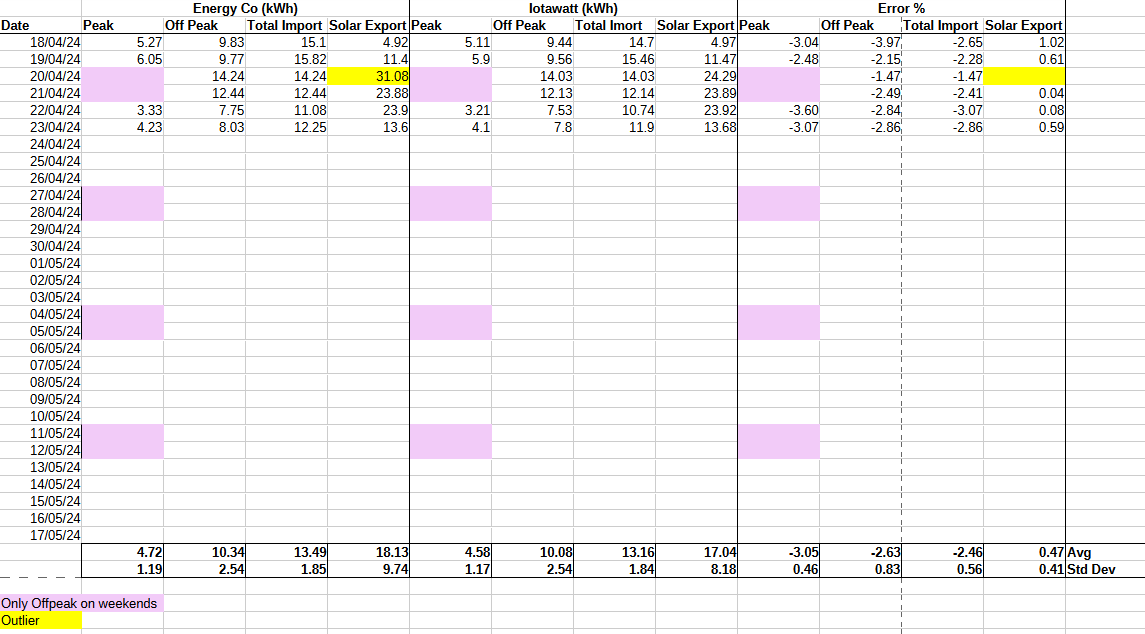
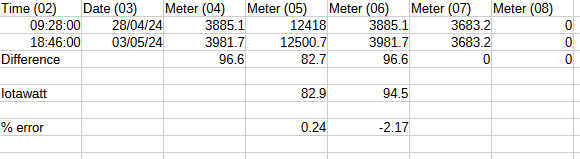
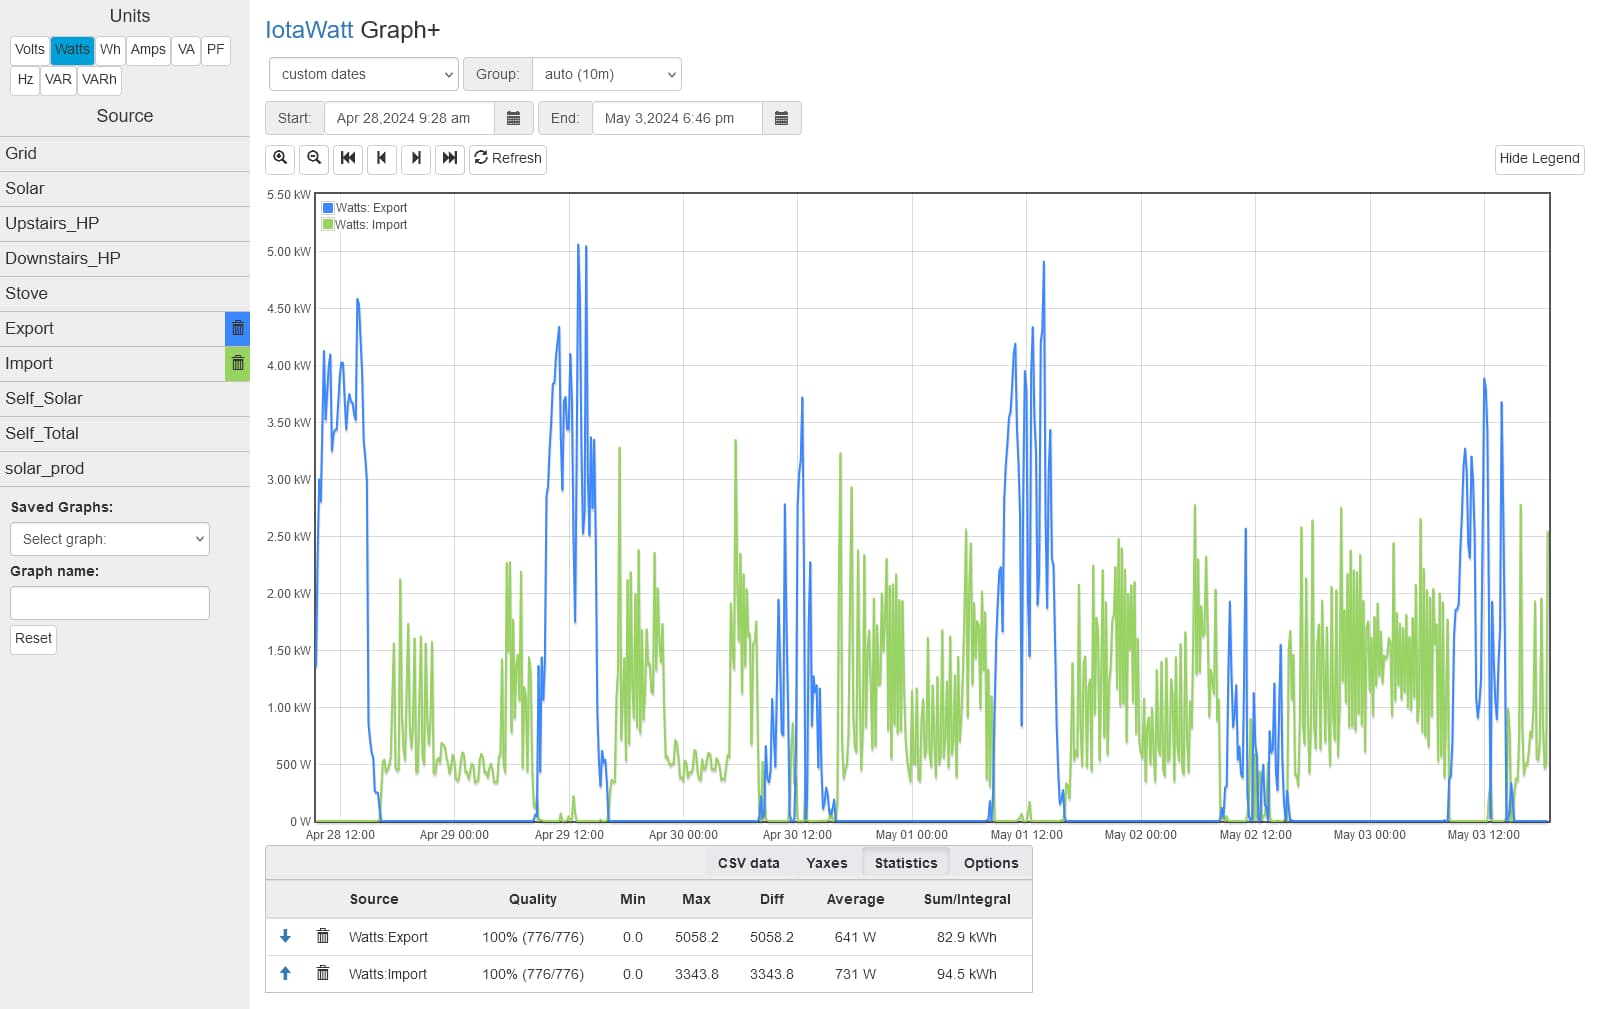
That’s pretty close, I have been collecting daily data manually this month which is made available from my energy supplier on their website (hard to scrape and no API ). Heading into winter those values are changing a bit (less export, more import):
The data in yellow was not available until yesterday and I believe it may have been corrupt and substituted for an estimate based on past data. As it is a huge outlier I have not included it in my error calculations.
The time of reading is an interesting point. It is a smart meter with daily totals available on-line so I assumed it was midnight to midnight, which is what I used in iotawatt graph+: 18th March at 12am to 17th April at 11:59pm.
I was thinking that it may be due to the fact that I am using the AcuCT-H040-50 50A CTs available from your store but my loads average a small percentage of that most of the time. At first the fact that I am seeing very good accuracy from my solar inverter CT and not from the Grid CT seems to point to either a grid CT issue or maybe the nature of the grid load (spiky fridge compressor, peaky switch-mode power supplies, etc…).
But now I think it could also be that the energy supplier’s smart meter is off by a few percent at those low loads. From what I have been reading “Class 1” meters are only 1% accurate from 100A to 20 and 2% from 20A to 1A. And my loads are a lot lower than the rated full load of that meter (100A). The resolution is 1Wh or 1VA so that shouldn’t affect things much.
The error in the grid sensor does seem pretty constant. After collecting a bit more data I could possibly calibrate it out in the Output setting.
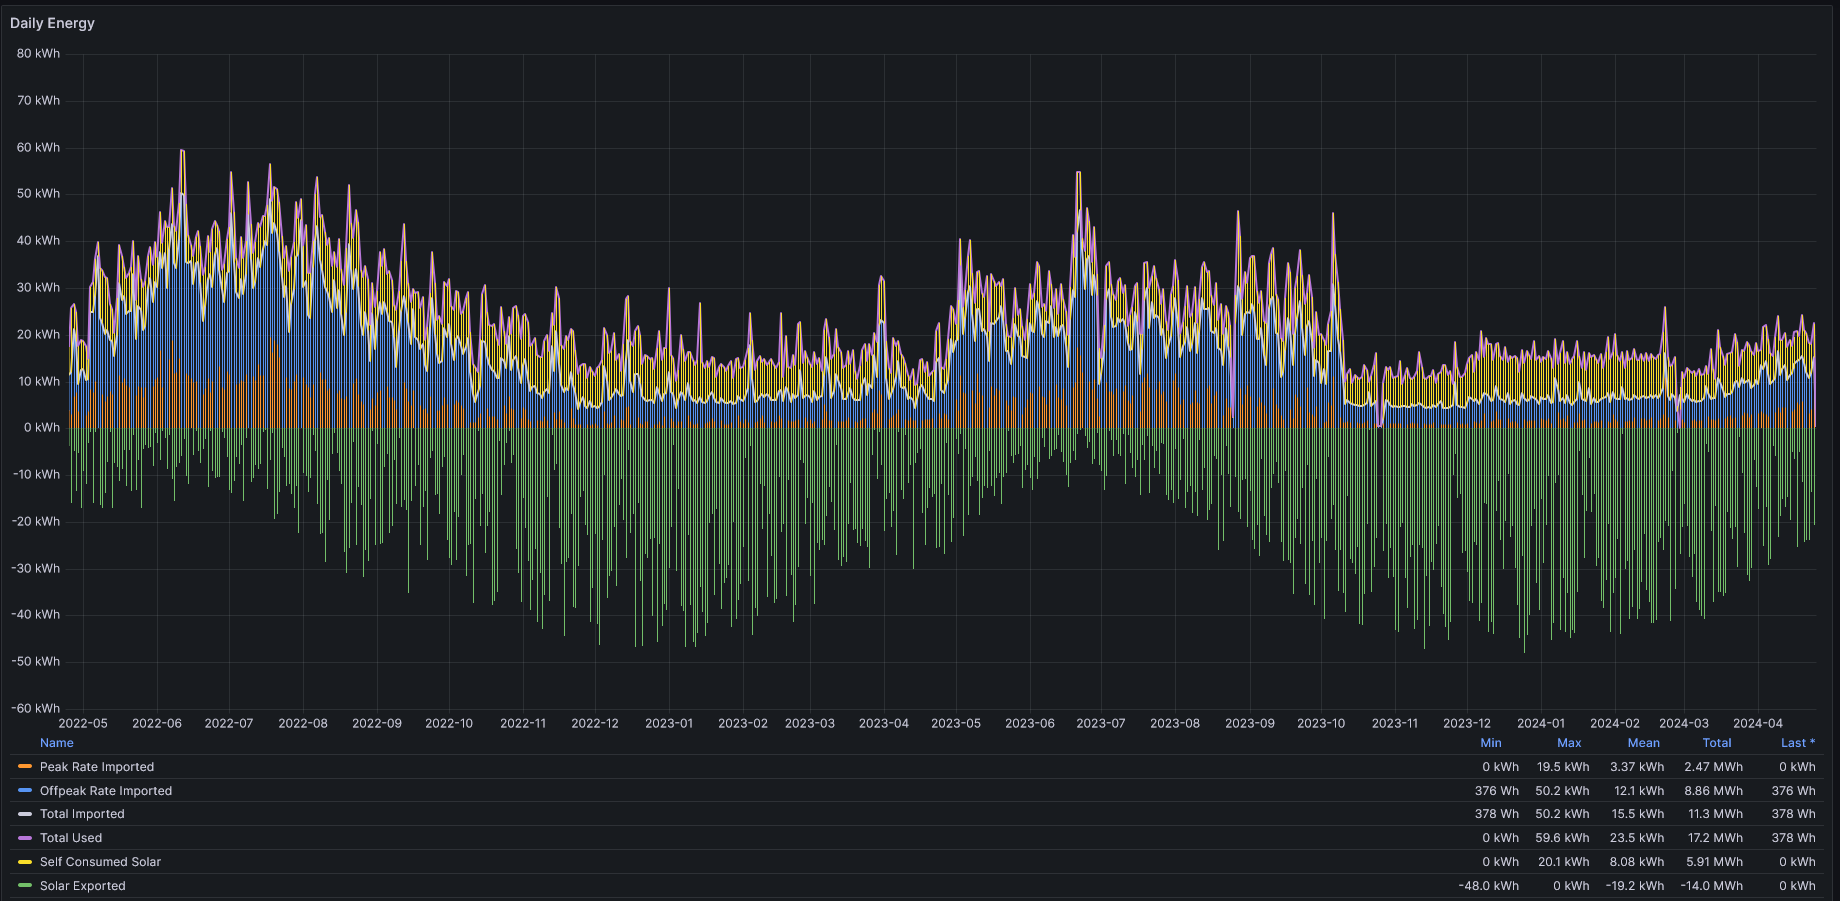
Winter months may shed some light on the matter as my heating load goes up by quite a bit. This is two years worth of data from my previous meter:
Note the savings I made in the second year’s winter by implementing smart heating control. Just by lowering the temperature slightly during peak electricity times and further when in bed (yes I have a sensor for that) or when away I saved quite a bit but the house was still a comfortable temperature.
You have not established any basis for that. First step is to remove all of the speculation and compare the meter physical display to IoTaWatt over a few days.
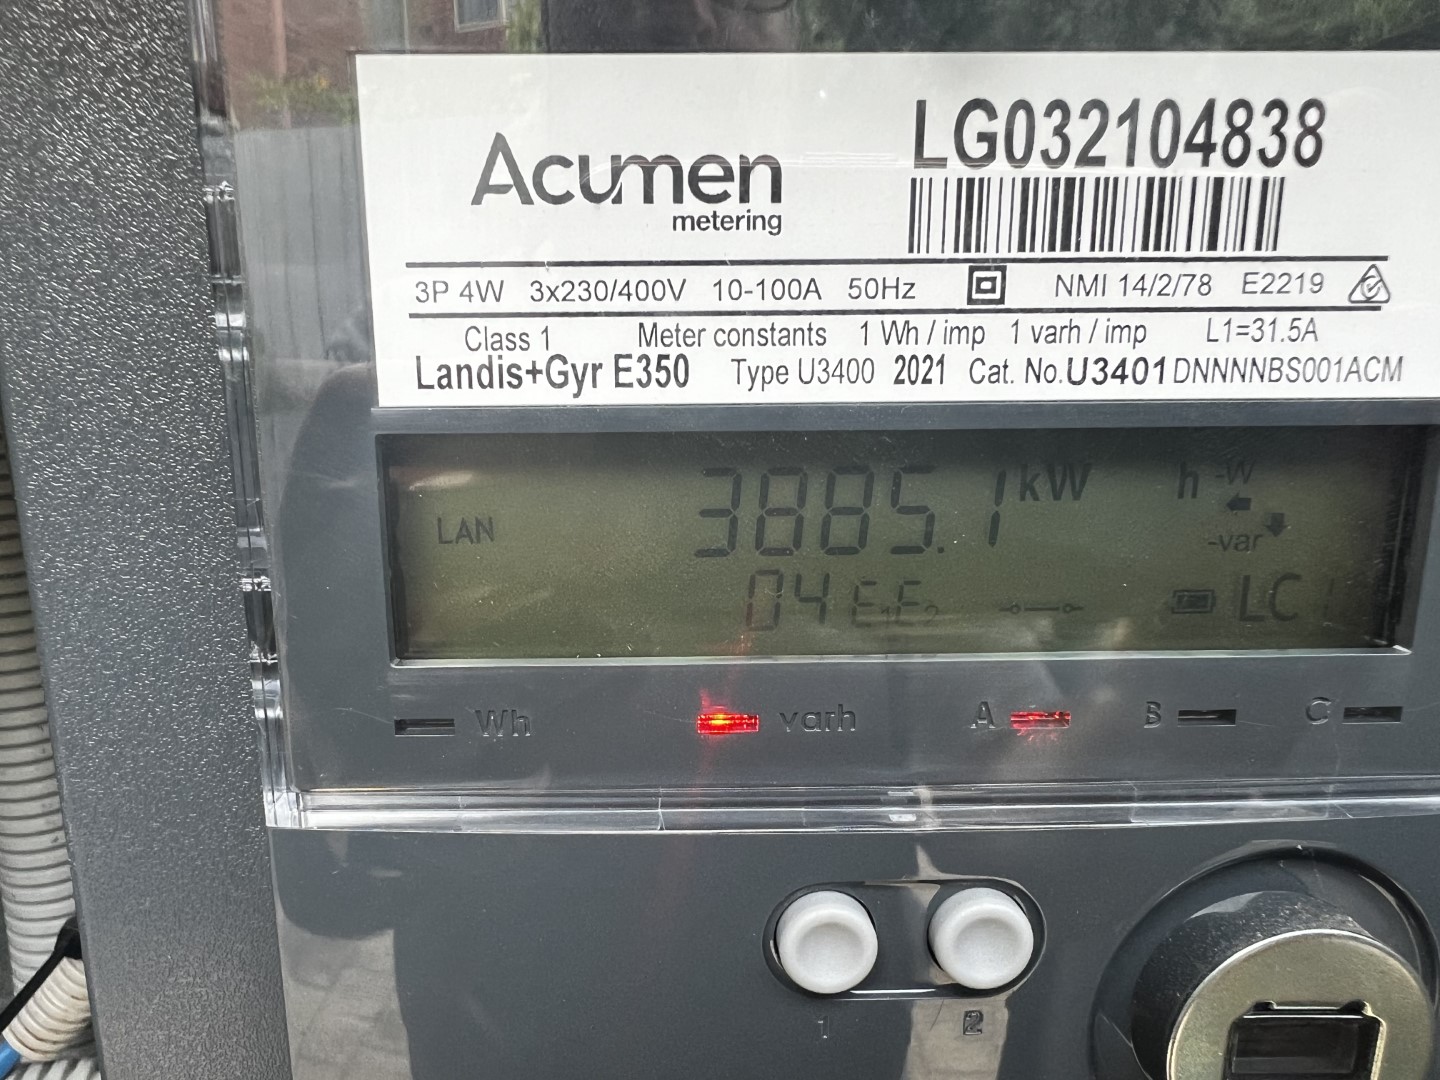
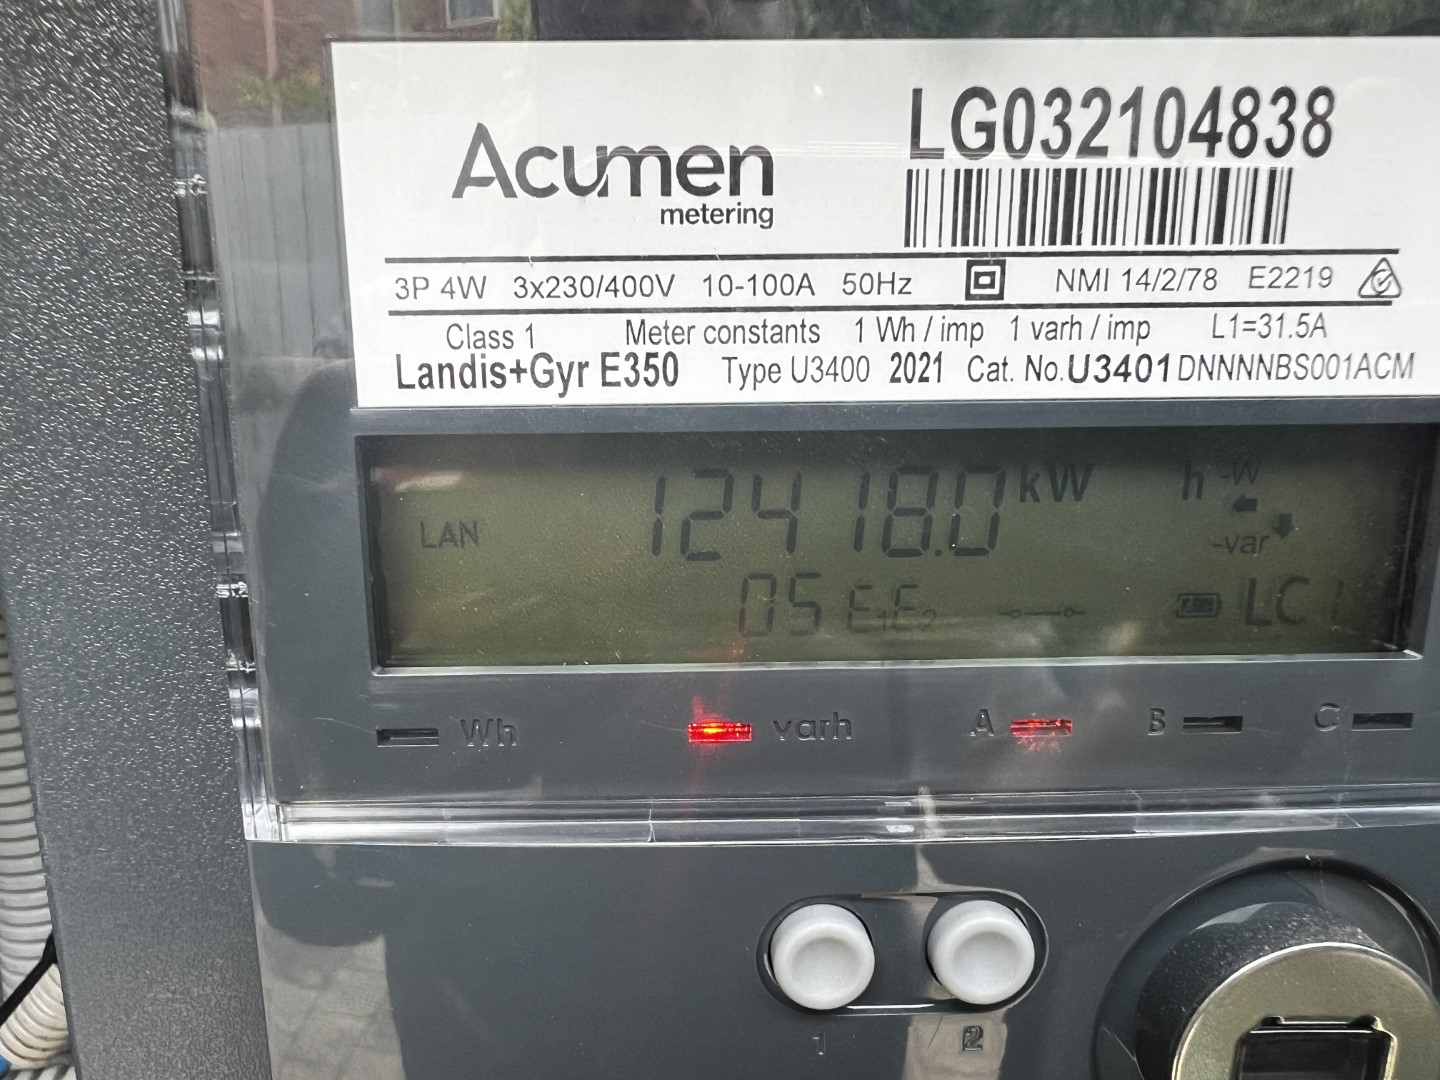
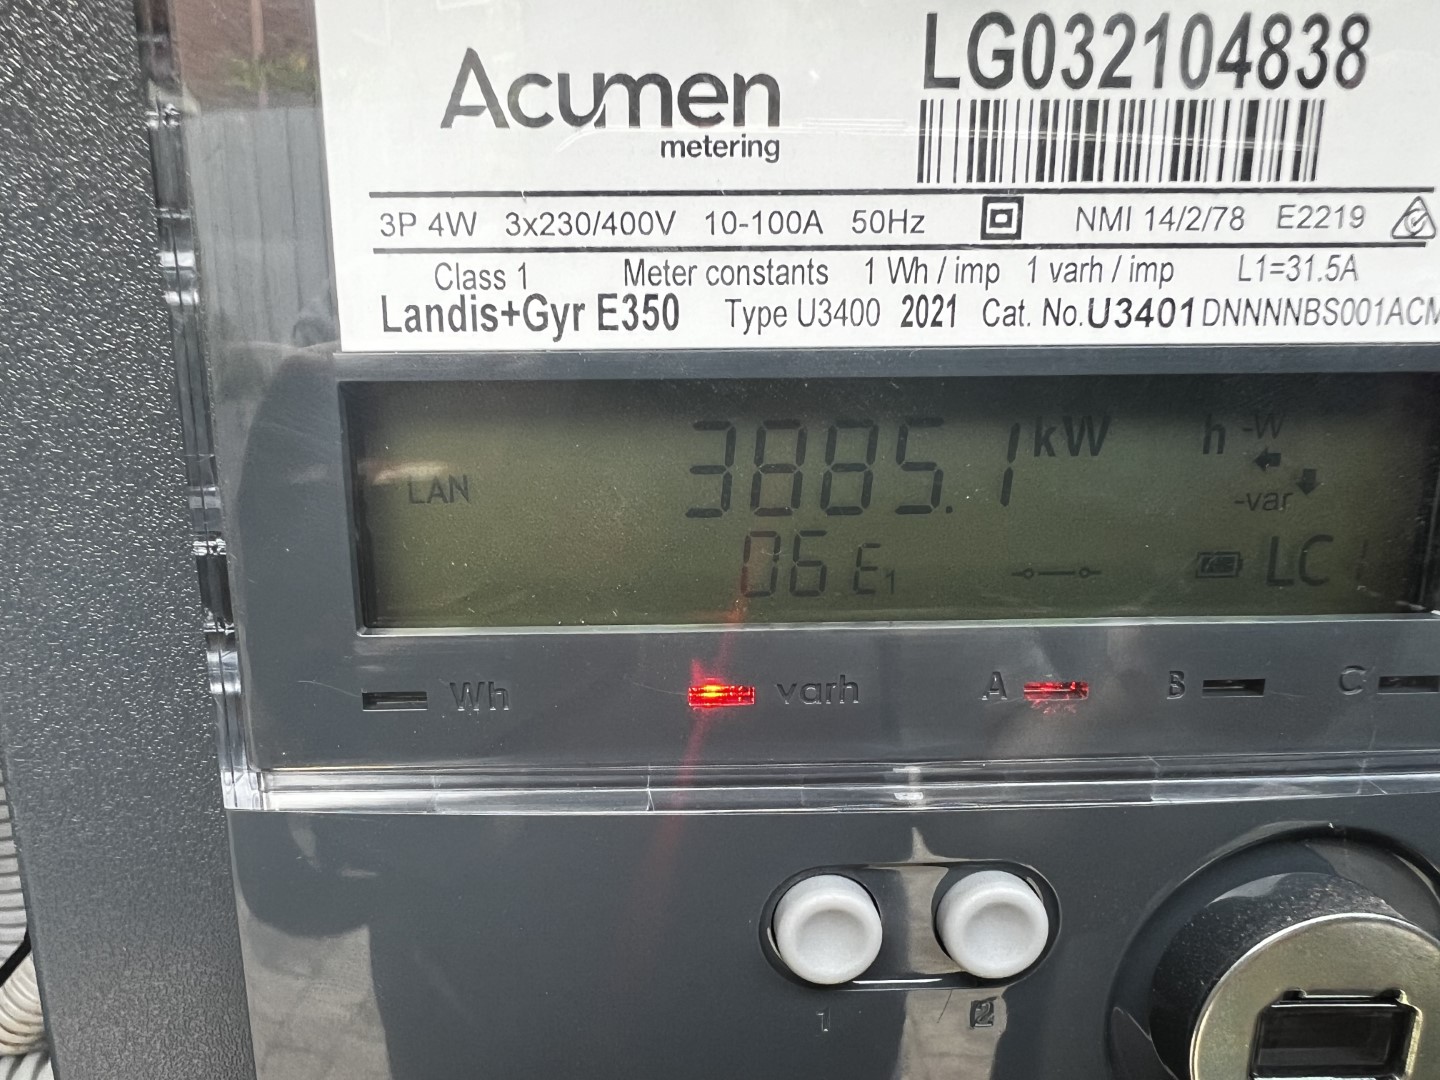
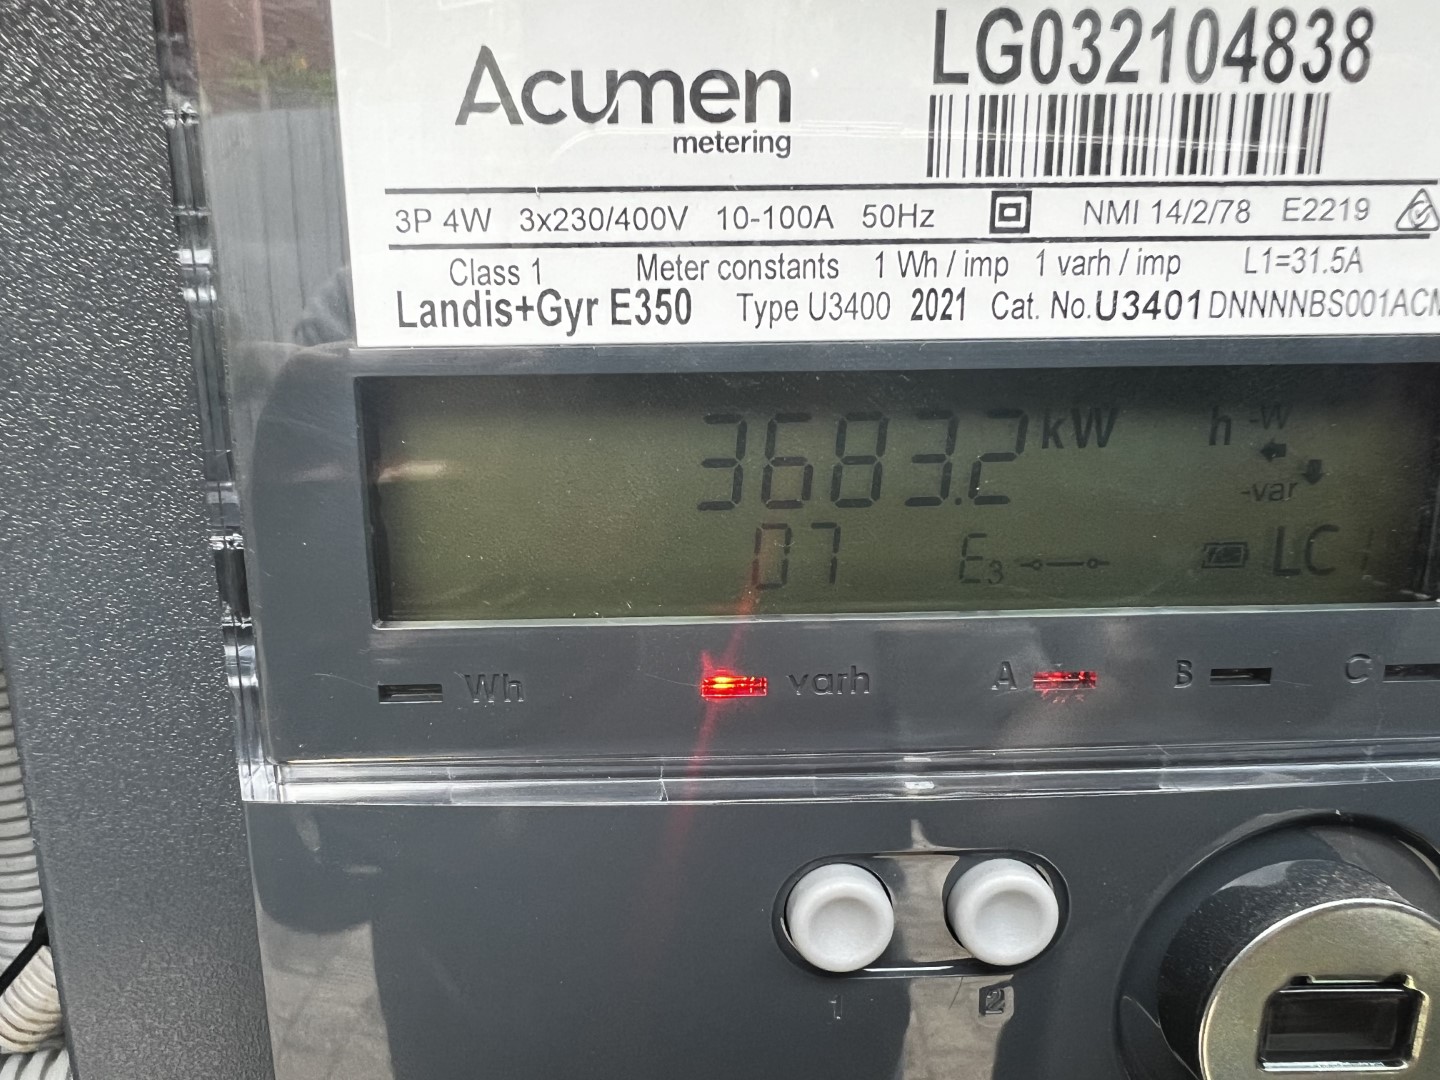
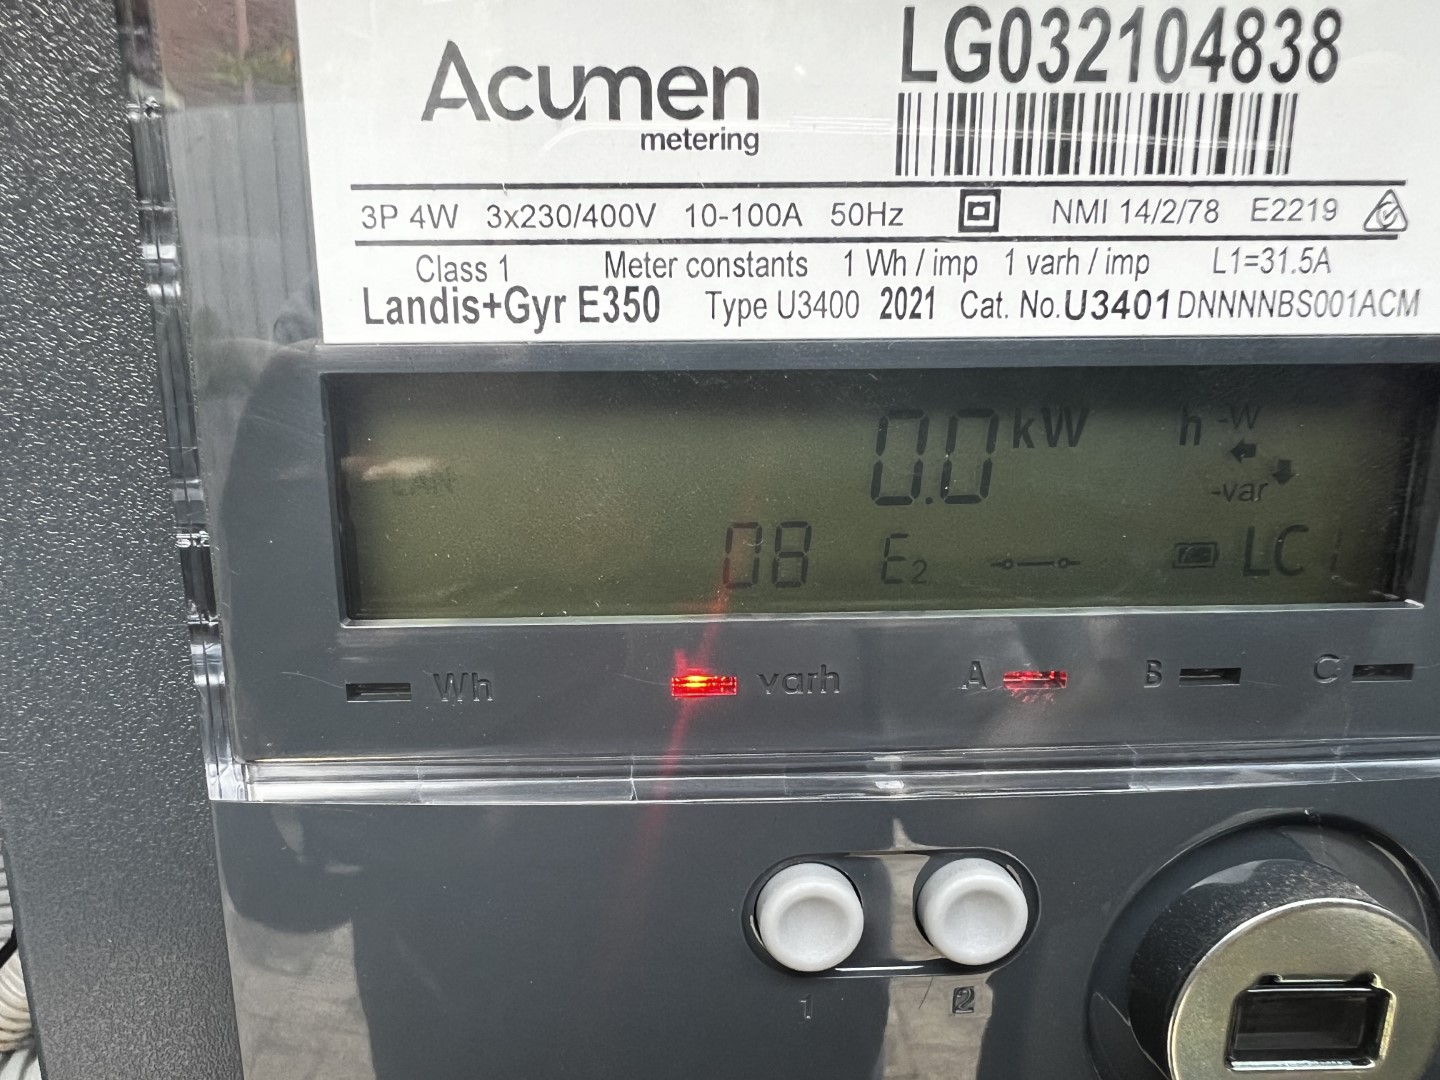
I took the first reading today and will check back in a week. There are 9 displays the meter cycles through, neglecting the first one which appears to be a display check (all segments on) as yet I have no idea which meter display (04 to 08) is which. Hopefully that will become clearer once I get the difference I can compare to the IotaWatt.
Look at the LCD display section. It’s a little complicated, but basically You are looking for displays that have kWh for units. There should be one for import and one for export, which is indicated by the quadrant “p” direction. Pointing left is export and pointing right is import.
If you have an advanced meter (one which records your usage every 30 minutes and sends your data back to us remotely) you won’t be able to self-read your meter. This is because of the way your meter records and displays your usage information. We have your usage data in our system, so you can always call us if you have any questions!
Will have to wait and see what the values are in a few days and if I can make any sense of them.
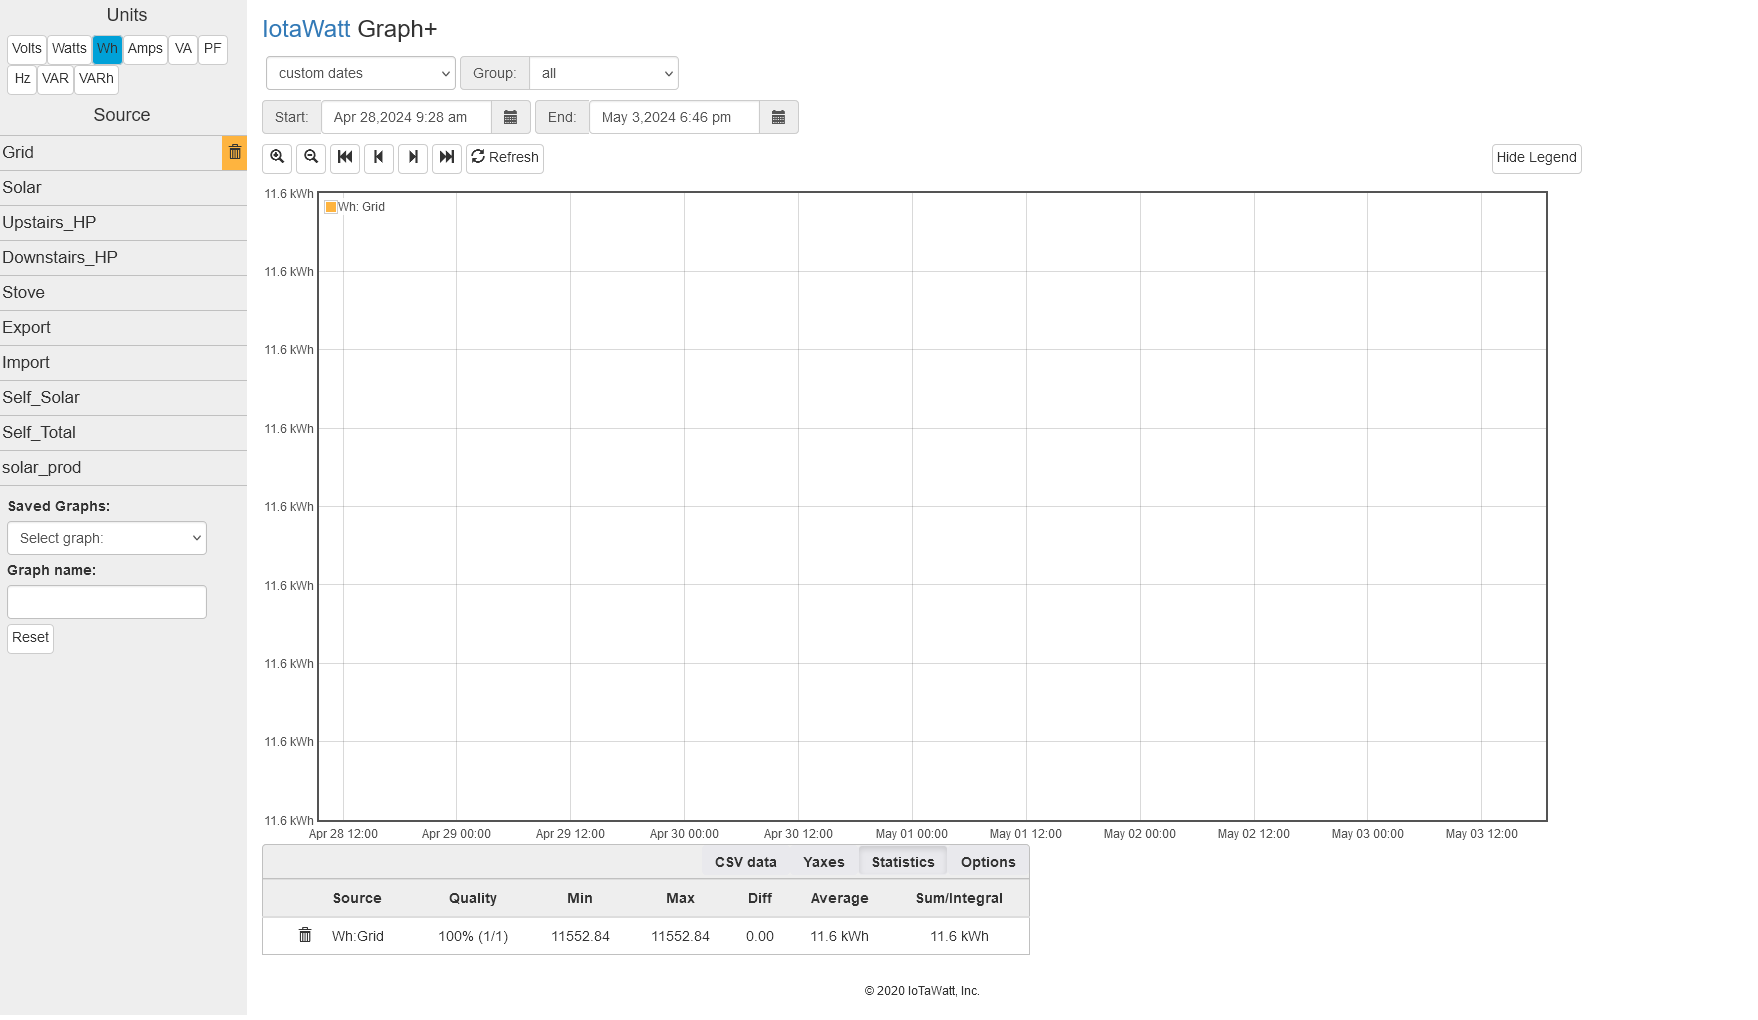
Without getting into what’s going on under the hood, my point is that your meter shows a net usage (import-export) of 13.9 kWh while the IoTaWatt shows a net usage of 11.6 kWh. That net is the result of 179.3kWh flowing bidirectionally through your main and the meter over the course of a week. The meter is probably apportioning every AC cycle to either import or export. The IoTaWatt records the net usage every 5 seconds, based on a sampling of about 10% of the cycles, and then the integrator apportions that net as either import or export for the entire 5 second period. Some variation is to be expected. That’s why it’s called an energy monitor rather than a meter. Your results are certainly adequate to make decisions about your usage and generation, but are not necessarily revenue grade like your meter that has one sole purpose.
Its also worth pointing out that if you hold the IoTaWatt to a +/- 1% expectation vs a class 1 meter with a +/-1% tolerance, the variation is technically +/- 2%.
Another data point would be if your voltage calibration is 1% off, your numbers will be 1% off. I realize you calibrated it with a Fluke meter, but those are typicall 1% accuracy as well. I have a good Fluke, but also several bench DVMs that have recent NIST certifications and I can tell you that the Fluke is not spot on against those.
I guess what I’m trying to say is this is about as good as it gets, I don’t think tweeking a calibration into your output is the solution.