Finally got grafana/influxdb v1 working. I had trouble with the guides I found and stumbled through it on my own. Now that it’s working, I’m trying to figure out if there’s any long term issues with how I’ve set this up.
Running both influxdb and grafana off of an old raspberry pi 3b in docker, along with telegraf and cronograf containers (also have a homeassistant container on there running as my z-wave hub).
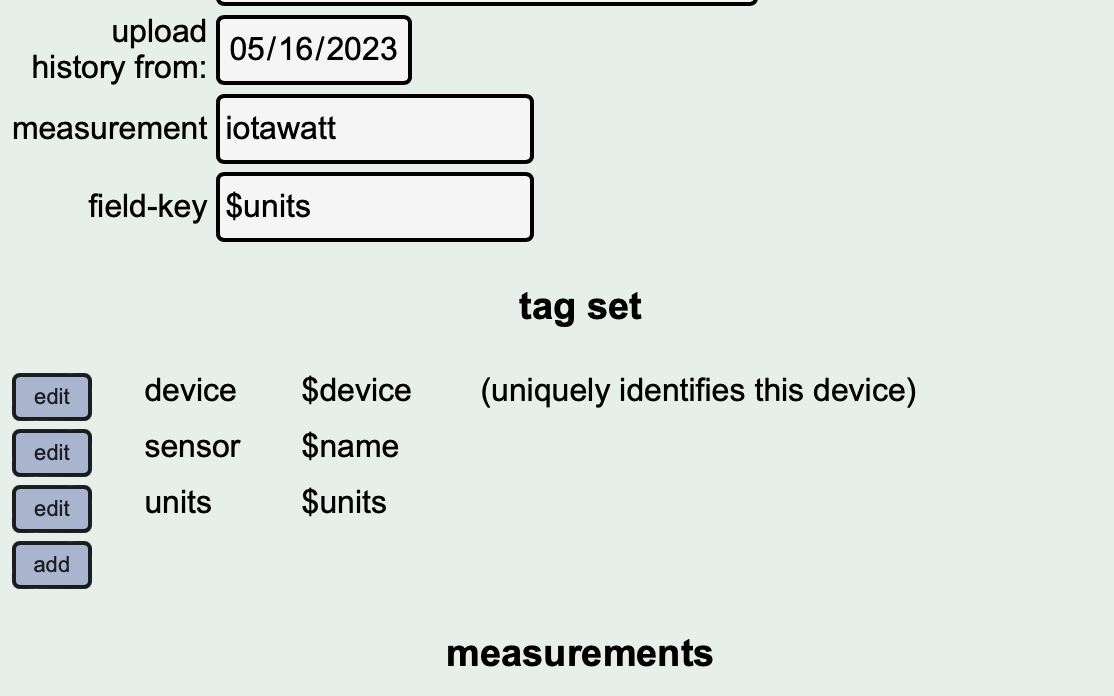
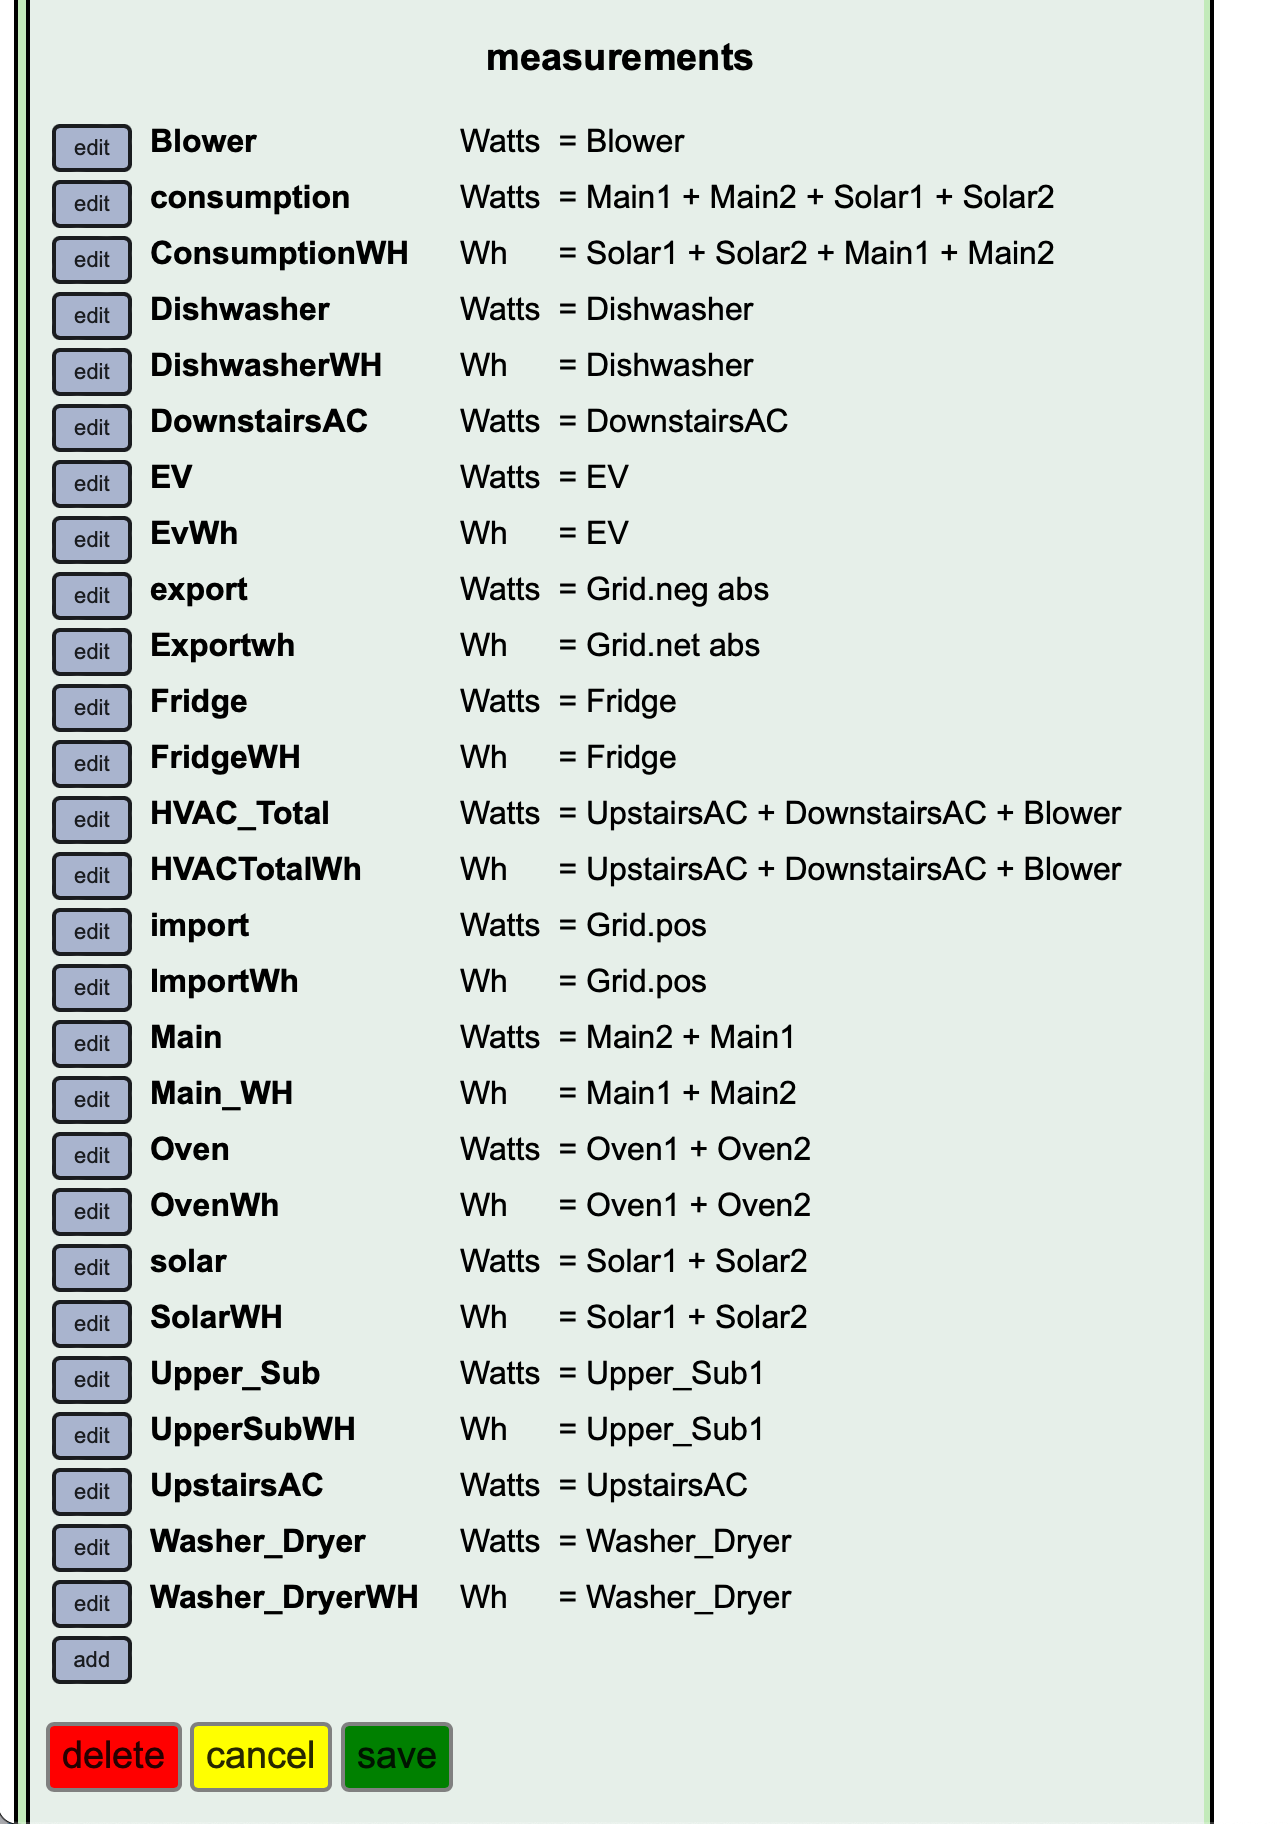
Here’s my influxdb uploader config:
I’ve noticed that the guides seemed to be setting up influxdb so it generated Wh data off of the existing watts input (presumably for space savings/efficency?). I wasn’t able to figure that out, so I’ve just created two outputs for each circuit, one in wh, and one in watts. Good idea, bad idea?
Ideally, I’d like this setup to hold several years of data. I’m debating rebuilding the whole thing on a Pi4 with a bigger SD card, but I’d love to save myself time money and effort if it’s not necessary.
Update: I think I got my answer. I realized I hadn’t tried changing the time scale on my grafana dashboard. If I set it to anything longer than the last day, the pi crashes. I sshed into it, and it looks like the influxdb process is choking the cpu. Not sure if I need new hardware, or just a more efficient system within influxdb.
Probably all of the above.
It is likely your Pi has trashed its SD card. I have a really old 2B that I use just for MQTT. It was getting slower and slower. The filesystem was fairly trashed.
I replaced the cheap SD card with a good one and had it boot to a USB thumb drive.
For InfluxDB and Grafana, I use a mini PC that I got for under $150 (used with a Core i5, 16GB RAM, and a 256GB NVMe SSD). It makes a nice machine for running Docker containers. It uses about 10-11W at idle so more than a Pi and it can jump to 30-40W with a heavy load. But, it is WAY more capable than even the Pi 4, much easier to find and probably cheaper.
So I discovered the dashboard I was using was trying to compile a panel with a bad setting. If I remove that, along with any panels that were using the KwH outputs from the iotawatt, it worked perfectly.
Now I’m trying to find the “correct” way to get that KWH data to grafana. Are you using continuous queries with influxDB? I tried following Beeson’s blog post here, but got a bit lost (my queries weren’t outputting per sensor data, only a lump “iotawatt” measurement that’s pretty useless).
If I reformat the query I can get a single sensor, but I’d end up running a whole stack of continuous queries, and I’m guessing that’s probably as bad as what I was doing before (perhaps I’m wrong and that’s just how it’s done?). The blog post seems to imply two queries will dump all of his CT data out as KWH measurements, but I’m not able to make that work. I’d like to solve this before I consider rebuilding the whole platform so I at least know how to set things up right.
RE an upgrade, my other option is my home built NAS server. I let it sleep 90% of the time, so I’d rather not leave it running, but I could? It’s got some kind of intel celeron CPU that’s literally soldered into a board, weird thing, but I’m sure it’s performance is well above any PI.
Ultimately, you need to decide what you are trying to achieve and then figure out how to do that.
It took me years to get around to setting up Iotawatt to InfluxDB. Part of this is because there isn’t ONE right way to do it. Part of it is because I wasn’t sure what I wanted. I am still not really sure about that.
Think about the graphs you want to be able to see and why. Think about the different choices you might make based on the data you will be getting.
I graph my HPWH usage and use the data (a long with other data) to adjust control systems (like the one that runs my recirculating pump) and set the tank temperature. Tracking power usage (and other information) made it clear that after 5 years my HPWH was no longer working efficiently. That enabled me to get it replaced before it totally failed.
I also use similar data to control my dehumidifier and adjust the control I have for it.
So, really think what you are going to do with the data you are collecting.
I know what you mean. It’s a ton of options. I think I solved most of my problem by moving my setup to a proper server instead of a PI (less fiddly about efficiency). Stuck on figuring out a proper method for doing monthly graphs. For some reason I input the same w ->kWh conversion on a bar graph, and it gives me wacky numbers. Not sure what that’s about.