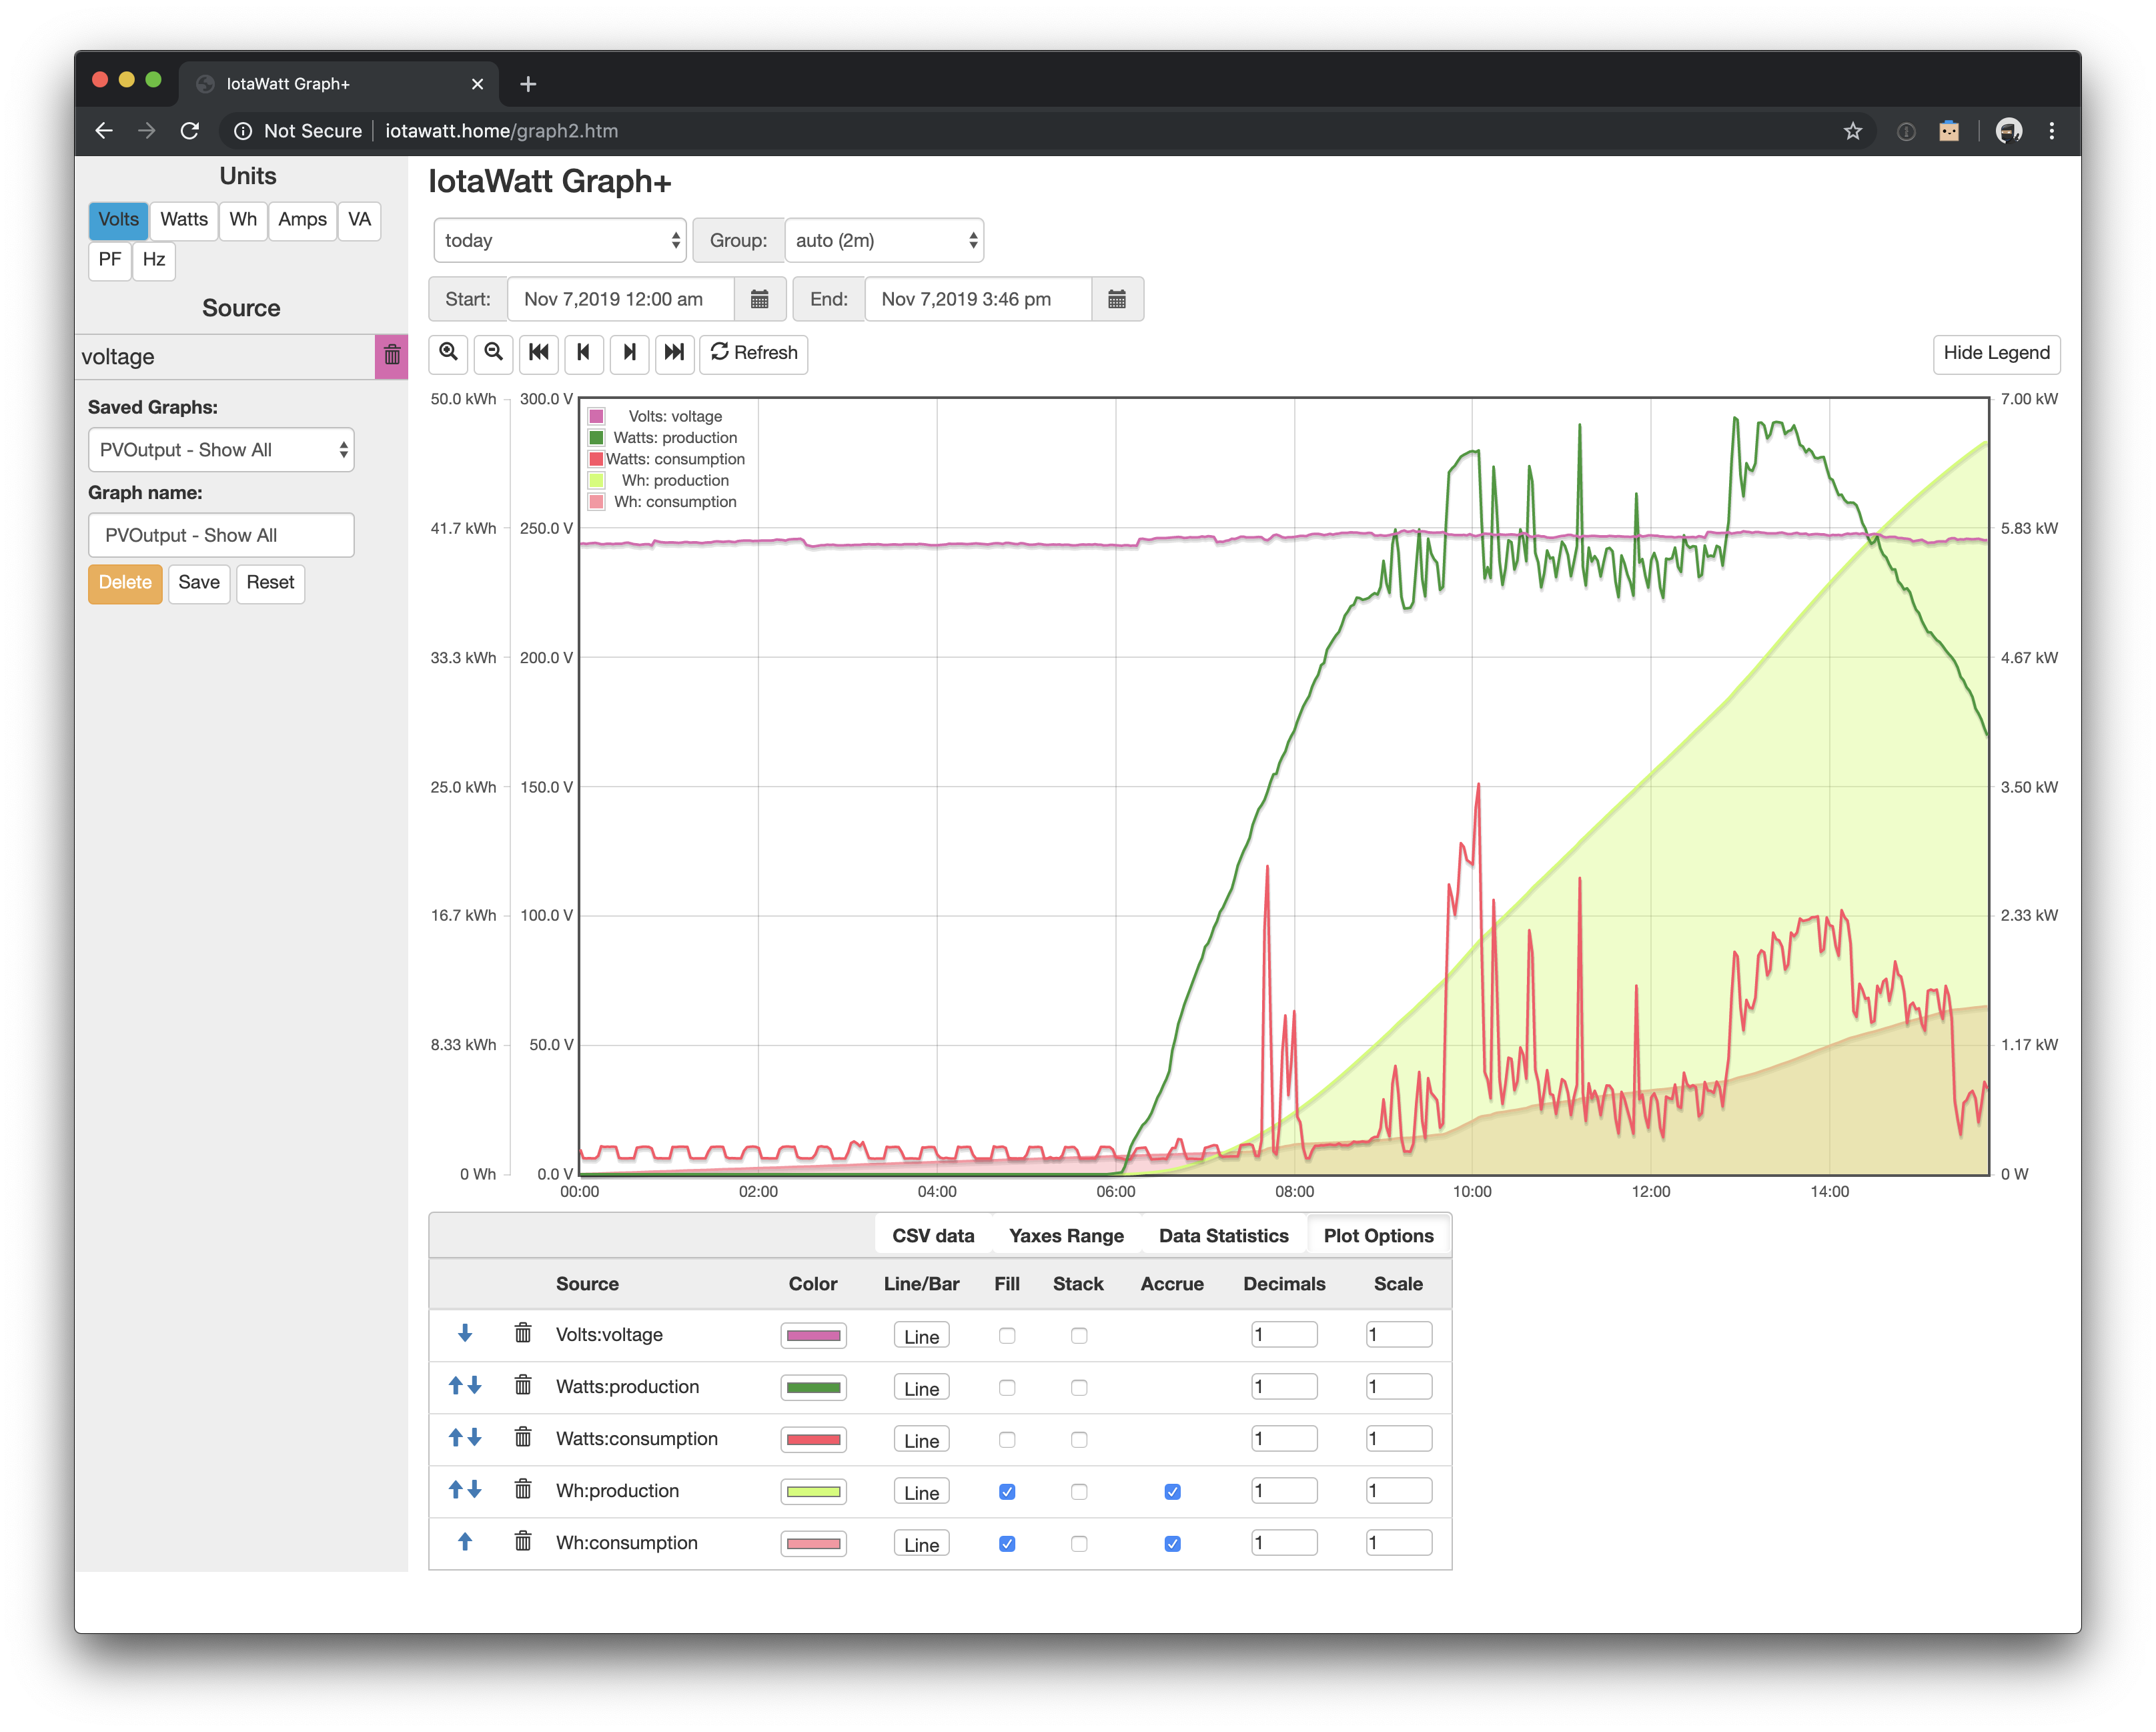
Here’s my actual configured output: Watts = ((fronius_inverter max 0) + (latronics_inverter max 0) - 5000) max 0 – this is working fine and I can produce a Watts graph line which you can see in the screenshots above.
But I’m unable to graph Wh at all. Our export limit is 5kW (per hour), not 5kWh (per day). So if I’m able to produce 7kW at midday, and I’m using 3kW at midday (for AC, washing machine, dryer, etc.), then I’m getting 2kW “free” and “paying” for 1kW with a foregone feed-in-tariff.
The graph above IS showing me the total Wh in the data statistics section (for the Watts graph line), but the Wh graph line just shows 0.
Here’s another screenshot from a different graph that also shows my regular production output can be visualised as both Watts and Wh (via accumulate):
For clarity, here’s all my outputs:

UPDATE: Strangely, I was checking a bunch of different time periods (this week to date, last week, month to date, etc.) and when I got to “last 4 weeks” it started actually showing something for the Wh graph line:
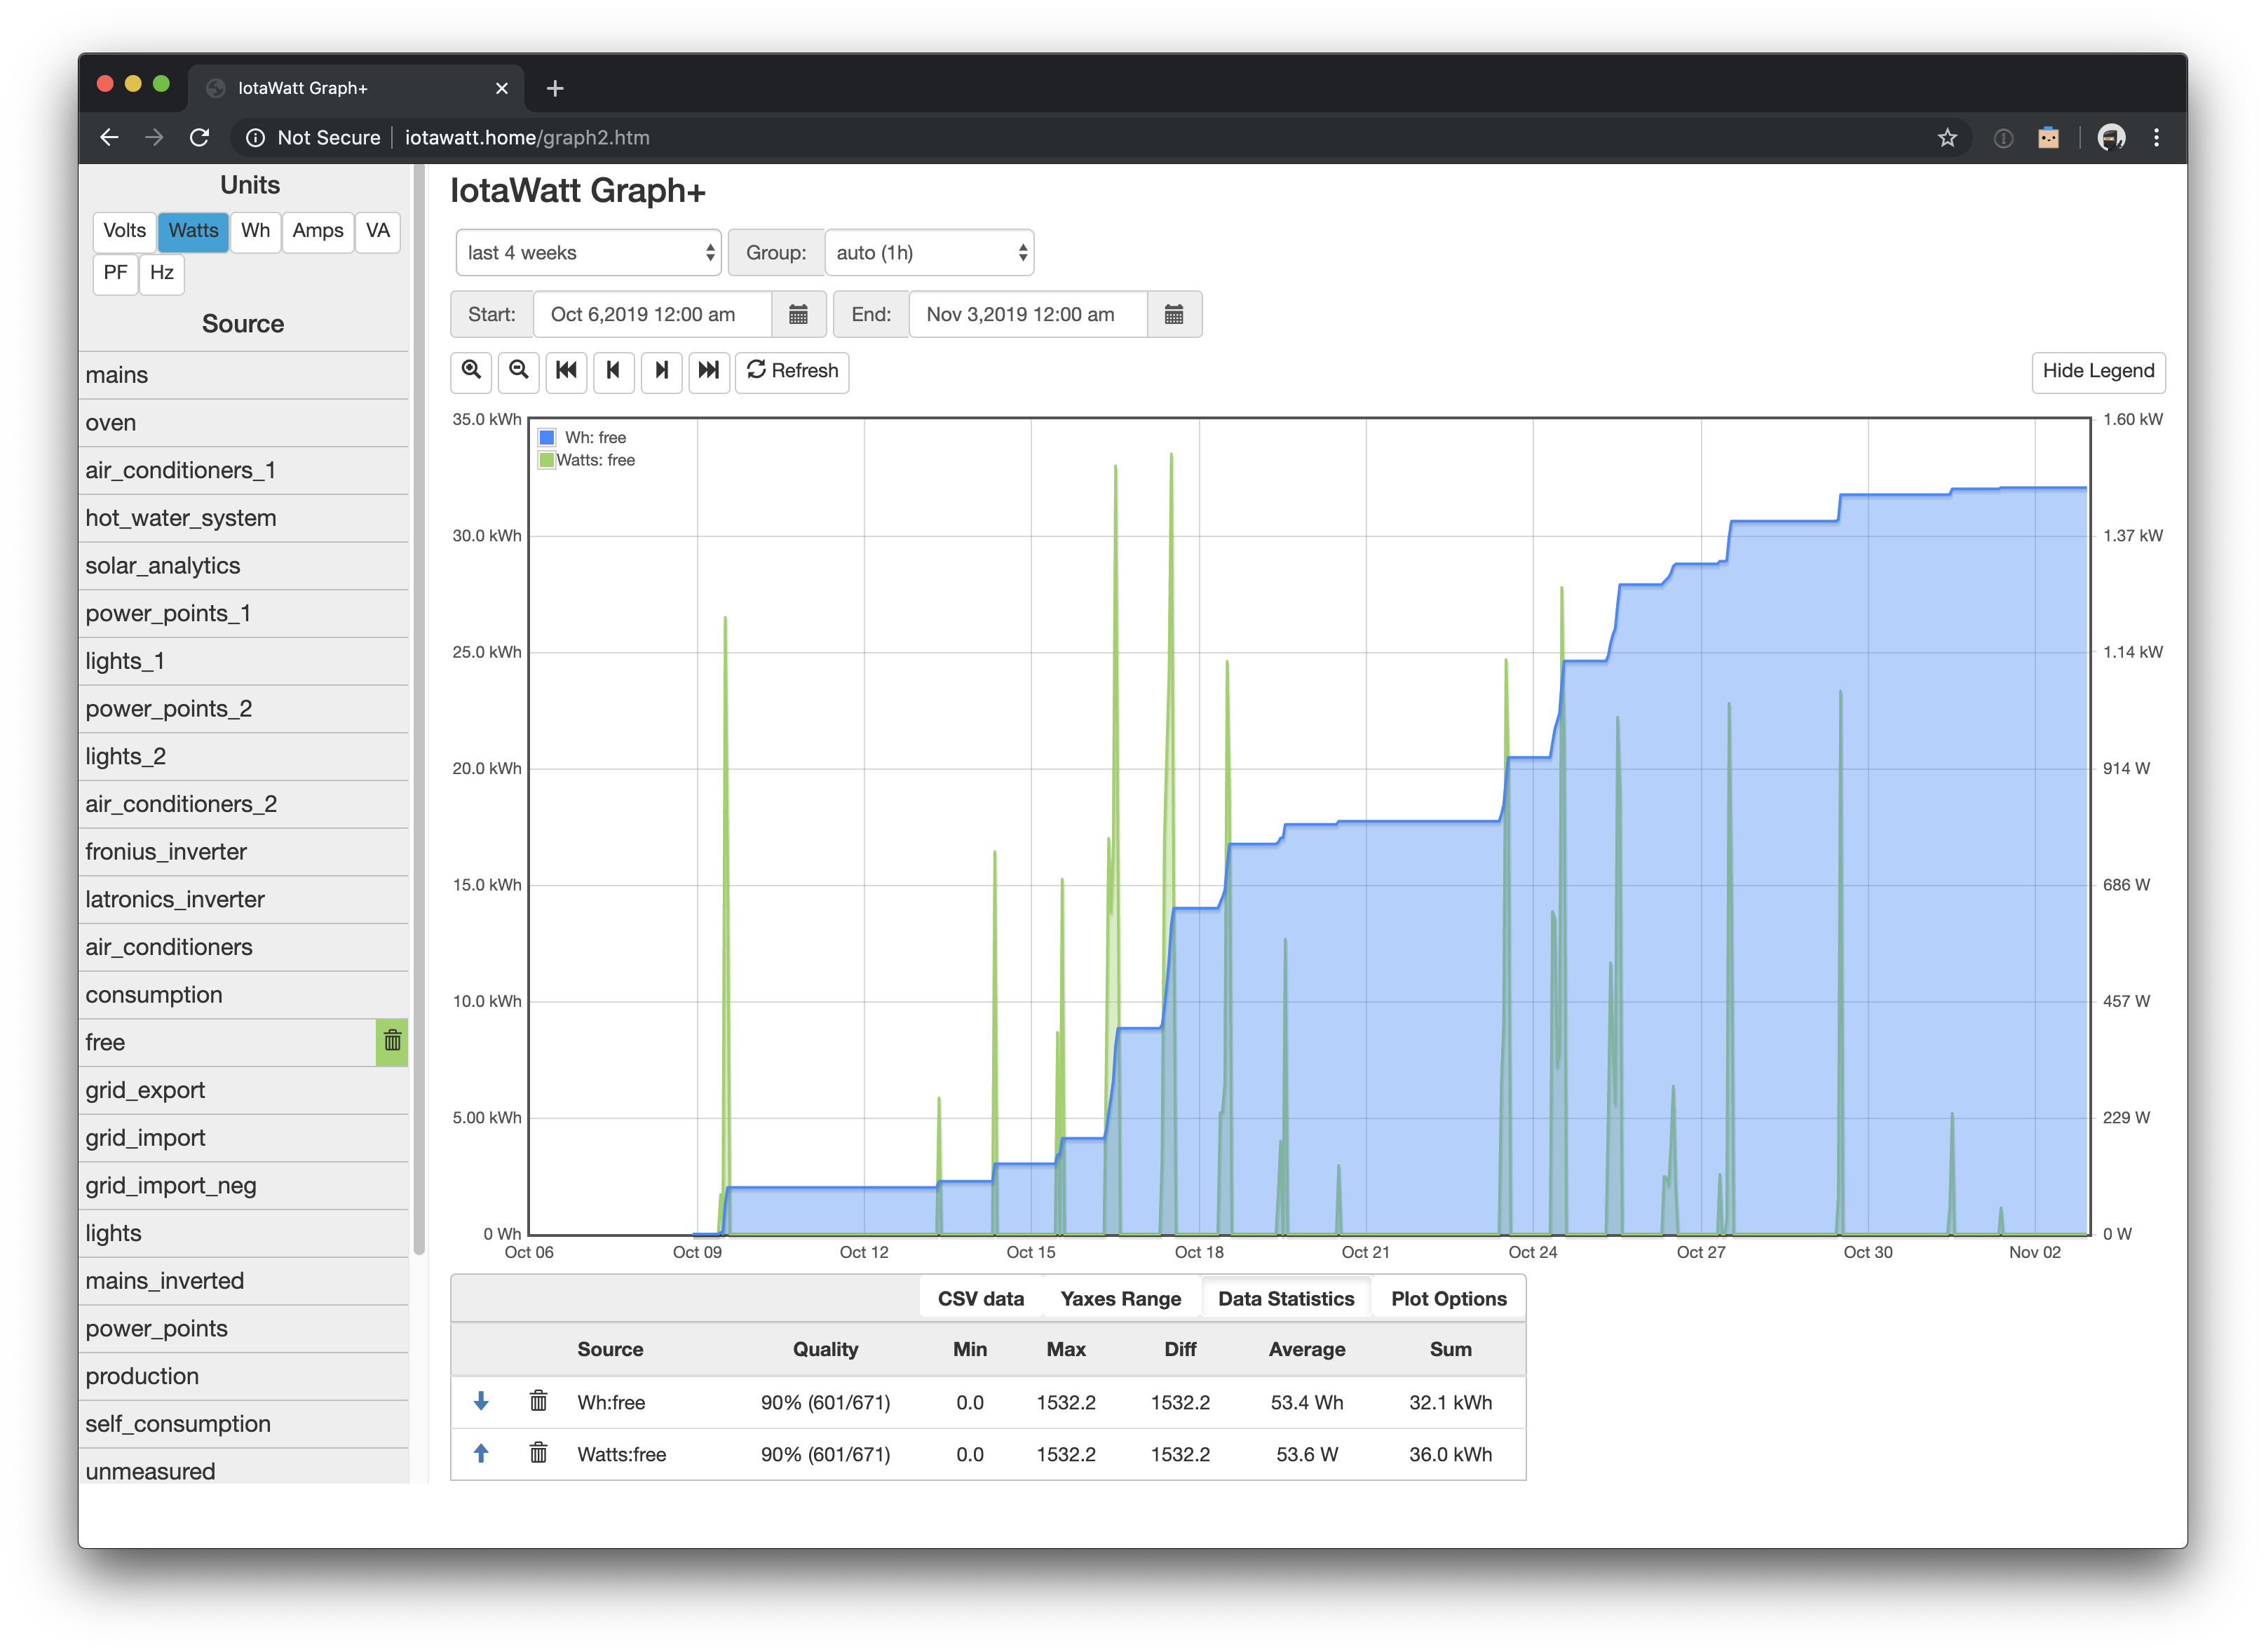
But I’m also not sure if this is actually showing accurate data at all. If I Choose “last 6 months”, even though I only have historical data going back about 1 month (to 9 October), it says the sum of all free energy is 677kWh, even though the last 4 weeks shows only 32kWh (and that’s probably wrong too).
