I added a new output free as (production - export limit) max 0 to report on the amount of totally free power we are using, because we have a 7.25kW system and a 5kW export limit.
This works great. In Graph+ I can go back in time and see a power (W) line for our free usage for all of my existing historical data.
But when I add an energy (Wh) line, it just displays 0 both for historical periods and for the time since adding the output to IoTaWatt config.
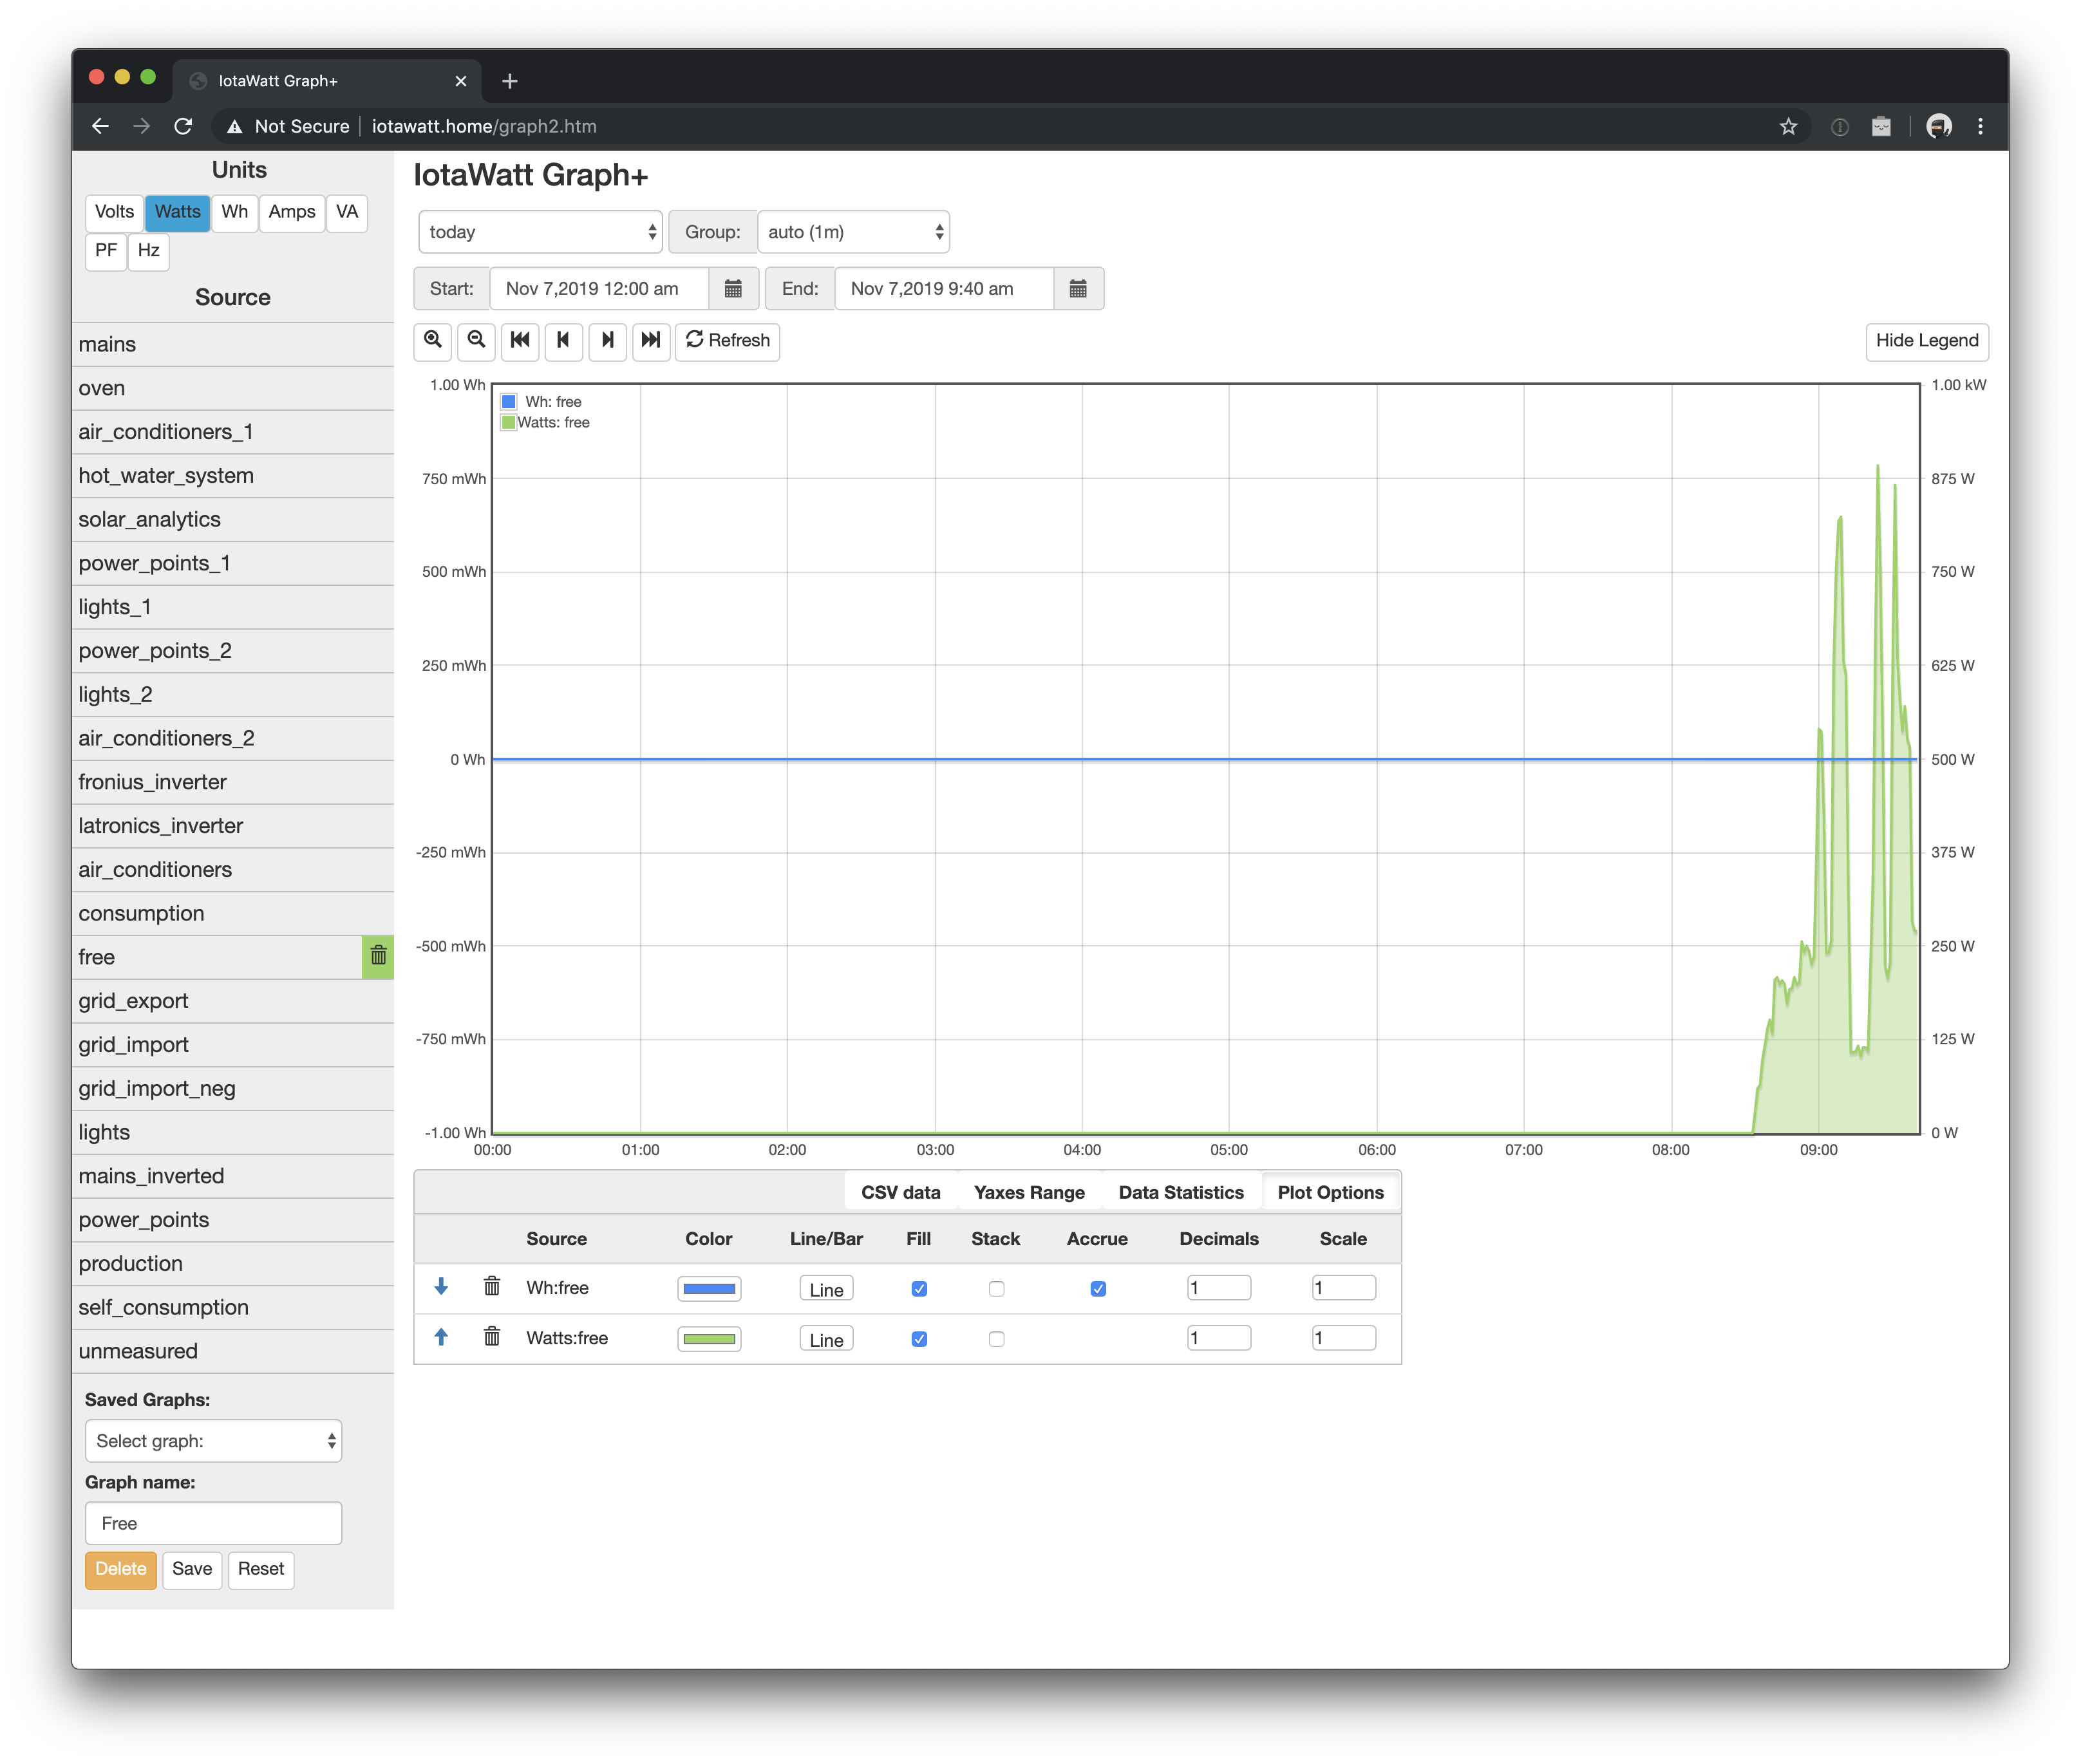
Here’s my actual configured output: Watts = ((fronius_inverter max 0) + (latronics_inverter max 0) - 5000) max 0 – this is working fine and I can produce a Watts graph line which you can see in the screenshots above.
But I’m unable to graph Wh at all. Our export limit is 5kW (per hour), not 5kWh (per day). So if I’m able to produce 7kW at midday, and I’m using 3kW at midday (for AC, washing machine, dryer, etc.), then I’m getting 2kW “free” and “paying” for 1kW with a foregone feed-in-tariff.
The graph above IS showing me the total Wh in the data statistics section (for the Watts graph line), but the Wh graph line just shows 0.
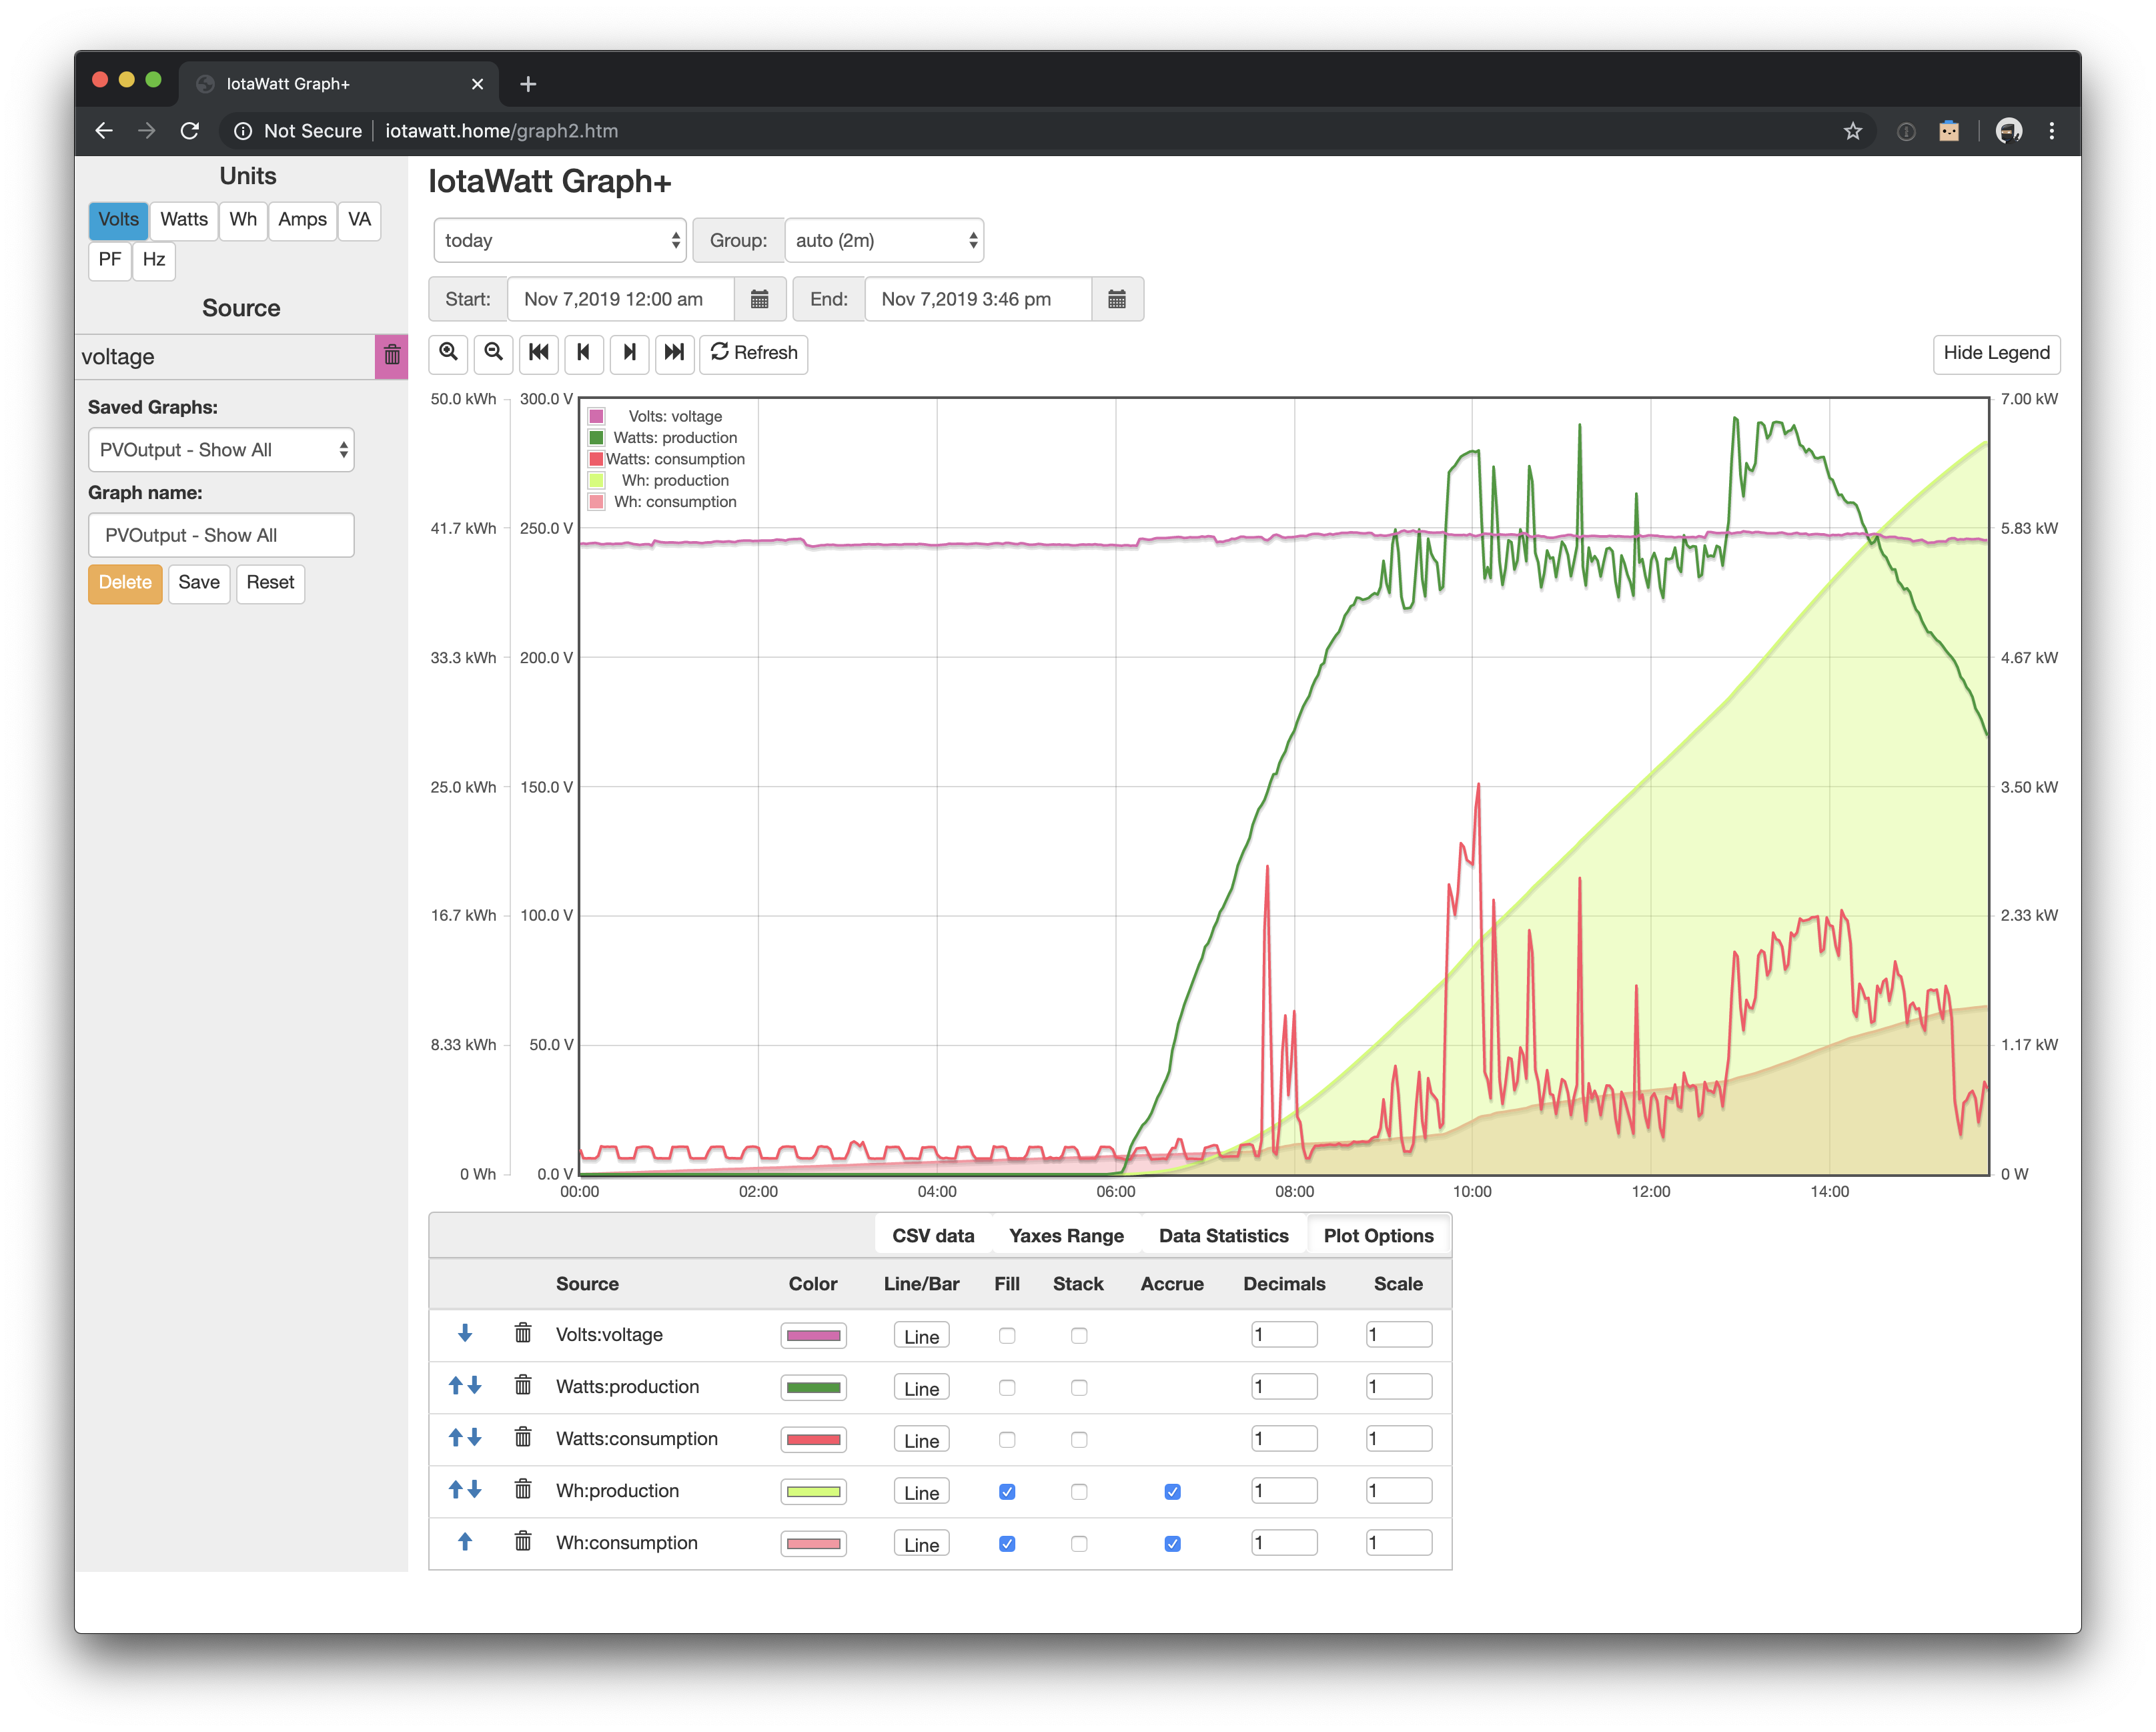
Here’s another screenshot from a different graph that also shows my regular production output can be visualised as both WattsandWh (via accumulate):
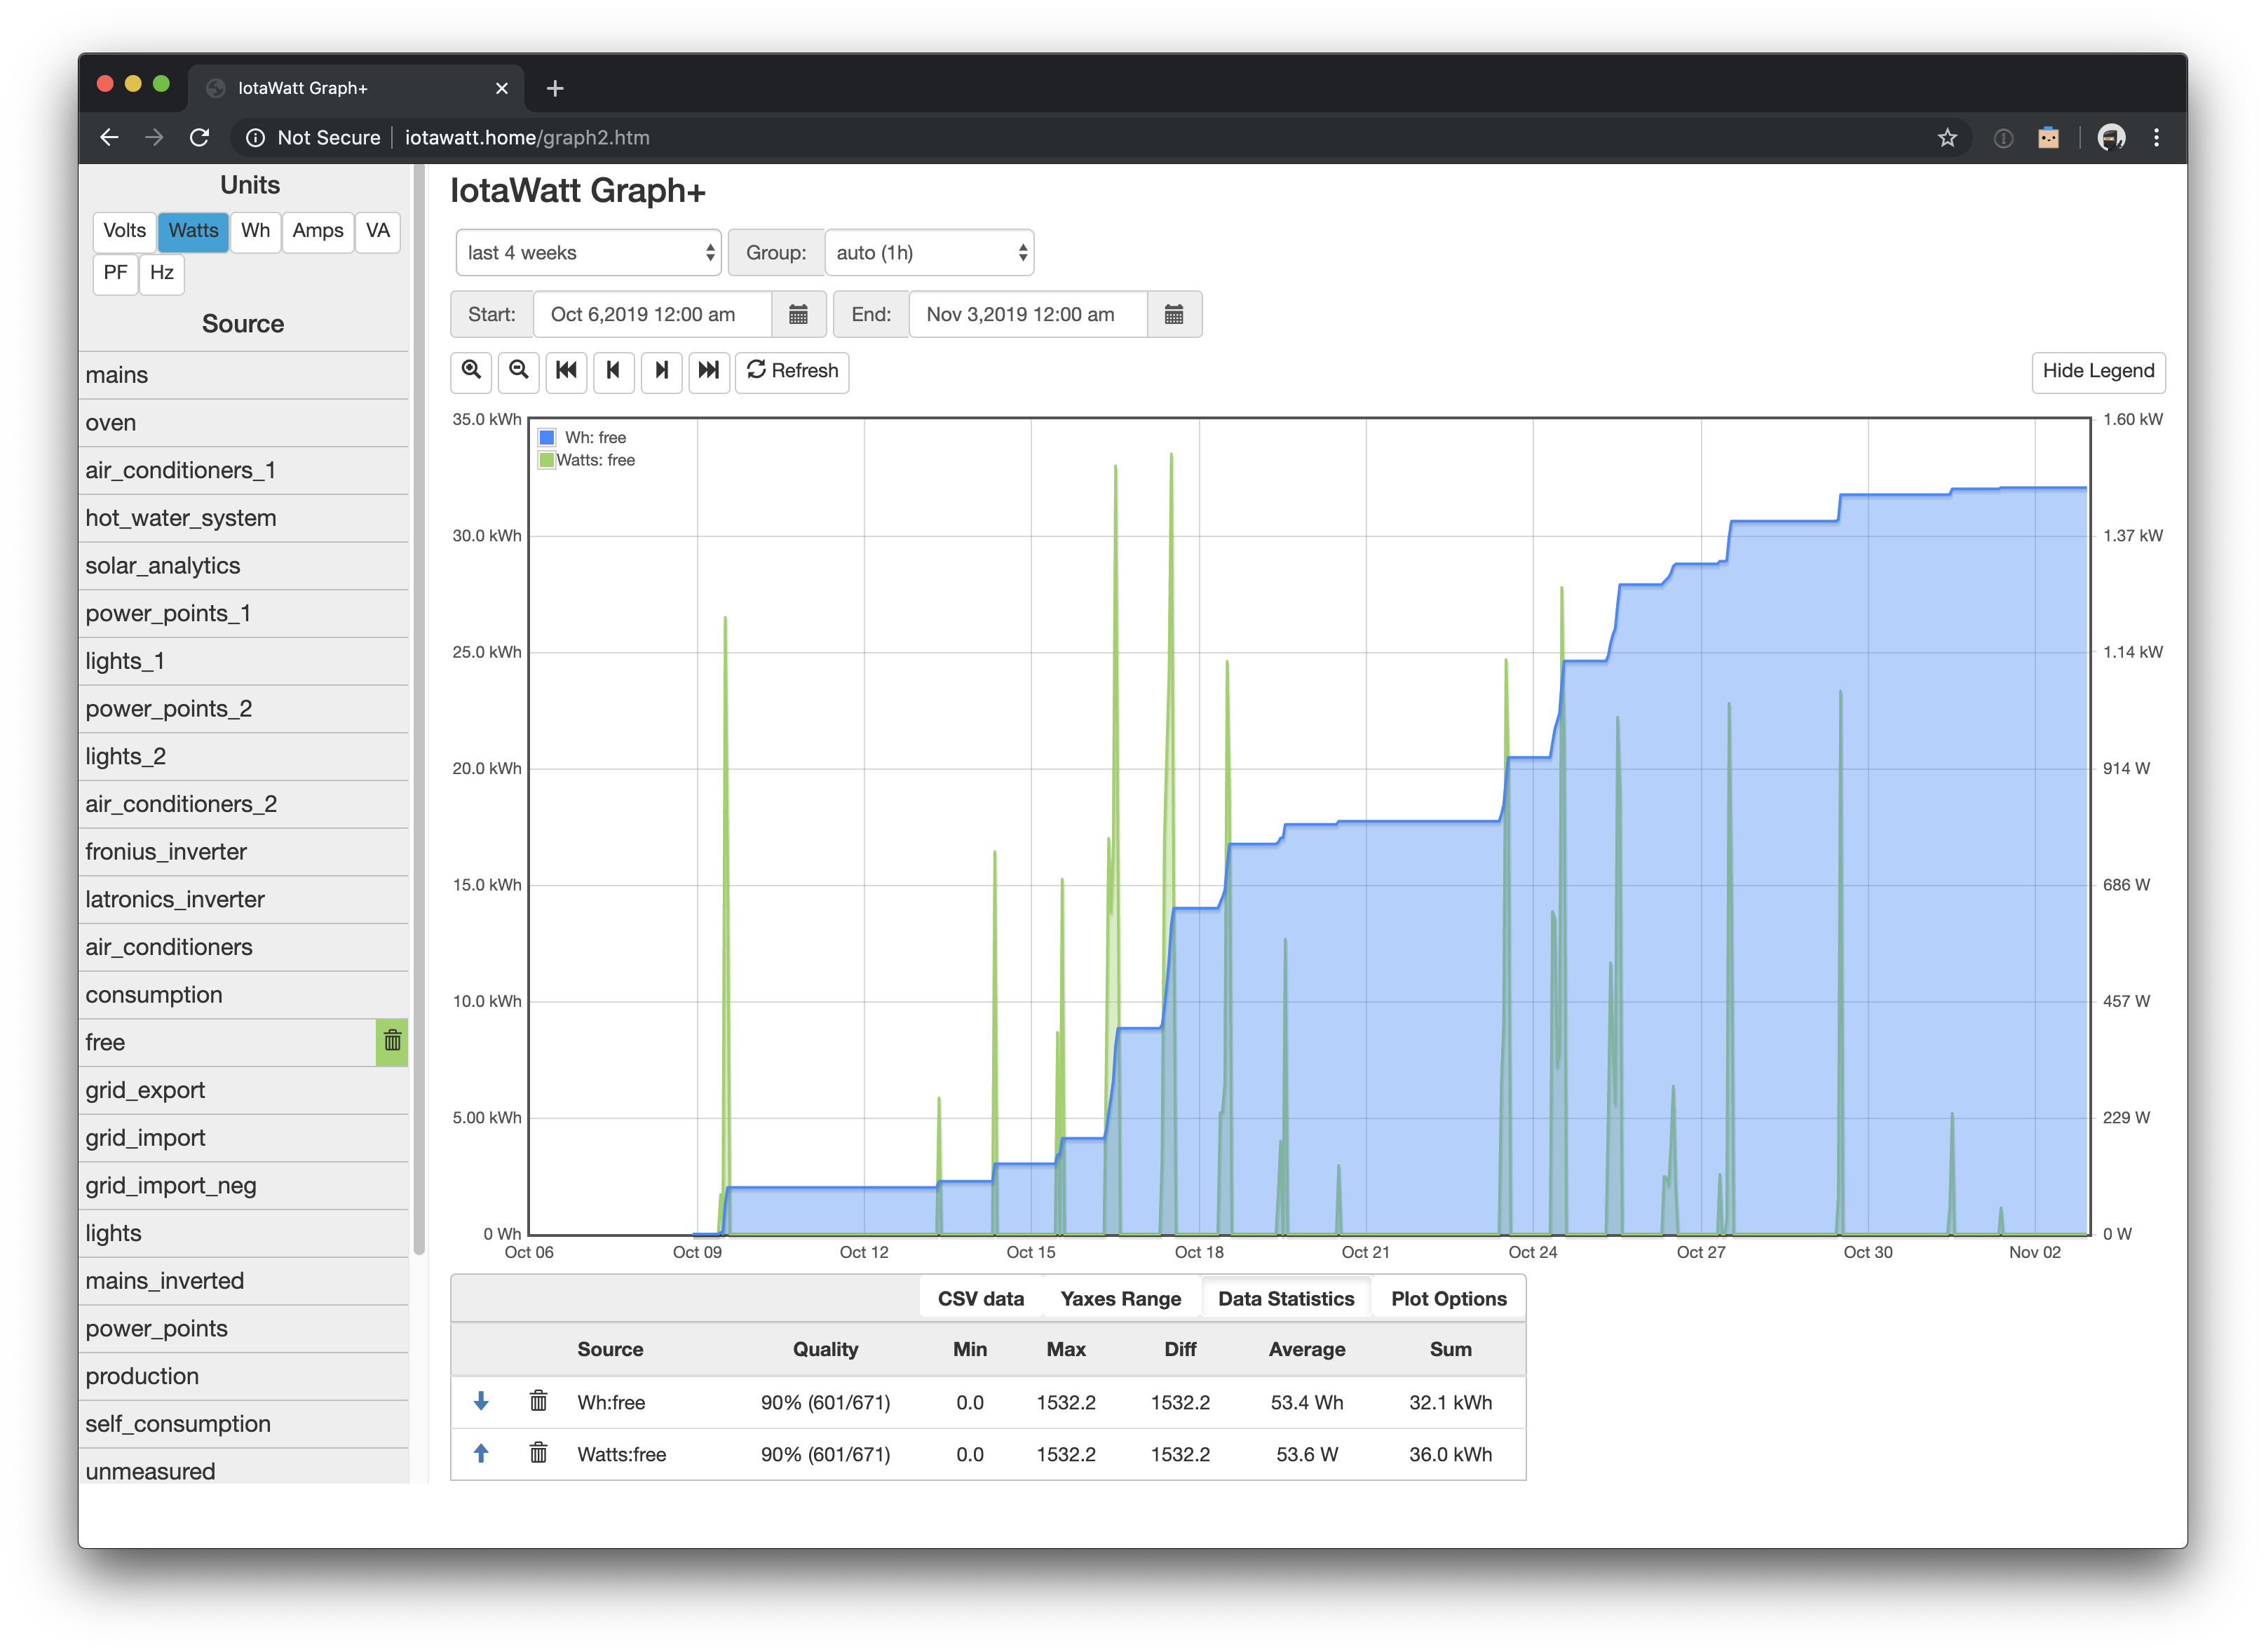
UPDATE: Strangely, I was checking a bunch of different time periods (this week to date, last week, month to date, etc.) and when I got to “last 4 weeks” it started actually showing something for the Wh graph line:
But I’m also not sure if this is actually showing accurate data at all. If I Choose “last 6 months”, even though I only have historical data going back about 1 month (to 9 October), it says the sum of all free energy is 677kWh, even though the last 4 weeks shows only 32kWh (and that’s probably wrong too).
Let me start by trying to answer the question in the post heading.
For a Watts series, Graph+ integrates the Watts data points and makes that total available in the statistics line.
For a Wh series, Graph+ adds the Wh of all the data points and makes that total available in the statistics line.
I’m having a little trouble wrapping my head around this “free” concept, so bear with me.
If I understand what you are saying, your meter will only credit you for exported power below 5kW. So that is probably more-or-less instantaneous power. If you export 6kW for 30 minutes, then 4kW for 30 minutes, do you get credit for 4.5kWh? What about if it’s 6kW for 30 seconds and 4 kW for 30 seconds, is that 75Wh? That’s how I imagine it would work if the meter is simply “governed” at 5kW export.
Moving ahead with that assumption, you really need to be graphing a short enough time interval where the export watts are representative of the whole sample time. Maybe 1 or 2 minutes will work reasonably enough, but I doubt 1 hour is accurate on a partly cloudy day. 6 hours is definitely not going to work.
Now to Graph+ resolution and what you are plotting. In the this graph:
the Watts:free is the excess watts above 5kW each minute. Reasonable enough, and I think the plot is probably reasonably accurate. But the Wh:free is a different story.
When you select an output series in Graph+, the units under which you select it override the default units specified in the original output definition.
So unlike when you plot free under Watts, where you get the excess Watts above 5000, when you plot that output under Wh, you get the excess Wh above 5000. In the case of the graph above, the Watt hours for a 1 minute interval are tiny, and never exceed 5000, hence the zero flat-line.
As you increase the length of the interval, the Wh in each increase as well, until you reach 5kW, as in the last 4 weeks plot where the interval is 1 hour. There, Wh = watts, so if you average 6200W generation in a one-hour interval, that would be 6200 Wh and the “free” portion would be 1200Wh. That same 6200W for one minute is 1/60 of that or ~103 Wh, which isn’t more than 5000 and thus comes back as zero.
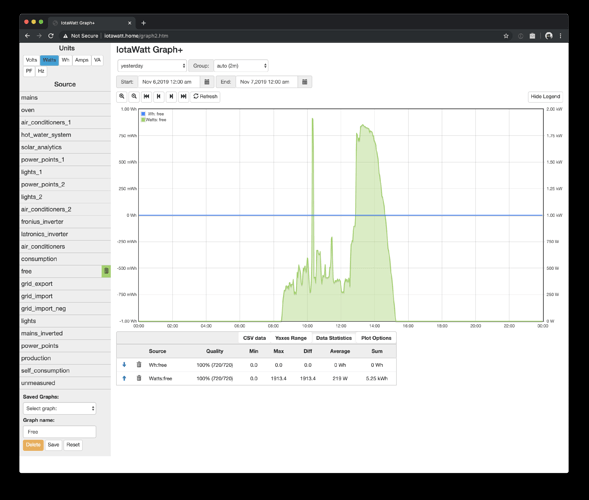
I don’t see a way to plot those “free” Wh, except to plot it with fine resolution of 2 minutes or less (~24 hours) and look at the integrated total Wh in the statistics line as in this graph for “yesterday” where I believe the 5.25 noted in the statistics section is reasonably accurate.
I haven’t fully digested your post yet, and I will re-read it again soon. But I just wanted to correct your assumption as it may have a bearing on the rest of your post. When the meter reports that we ar exporting more than 5kW instantaneous power it tells the inverter to ramp down production to stay under the limit. We do not export more but only earn credit for 5kW. We never export more than 5kW. But if we are consuming power in the house, eg aircon is running, the inverter may produce more than 5kW power. That is “free” because we are able to produce and use it while still exporting the maximum 5kW, with no foregone feed in tariff.
I suppose I don’t see how this output which is a combination of inputs via the calculator, which is plotted as Watts fine, cannot be plotted as Wh with accumulate option checked. I do the same thing for both production and consumption outputs in my version of the default PVOutput graph.
It’s a difference without a distinction. Whether it exports an extra 1kW which doesn’t get credited, or just doesn’t produce it in the first place doesn’t change my comments.
After you digest what I write, you will see that the difference between the PVoutput replica and the “free” graph is that you are subtracting a constant from the series value. When the units are Watts, you are subtracting 5000 Watts, when the units are Wh, you are subtracting 5000 Wh. The interval in a daily plot is 2 minutes. You can be producing more than 5000 watts during that 2 minutes, but you won’t produce more than 5000 Wh. It’s apples and oranges.
Thanks. I think I understand now. When you choose to graph Wh instead of Watts, each input used in the output formula (via calculator) is converted to Wh before the calculation is made?
So when I have fronius_inverter + latronics_inverter - 5000 it’s going to give me the Wh sum of the two inverters, less 5000Wh.
I had assumed that the raw input value (Watts) would be used in the calculation, and that Graph+ would do the conversion of the final value to Wh.
Graph+ does already seem to do this conversion across the plotted data points in the data statistics section. E.g. a power graph showing instantaneous power (Watts) throughout the day will list the total kWh for that day in the data statistics section.
If this is correct, could IoTaWatt not perform the same calculation on any hard coded values (5000W) in formulas to convert them to Wh so that Graph+ can then plot the data correctly?
Actually it’s the other way around. IoTaWatt stores cumulative Wh and converts that to Watts when requested by dividing the delta Wh by the time of the interval.
Thats a slippery slope. Power channels can be expressed in Watts, Wh, Amps and VA. At some point you cross the line between a measurement device and an analytic engine. The new query allows you to get the data in json or CSV format where it can be transformed to suit your needs.
That would require exporting all the data and graphing it all in an external tool, when Graph+ already provides 99% of what is needed in a really nice interface and granularity.
I can certainly appreciate the argument, and the fact that providing a raw data export allows infinite possibilities in 3rd party systems, and that wanting to graph consumption in excess of an export limit may be an edge case, but it does seem (to me) to be a bug and not too far down the slippery slope of becoming an energy management system, that the calculator allows hard coded numerical constants to be calculated in outputs and not account for those in any way in the included Graph+.
Or to rephrase, the calculator already applies a conversion process to inputs in calculator formulas but does not apply the same conversion process to numerical constants.
That said, I’m not aware how trivial the conversions are from Wh to Amps and VA, and I suppose that these should also be supported as they can also be graphed from the same Watts output. But presumably the conversions are already being done for the non-constant values (inputs) in calculator formulas.
Alternatively, could the calculator gain another function to represent the interval, so that I can convert the constant of 5000W into Wh myself in a separate free_wh output?
I appreciate that you are trying to do a lot of interesting things with Graph+. The problem with adding esoteric functions is that they invite others, make the tool look overly complicated and require
documentation.
What you are trying to do is better accomplished by exporting the data to an analytic engine. Emoncms would allow you to define a feed of this function, and influxDB can do the same with a continuous query.
This is a better solution for the reason I described earlier: the algorithm breaks down when the time period exceeds about a day. The external databases would be accurate over any period of time.
Just FYI, I’m now trying to setup InfluxDB, but I am finding it is a massive learning curve compared to Graph+. Even attempting to follow 3rd party step by step guides (first in getting data from IoTaWatt into InfluxDB, and then in how to make meaningful graphs in InfluxDB) is a LOT to take in.
Outputs are simply scripts that operate on data in the datalog. The scripts are run at query time against the current log. At the present time, outputs are not stored anywhere.
There is a category of data that requires integration at fine granularity to be accurate. Currently that applies to solar export and VARh. I am working on developing a strategy to be able specify special scripts that I call integrations which will be calculated and stored in an expanded datalog on the ESP32 and possibly retrofitted to the ESP8266.
As above, they are not stored, but to clarify, the 5 second data is retained for a year, but 1 minute data is stored for 10 years. Actually there’s still quite a bit of space available on the 8GB SD cards used in the V5 (V4 is 4GB). The ESP32 is using 32GB of level 10 MMC SD storage.
I’m having an issue with a circuit breaker that is intermittently tripping. When I look at the amps in Graph+ I see a spike that is below the amp rating of the CB but with the 5 sec averaging, I don’t know if it is spiking above.
It would be nice to have a MAX function in Outputs so you could record the maximum value seen during the 5 seconds.
That’s not possible as the best resolution from the datalog is 5 second averages. But looking at the problem from a different angle, breakers are supposed to have a 25% safety margin, and so I believe the code (that’s US NEC) calls for the load to be 80% of the breaker capacity. So for instance the maximum load you should sustain on a 20A breaker is about 16 Amps, or about 2,000 Watts. You rarely see a 120V appliance rated above 1,500 Watts.
So if you are blowing a breaker regularly, it is either overloaded, which should put even the 5 second averages in that 80th percentile, or the breaker is defective.
@overeasy now that integrations are a thing, would I be able (ab)use this feature to work around the fact that outputs don’t convert constants in scripts?
E.g. could I create a free_integrated integration that is defined as (production - 5000) max 0… and then create a free output that is just free_integration… and then, I could graph the free output as Watts and Wh without any constant in the script?
Not the way you describe it. Integrators accumulate the 5 second Wh values. 5,000 Watts for 5 seconds would be 6.9444 Wh. So you would need to subtract that. When referencing the integrator, you would need to use the .pos method.
You had it right with (ab)use. Excessive integrators will degrade SD and query performance and can lead to repeated restarts due to heap memory exhaustion.