You’re going to have to bring me up to speed a little more on what you are doing.
Is it:
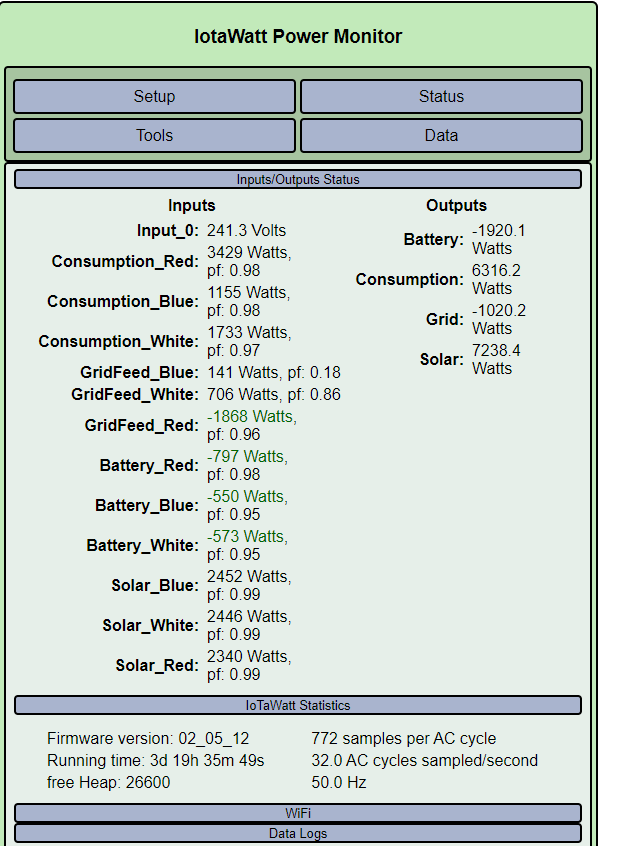
Consumption: always positive, total what the house is using? Including the battery charger?
GridFeed: Is that positive import power/ negative export power?
Battery: Is that positive battery is supplying power, negative battery is charging?
Solar: Is that positive inverter output?
Assuming the above, and that battery is also part of the consumption, you show 7,238 Watts solar generation and 6,316 Watts consumed, leaving a 922 Watt surplus and a 1,020 Watt export - possible - explain below. That leaves the -1,920 Battery that is charging as part of consumption.
Is that right?
The status display is not a snapshot of a single instant in time. The IoTaWatt is sampling channels at a rate of 32/second. The status display has a damping algorithm so the numbers have a little hysteresis. Unless they are all relatively constant, they wont add up.
What should add up is the Wh over an interval as little as 10 minutes. If you plot Solar, Grid and Consumption, the Wh integration should be Solar + grid = consumption.
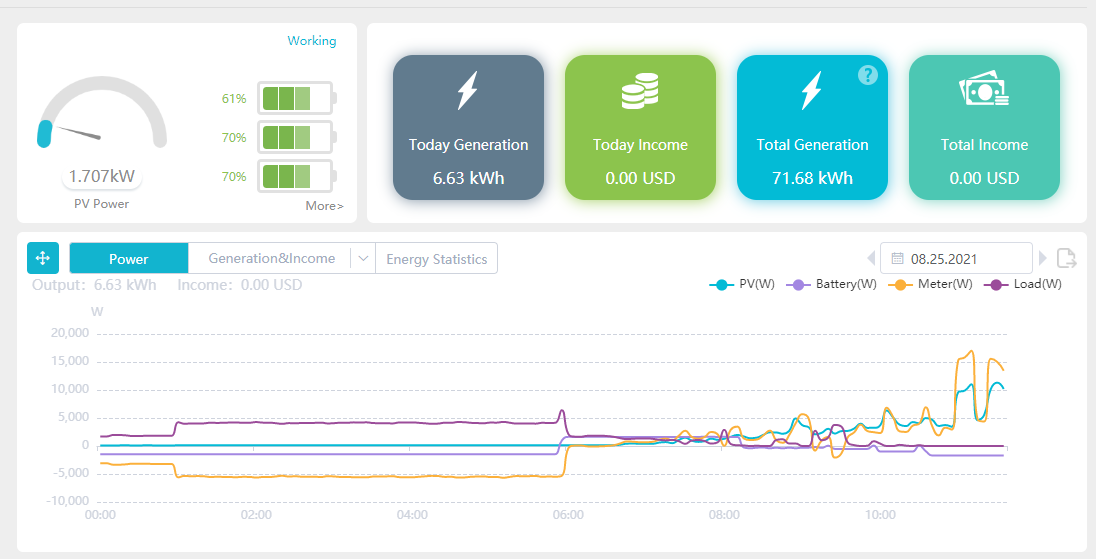
Now the battery online portal:
The metrics here appear to be different. Is it:
Load: Positive what your house is using? including battery charging? (Same as IoTaWatt consumption)
Meter: negative import power, positive export power? (reverse of IoTaWatt grid)
Battery: Negative charging, positive supplying power? (reverse of IoTaWatt)
PV: positive supplying power. (same as IoTaWatt)
I’m looking at the graph and in particular the PV pulse at about 11:00am. PV is putting out 10kW and 15kW is being exported to the meter and battery is charging away at it’s standard 1.7ish kW. What am I missing here?
Have you compared “Today Generation” to the running total in statistics when you plot Solar with Wh units for “today”.
Is it possible that you need to use 1,900 Watts of AC to get 1,700 Watts of DC into the batteries? 10% seems like a plausible efficiency if they are converting the AC back to DC for the batteries.