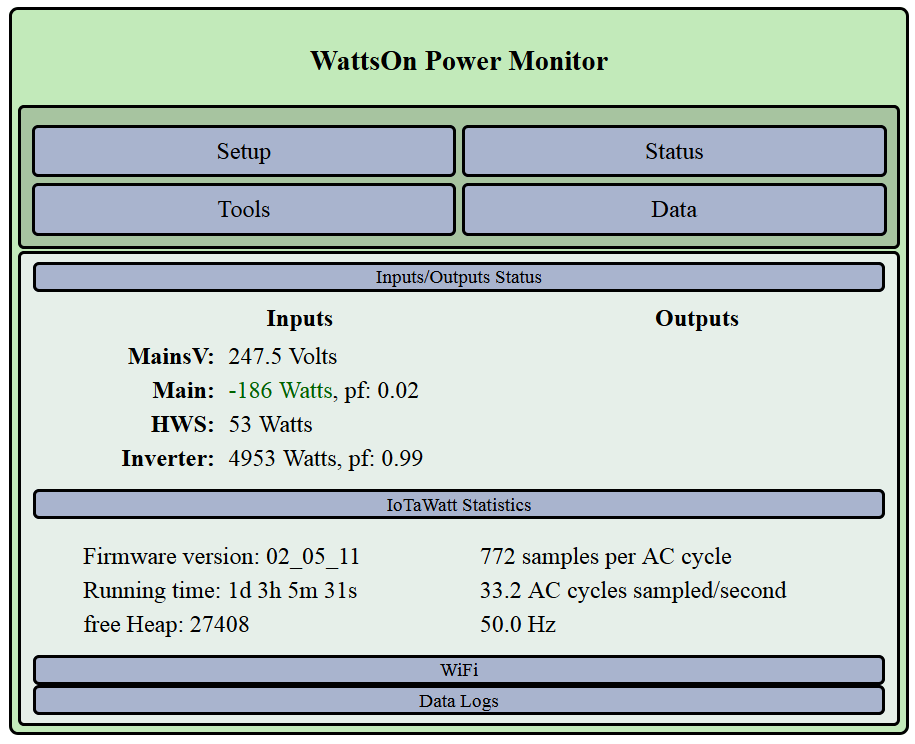
Having completed my Rev.1 “WattsOn” assembly (= IoTaWatt with hardware improvements), I seem to have two faulty CTs, ‘Main’ and ‘HWS’:
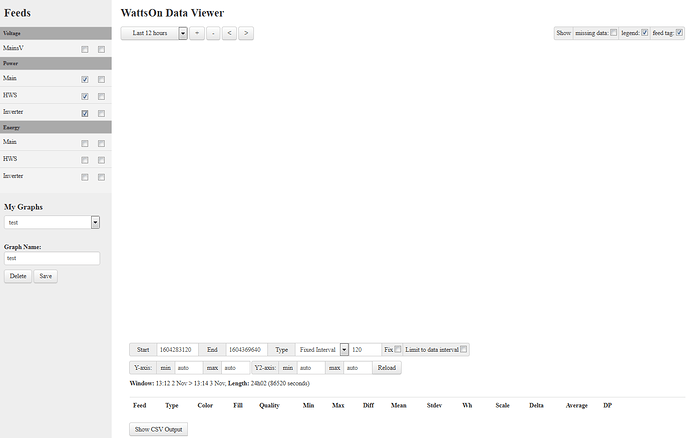
The ‘HWS’ (hot-water service) circuit would normally only be switched-on (remotely by my electricity retailer) overnight, so to check if that CT was truly faulty I wanted to view a graph of its power output over the past 12 or 24 hours.
But on opening the Original Graph page and selecting the three power measurements, nothing was graphed. Am I missing some selection to display a graph?
And what are the two tick-boxes next to each selection for?

