This took me a few iterations to get right, so I though I’d share what I came up with: if your panel includes PV production, total power can quickly become confusing, so here is what worked for me:
- “grid” : one CT around the wire that connects the house to the grid
Must give a positive reading when consuming power, negative when injecting
- “pv “: one CT on the wire coming from the panels
Must give a positive reading when the panels produce
- “east” = (grid + abs(grid))/2
- “eait” = (-grid + abs(grid))/2
- “total” = grid + pv
east is the total power pulled from the grid.
eait is the power inject into the grid
(Terms used by the French Linky meter)
total is the total power consumed in the house
Hope that helps someone 
Franck
1 Like
Yet another way to compute import (east) and export (eait). Another method uses the binary min and max functions of the calculator:
east = grid max 0
eait = (grid min 0) abs
But a word of caution with either of these. When you use them for instantaneous values in the status display, they are absolutely valid. But when you use them to determine import and export over time , they become less accurate as the time intervals increase. They work fine to plot usage, generation, import and export over the course of a day, where the intervals are 2 minutes.
If you use them to look at your import and export over a month, they will be way off. The reason is that “grid” is a net amount over the interval. If the intyervals are one hour, you could easily have exported say 3 kWh and imported 1 kWh, but the net “grid” in the calculation for that interval will be 2 kWh. So your export will be 2 kWh and your import will be zero kWh.
There are ways to capture the real details, but they require either sacrificing an input or using uploading to an external database. I highly recommend that solar users consider using the free (donations welcome) service PVoutput. It is very simple to setup IoTaWatt to send data there, and they provide both a browser interface and a phone app to view the data.
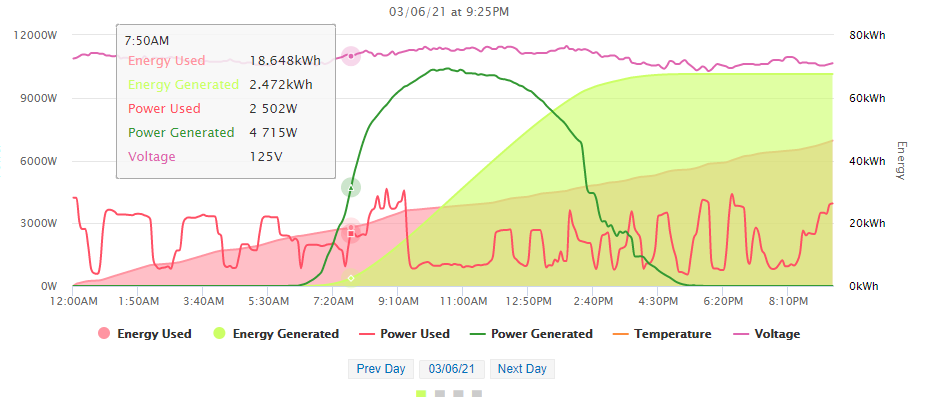
Here’s a typical daily “live” display:
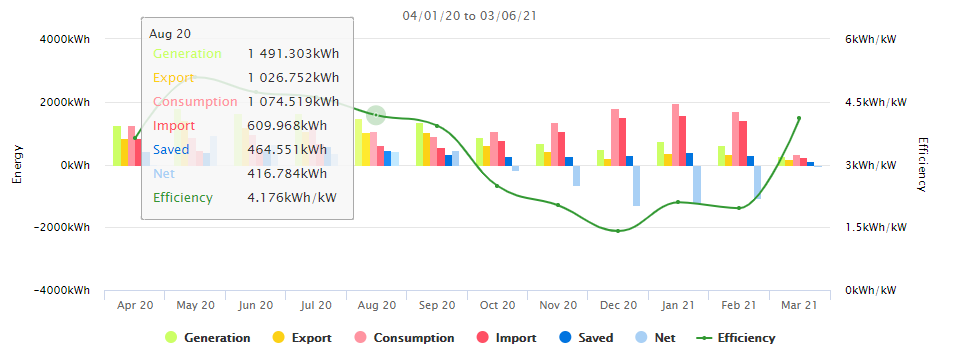
You can see summaries by week or month. This installation has been uploading for a couple of years, so I can take a monthly look for the past year. Simply moving the cursor over any month gives me accurate totals for generation, consumption, import, export and saved which is the amount of generated power used directly.
Looking at today is easy with Graph+, but long term analysis of the PV dynamic would be reinventing the wheel. This is an excellent tool and it’s free.
You saved me some headaches here, thanks.
I am currently doing those calculations in InfluxDB (no min or max function in 1.x), I was planning to move them over to the Iotawatt output calculator since I hadn’t realized that would make a difference.
So if I understand correctly the Pb is that the device does roll up then calculate, rather than calculate then roll up? That is good to know.
Franck
I don’t understand this question. If you look at the two PVoutput graphs above, IoTaWatt and Graph+ can produce the first “daily” graph, but cannot produce the data in the second monthly breakdown graph without capturing the export data using extraordinary techniques. It’s not that it’s incapable of calculating it, real-time or retrospectively, It’s because there is no place to store it in the datalog.
Got it - I do everything in influx/Grafana, so I am not too familiar with the Iotawatt internal storage or graphs.
I think I understand now. If you calculate east and eait in IoTaWatt and send the results to influxDB, it will be correct because it is a small interval. If you send it to influx as Watts, you can then use integrate to get Wh in grafana. If you send it as Wh, you would use sum to get Wh in grafana.