Can someone clearly explain kWh Measurements

Hey I recently installed iotawatt and am trying to figure out how to get an accurate kWhr reading over in my grafana via influxdb, comparing measurements betweeen the iotawatt graph+ interface has me completely confused as to which is correct and how to calculate that in grafana

I dug through quite a few posts that are similar to this on the forums but nothing is crystal clear to me as how to get this going properly

in both grafana and graph+ I am querying the same time range (Today) and have different cumulative results.

just for clarity including my influx outputs

Yet another metric that doesn’t match up

Hi David,

Not enough here to say exactly what’s going on, but we can make a few changes and see what happens.

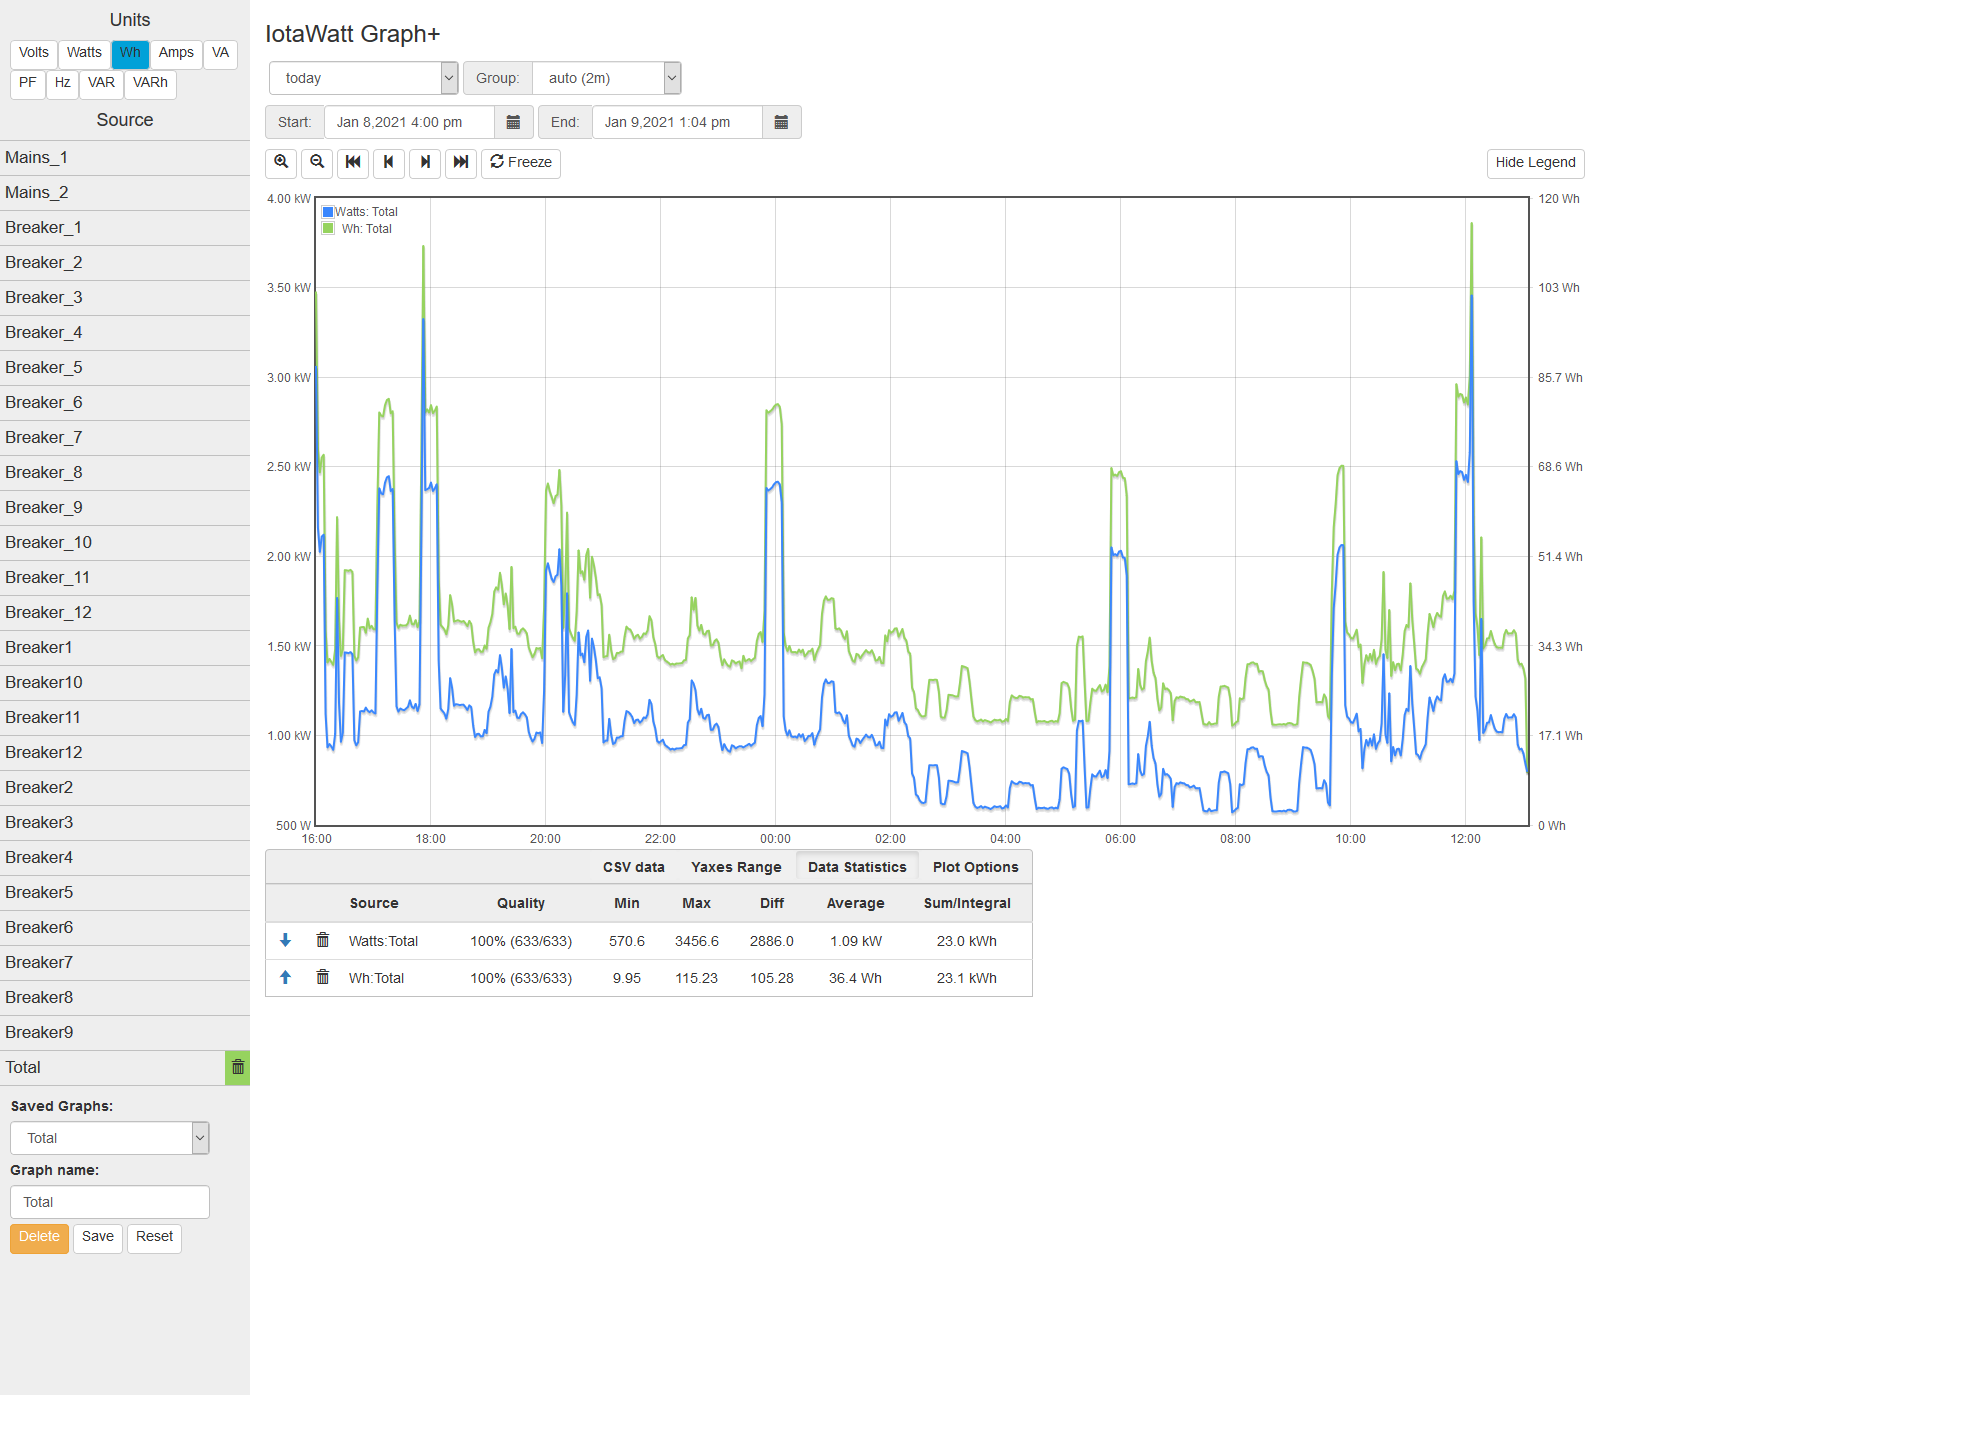
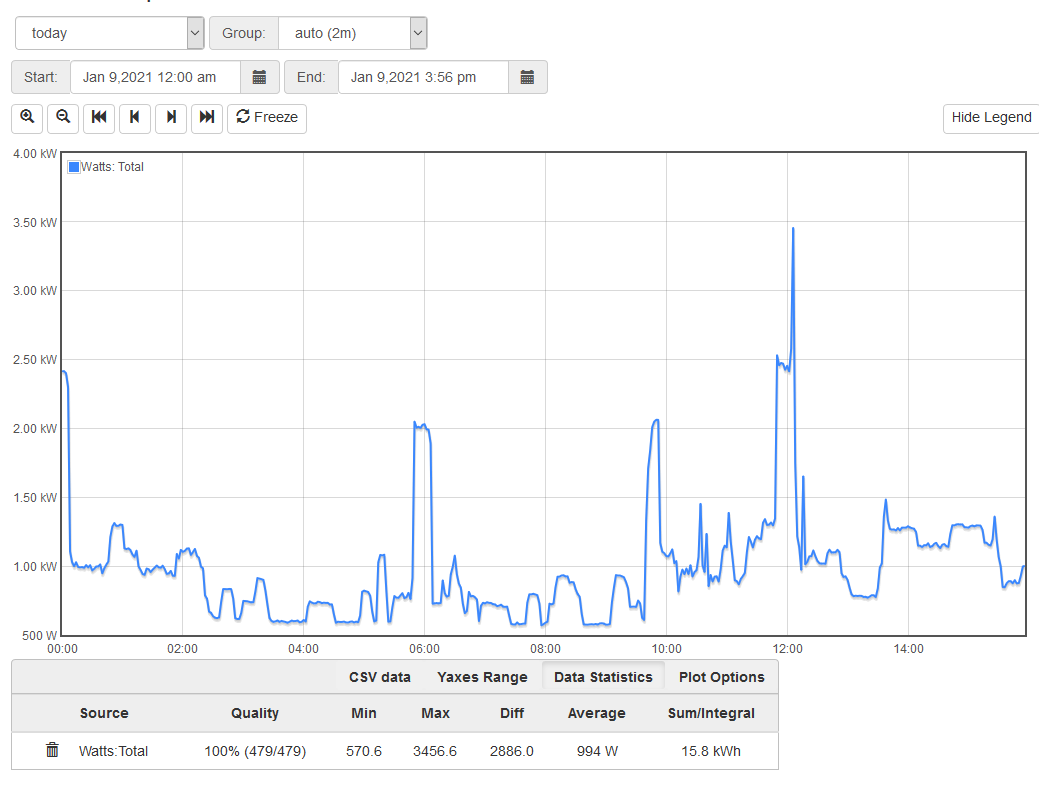
I’m interested in how the first Graph+ was generated because the period is set to “today”, yet the Start date is Yesterday at 4pm. So it covers about 21 hours. The average Watts is 1.09 so 1.09x21=22.89. The graph has it at 23.0 kWh. So I thing the 23 is right for Yesterday at 4pm through Today at 1:04pm.

kWh are just the integration of Watts, that is to say Watts over time. The metrics are different because you are plotting the Wh for each 2 minute interval. The plot covers 1261 minutes at 2 minute intervals, so that’s 630.5 intervals. The average interval Wh is 36.4. 36.4x630.5=22,950 Wh or 22.95 kWh. Again, there is some rounding difference, but basically the same number as the integration of Watts.

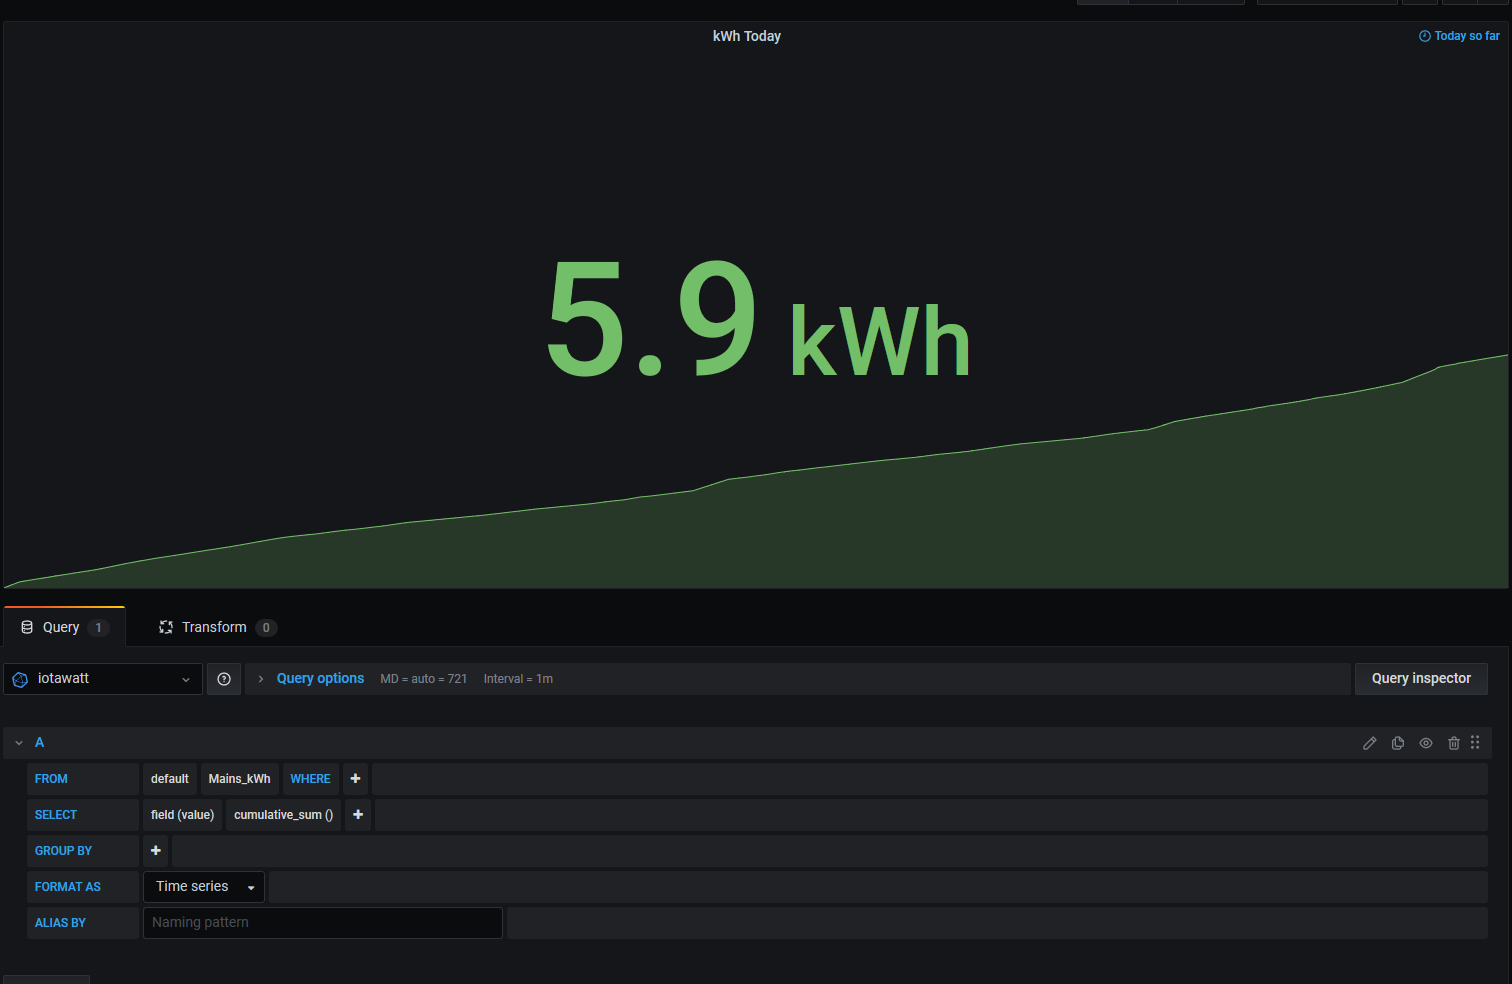
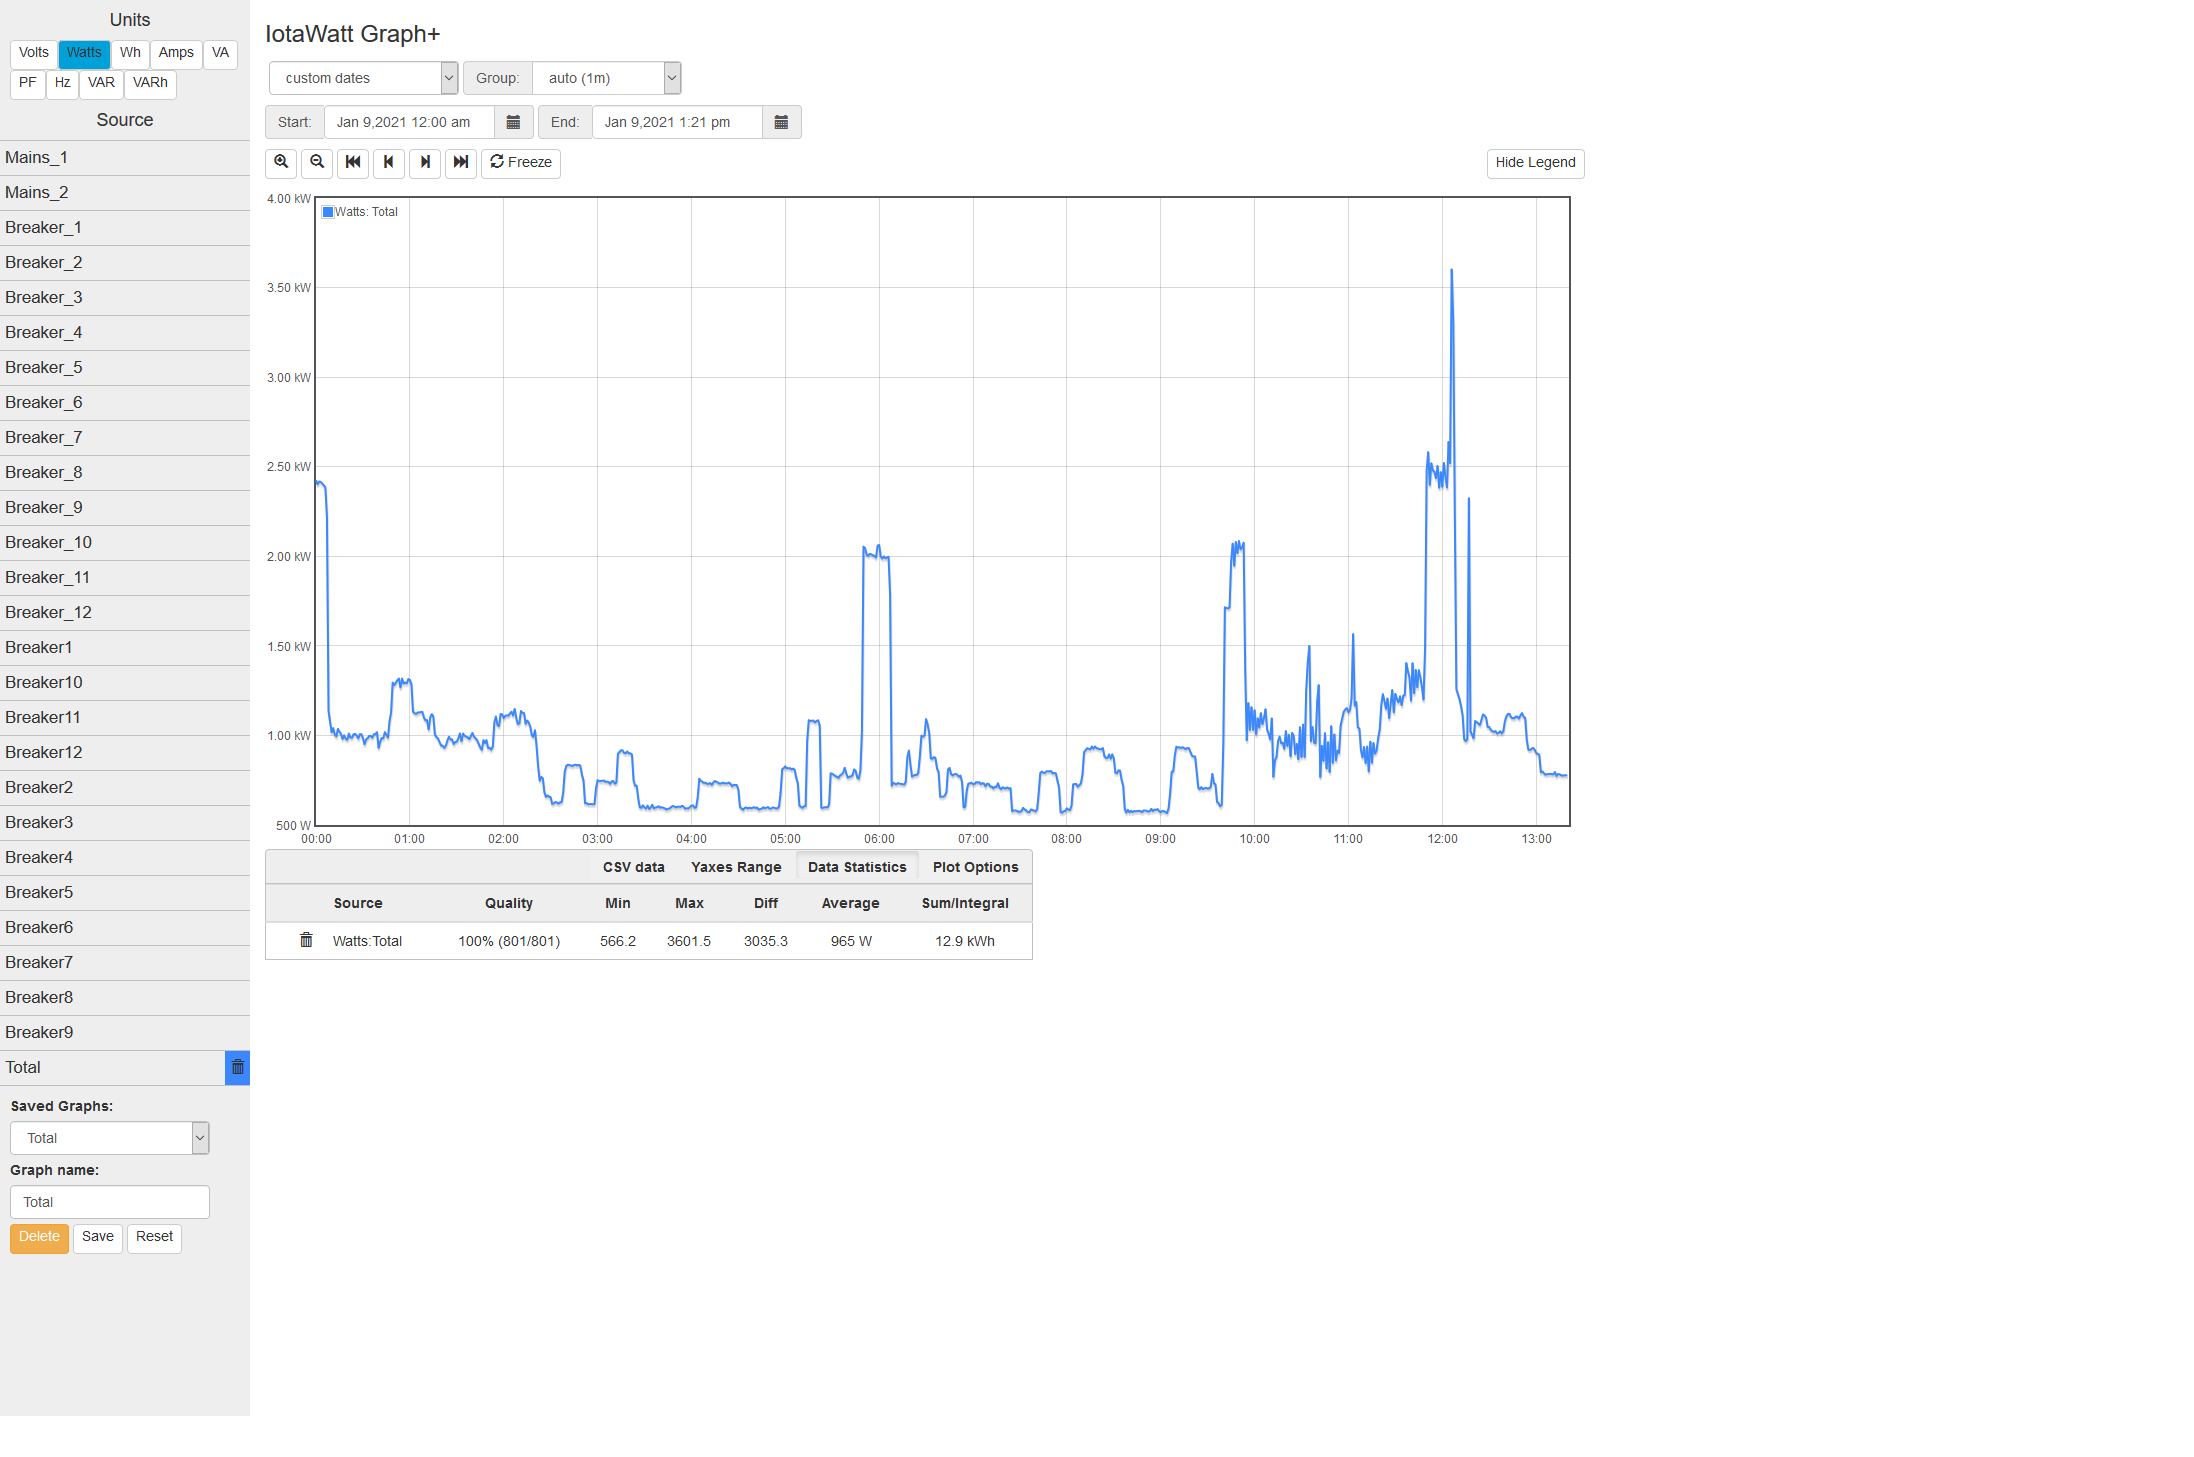
The last Graph+ is actually totay (through 1:21pm) I could go through the same math as above but trust me when I say that 12.9 kWh is the correct number, and that’s the easiest way to get it. There is a way to get it with more decimal places, but it won’t be significantly different.

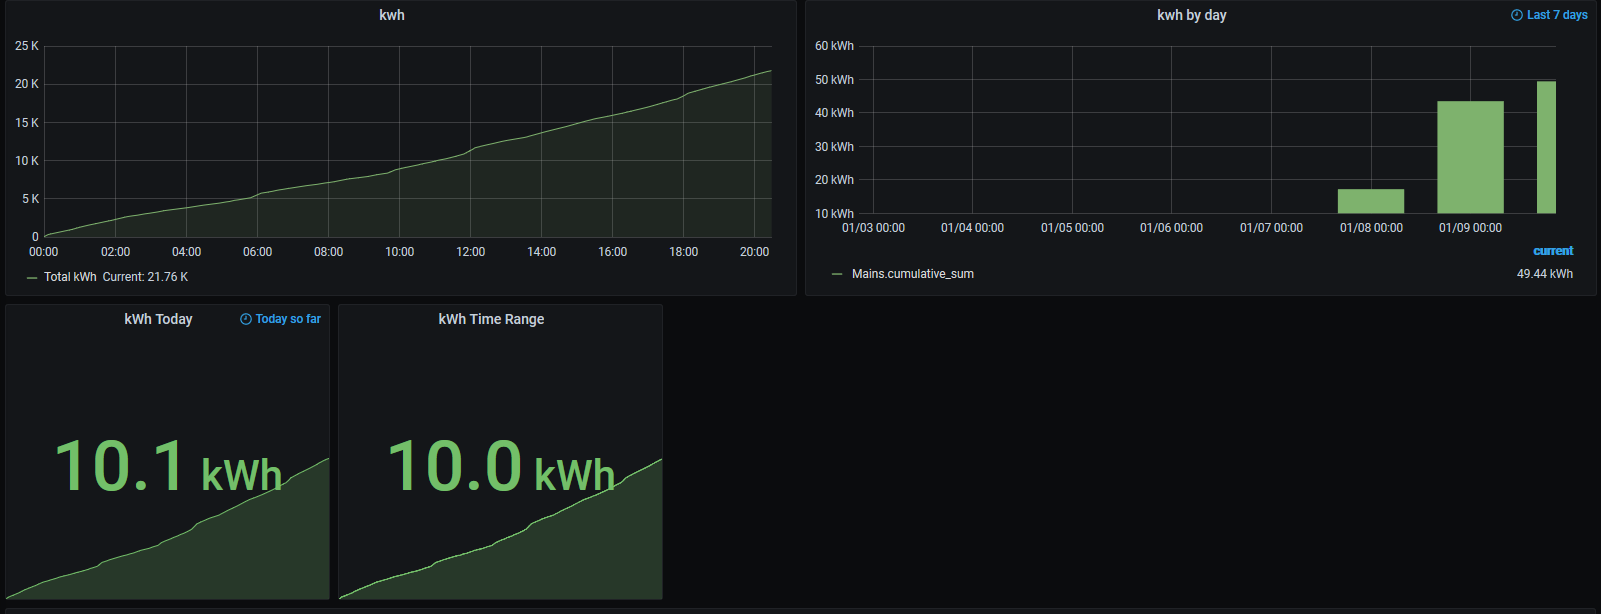
Now what’s going on with influx Grafana?

There are a couple of different ways to get kWh from influx. One is to do what you are doing - upload the kWh for each interval and then add them up. The other is to have influx integrate the Watts the way Graph+ does.

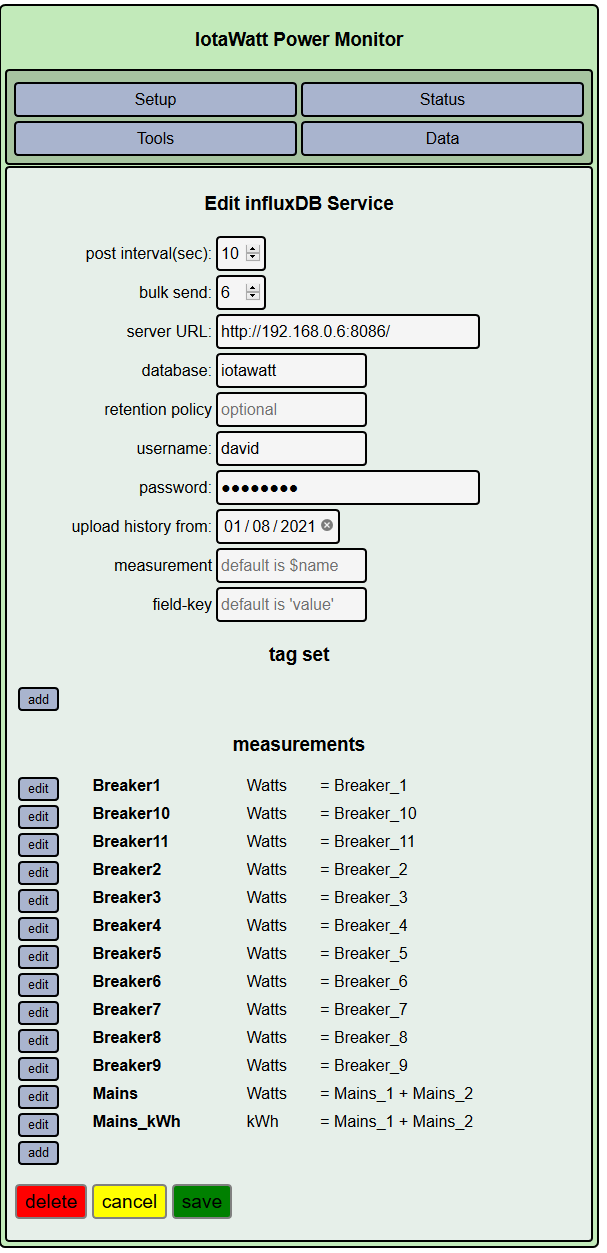
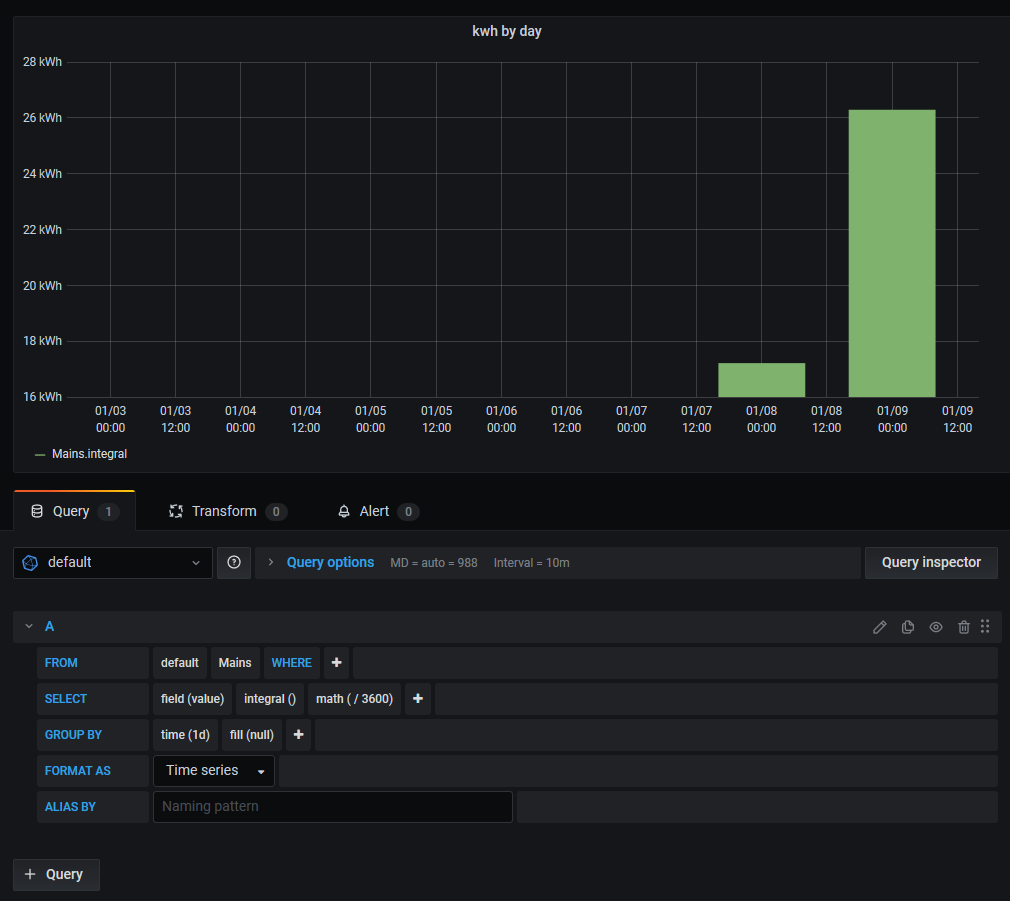
Lets look at what you are currently doing and getting a low result. When you upload kWh to influx, you are uploading the individual kWh used every 10 seconds. In the first Graph+ where you are plotting the Wh for each 2 minute interval, the average is 36.4 Wh every 2 minutes. That would be 3.0333333 Wh every 10 seconds. But you are uploading kWh, so the number would be .0030333. You may be losing some precision here. What I would recommend is uploading Wh instead and change the units in Grafana to Wh. Grafana is smart enough to display kWh when the number gets large enough.

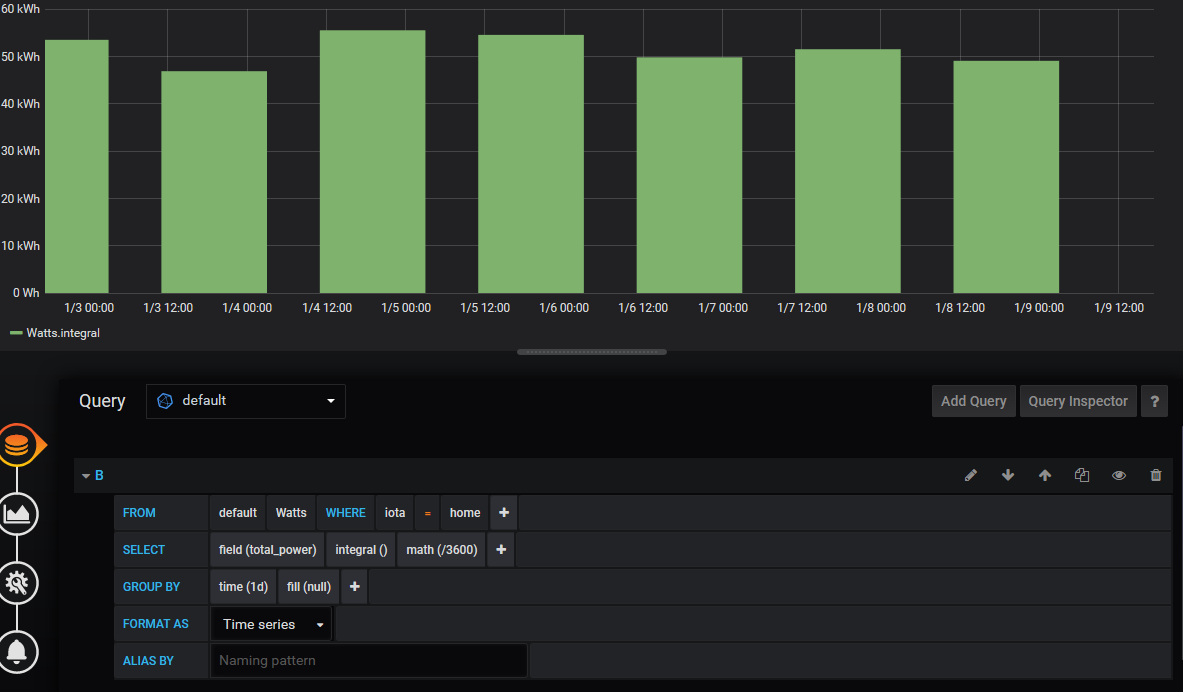
To use the second method, integrating Watts, use the integrate aggregation:

Note that I don’t organize my influx database the same way that you do, so the selection of “total_power” is a little different, but you have that figured out. The important thing is to select “Mains”, use the integral aggregation, and then divide the result by 3600 to convert Watt-Seconds to Watt-Hours.

Edit:
Actually this is more like what you were looking for:

And to reconcile:

1 Like

So my mistake on the time offset. I went back into the UI and hastily took those screenshots… that offset seems to be due to the timezone not being set on the iotawatt and is fixed now

however going off of your example queries I’m still getting a pretty large disparity

mains in influx = total in iotawatt
tried it the other way as well

Got a hunch. Could you post your datalog please?

is that the message log or ?iotamsgs.txt (4.9 KB)

I don’t see where the time zone was set. It’s still saying UTC in the log. Without knowing your timezone, I can’t make sense of this.

image
I’m in Pacific timezone .
would the timezone really matter for external posting ? its my understanding that the timeseries database does that on its end ?

The data is time stamped with UTC but it interprets your upload start time with local time. So I’m wondering if all of today’s data has been uploaded.

Also, I don’t see timezone being used in the last restart in that log.

Has the value reported by influx increased since you last posted it?

yes its steadily increasing but still doesn’t match , I did just restart and the times posted match my timezone now, and it says using timezone…

SD initialized.
1/10/21 03:54:23z Real Time Clock is running. Unix time 1610250863
1/10/21 03:54:23z Reset reason: Software/System restart
1/10/21 03:54:23z Trace: 8:8, 8:9, 9:3, 9:5, 9:9, 1:2, 1:3, 1:4, 1:3, 1:4, 1:3, 1:4, 1:3, 1:4, 1:3, 1:4, 1:1[6], 1:2[7], 9:0[7], 9:0, 9:1, 8:4, 8:6, 8:8, 8:9, 9:3, 9:5, 9:9, 1:2, 1:3, 10:2, 10:3
1/10/21 03:54:23z ESP8266 ChipID: 6735344
1/10/21 03:54:23z IoTaWatt 5.0, Firmware version 02_05_11
1/10/21 03:54:23z SPIFFS mounted.
1/09/21 19:54:23 Local time zone: -8:00
1/09/21 19:54:23 Using Daylight Saving Time (BST) when in effect.
1/09/21 19:54:23 device name: IotaWatt
1/09/21 19:54:23 HTTP server started
1/09/21 19:54:23 timeSync: service started.
1/09/21 19:54:24 statService: started.
1/09/21 19:54:24 dataLog: service started.
1/09/21 19:54:24 dataLog: Last log entry 01/09/21 19:54:20
1/09/21 19:54:28 EmonService: started. url=HTTP://192.168.0.6, node=IotaWatt, interval=10, encrypted
1/09/21 19:54:28 influxDB: started, url=HTTP://192.168.0.6:8086, db=iotawatt, interval=10
1/09/21 19:54:28 Updater: service started. Auto-update class is MINOR
1/09/21 19:54:28 WiFi connected. SSID=MIRV, IP=192.168.1.243, channel=10, RSSI -62db
1/09/21 19:54:28 MDNS responder started for hostname IotaWatt
1/09/21 19:54:28 LLMNR responder started for hostname IotaWatt
1/09/21 19:54:29 EmonService: Start posting at 01/09/21 19:54:30
1/09/21 19:54:29 Updater: Auto-update is current for class MINOR.
1/09/21 19:54:29 influxDB: Start posting at 01/09/21 19:53:40

I think it simply doesn’t have all of today’s data. I’m thinking it doesn’t have the first 8 hours. What time does your grafana plot begin to show KWh?

well progresss… it seems like I can get a graph panel to match but I cannot get the same settings to work on the singlestat or the day view like you have above

graph shows 21.76kwh iotawatt shows 21.6

these charts all have the same basic aggregation only the top left graph is close to being correct

I think this is all about time. You need to have the right timezone set on the IoTaWatt (I believe it is now), and on the server running influx, the server running grafana, and your computer running Graph+ and the Grafana plots.

In the graph you just posted, it’s starting to plot for tomorrow, but it’s only going on 9pm there. So grafana doesn’t seem to know what your today is.

So just an update on this.
My influx server timezone is set to the same as iotawatt… PST. nothing to really do there, but when I changed the influx queries adding tz(‘US/Pacific’) it started matching up with iotawatt.
I fixed the singlestat by using last value (Due to cumulative_sum()) (with tz fix as well)

so it seems as influx isn’t respecting my timezone set on that server…

thanks for your help !

1 Like