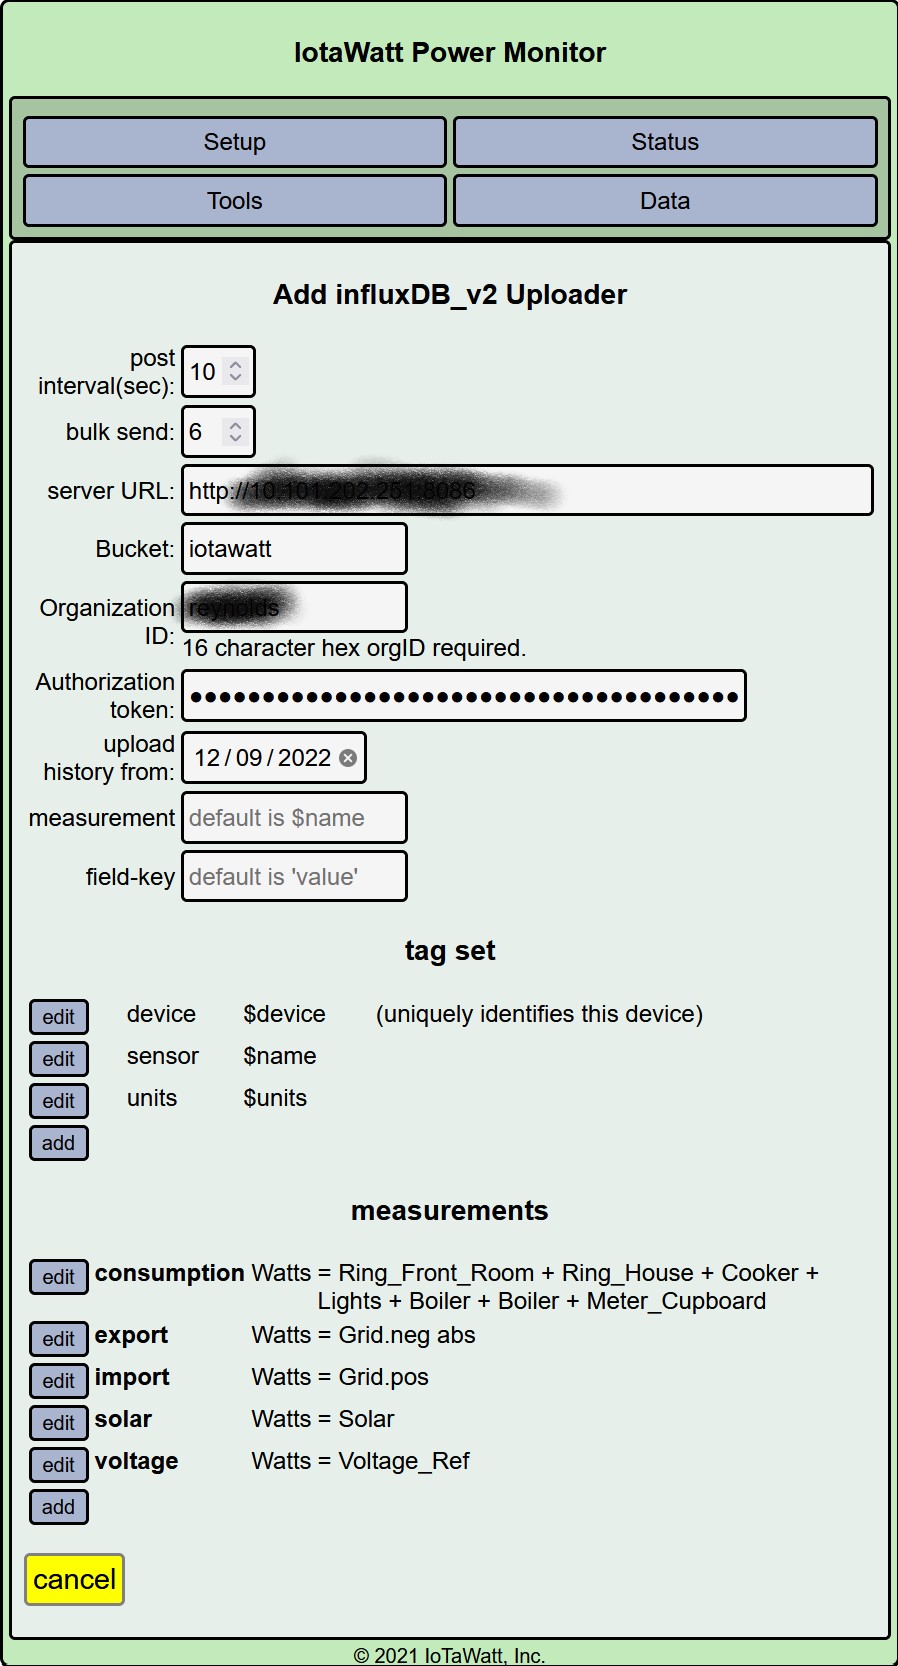
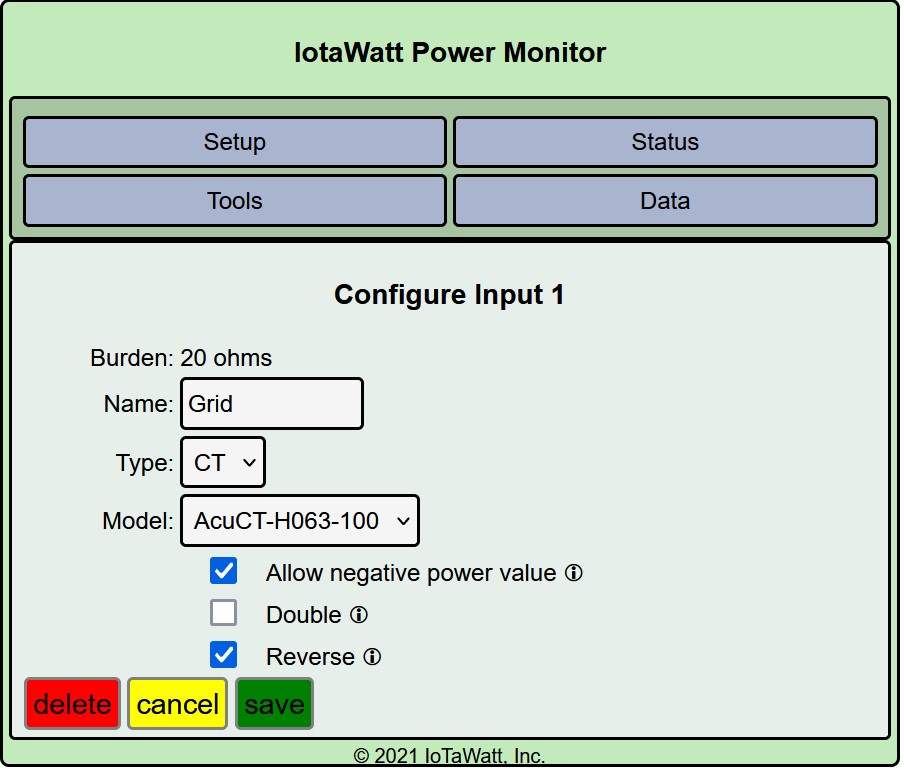
Can anyone tell me why I can’t save the config shown in the attched image please?
I have influxdb v2.4 running in a docker container on my nas. I can access the UI for it and have populated all the fields correctly from the UI but I don’t get a save option at the bottom of the setup screen.
I don’t yet have any addons running like Telegraf or Grafana yet. My plan was to get one element running at a time.
Do I need something like Telegraf to interface between IotaWatt and influxdb?
I have been battling with getting it to run for ages. Finaly got an instance of influxdb running and now I’m stuck again.
Any help appreciated.
consumption Watts is the problem. Try consump_watts One word.
There is a message under Organization ID:
16 character hex orgID required.
Thanks for the idea @Bali but they are seperate fields. consumption is the name and watts is the units.
Thanks @overeasy. I completely missed that. Am I right in thinking this is the string taken from the bucket ID?
One more question if I may on a subject that is confusing me.
I plan to have a dashboard showing things like “consumed so far” “exported so far” “consumed today” etc. with kWh as the units.
Do I do the math in influxdb/grafana or do I just create a measurement in IotaWatt using units=kWh.
I’m getting confused as to how I get from an instantaneous reading of watts to an accumulated figure for kWh over time.
Am I just being dim 
Ignore my question re finding the OrgID, I found it 
Either way.
The former is a bit more complicated as you need to use the integral() function in the flux query. There are several threads in this forum where folks are doing it. I have not done it in flux, but have done so in influxQuery with influx 1.8.
The latter, where you simply export the Wh to influx and then report the sum is simpler but increases your data size a tiny bit. I would go with exporting the Wh.
You don’t. You export Watts to get average for each interval, and you either integrate Watts or export Wh to get average (mean()) or total (sum()) Wh at each interval.
1 Like
Thanks @overeasy. I’m slowly moving forward
I now have influxdb up and running and have data feeding into it from my IotaWatt.
\hsving trouble getting grafana running at the moment. When I install it in a docker container on my nas I can’t get to the WebUI for some reason. Progress is slow, but progress is progress and Im learning loads.
I have gone back to InfluxDB v 1.8 as that is the only way I seem to be able to get Grafana running as well. Odd I know!.
So now I’m up and running again with data feeding in to my new instance of InfluxDB v1.8. I have setup my frst dashboard showing power consumption/Genration/Import and Export over time in Kw.
Now I am trying to get one setup that shows me Energy kWh for the same items. Still struggling to get my mind round doing this.
Would you mind sharing the queries you used to achive this @overeasy
I have searched on here and other online resources but am only getting more confused.
I’m getting close (I think).
I have the following query set up in grafana
SELECT cumulative_sum(sum("value"))/1360 AS "kWh" FROM "export" WHERE ("sensor" = 'export') AND $timeFilter GROUP BY time($__interval) fill(null)
Taken from @Jam 's post on this thread
Which gives me a guage display of sorts.
I have IotaWatt set to export data every 10 seconds (post interval).
The sums don’t seem to add up though.
My solar installation is showing 2.8 kWh exported today but this query shows 1677244?
I’m dividing by 1000 to get from wH to kWh and 360 as the sample rate is 10s.
I know there is something wrong with my logic but I’m stumped ![]()
Plus, I’m not sure but I have set the calculation field in the panel settings to Total?
I believe the query that you reference is adding Wh. What is your “cumulative_sum” metric? If it is Wh, you only need to add them up. Grafana recognizes Wh and will scale to kWh where appropriate.
If you don’t know what you have uploaded, maybe you should take a look at the data and see what it looks like, or post your uploader setup.
I’m studying hard trying to get my mind around this. New to the whole thing so taking time I’m afraid.
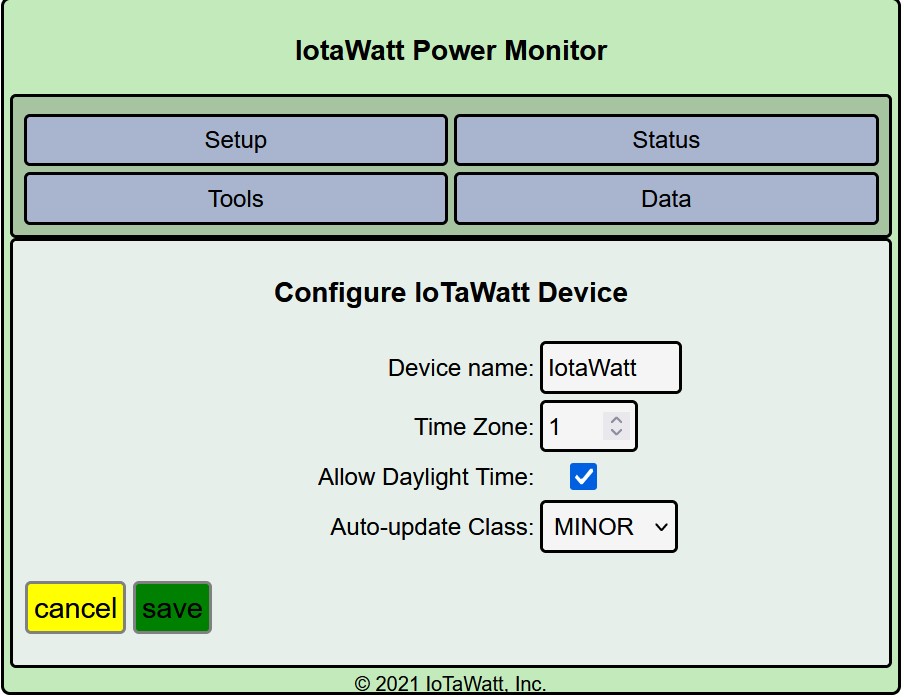
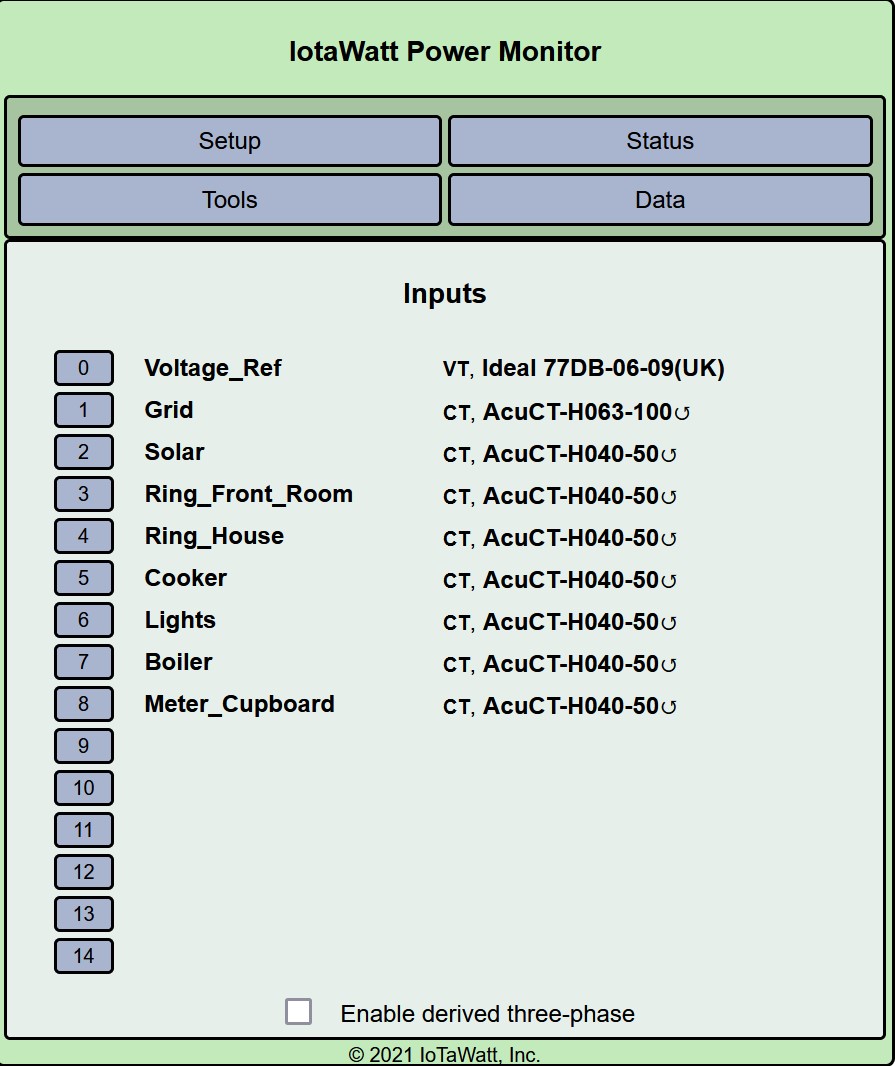
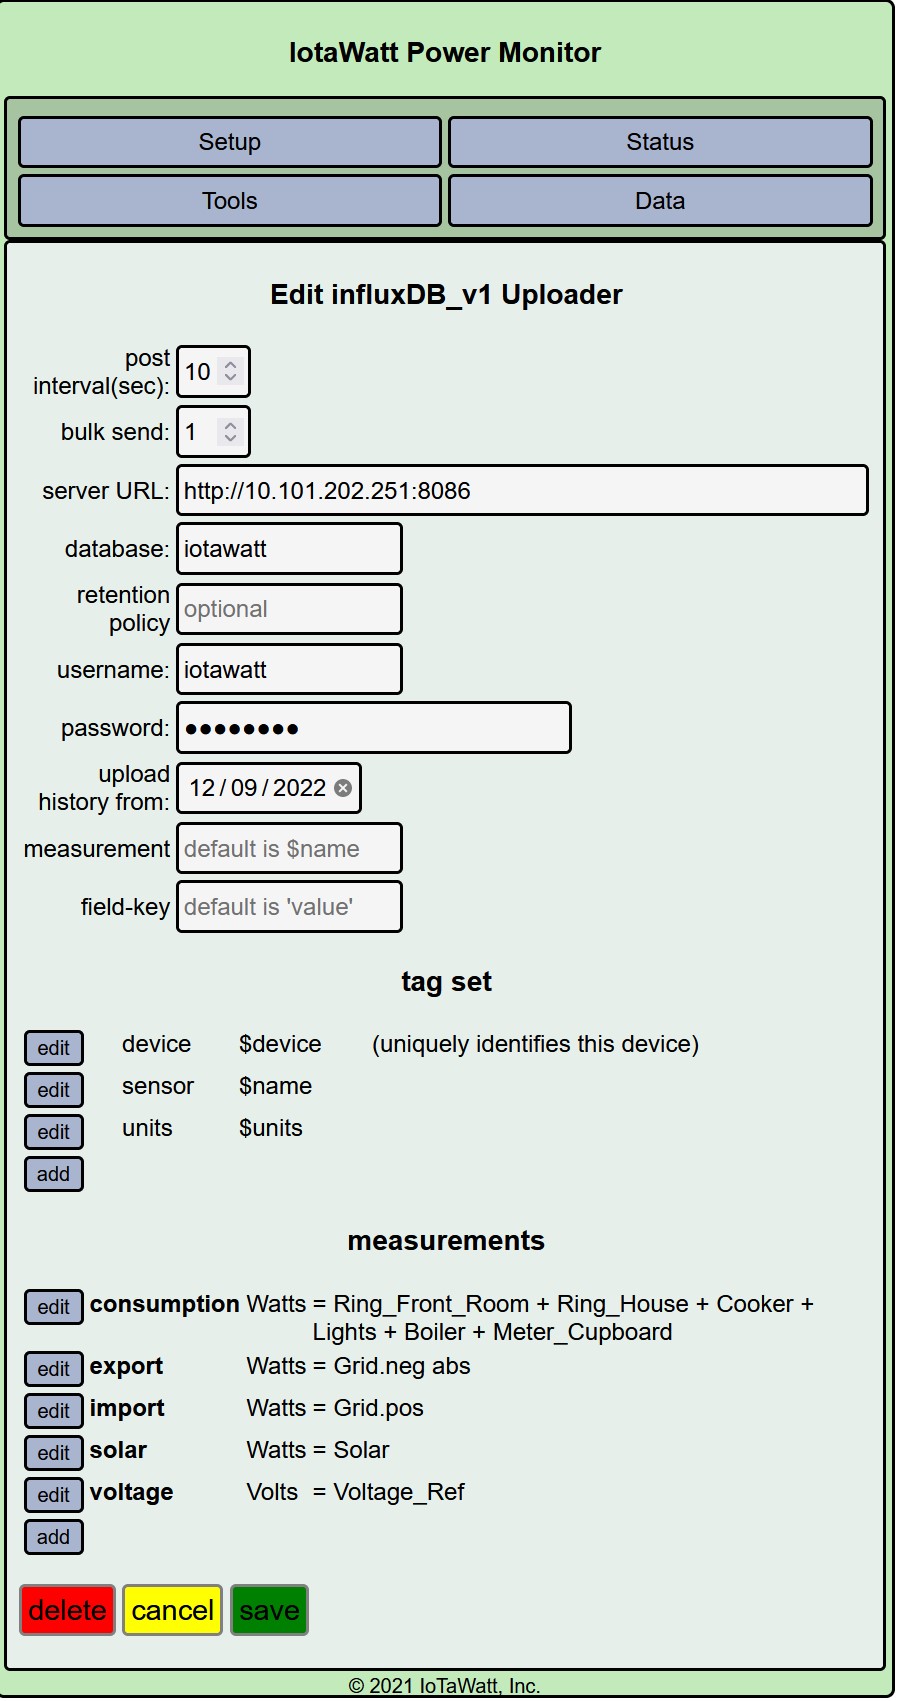
In the meantime I am attaching pics of my complete setup.
Any sugestions on how I could do it better greatly appreciated and suggestions on how to write my queries in Grafana would be great as well.
My initial aim is to get a dashboard/dashboards showing:
- Power use now total (all circuits) (w)
- Power Imported Now (w)
- Power Exported Now (w)
- Energy Consumed today so far (kWh)
- Energy Exported today so far (kWh)
- Energy Imported today so far (kWh)
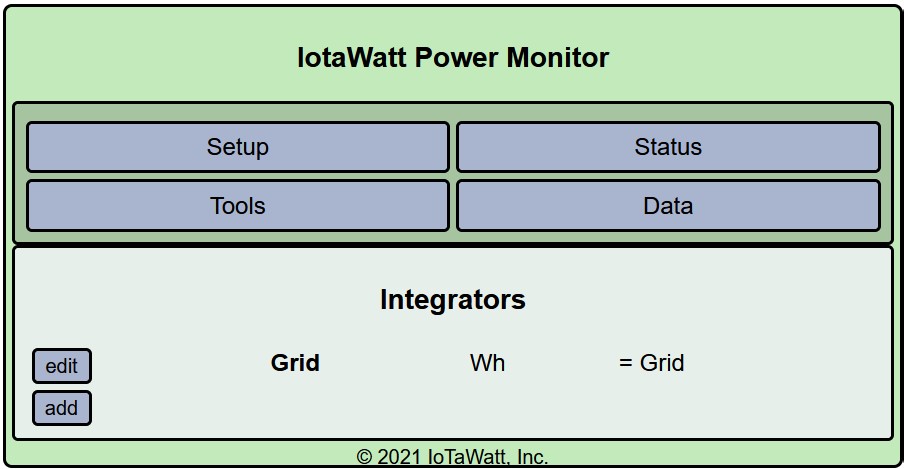
I haven’t used the Grid Integrator in my current setup as I decided to try and do the math in Grafana.


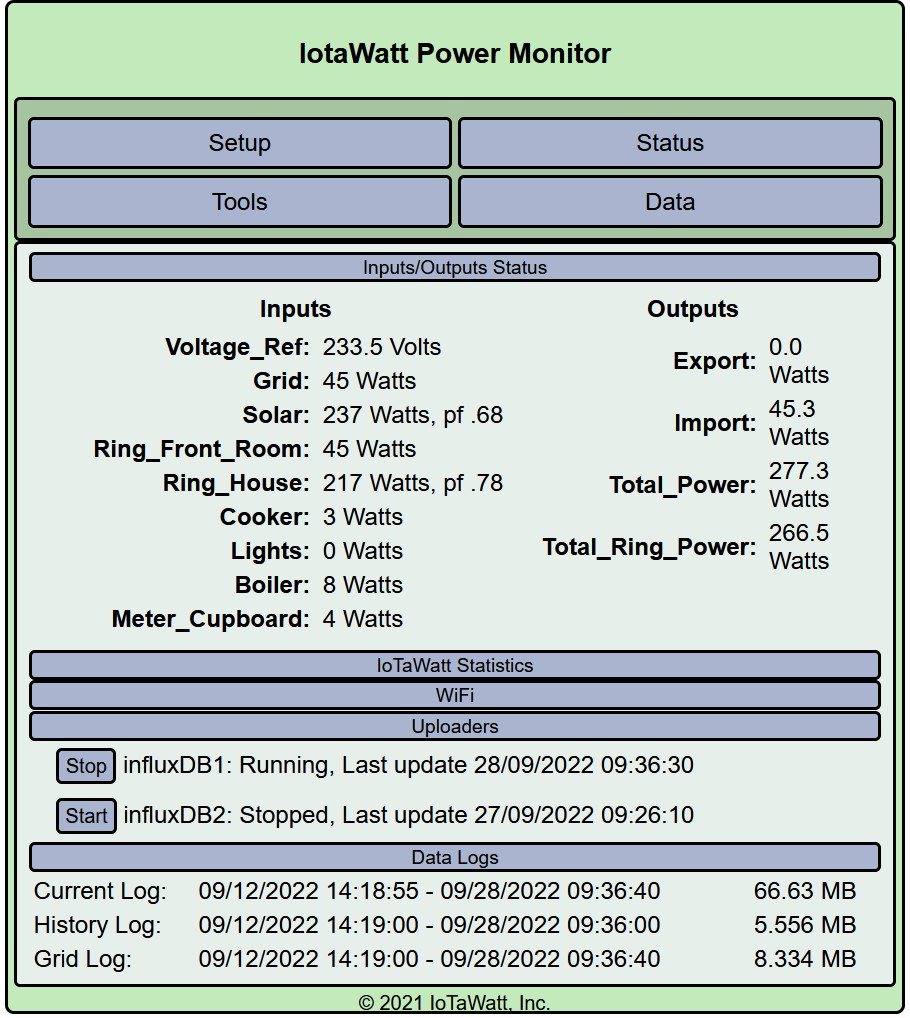
I have just done a direct comparison between my Solar Dashboard, IotaWatt and Grafana of my power metrics (W) for:
Total Consumption
Exported Power
Imported Power
Solar Power
All three are there or there abouts considering the delay in my solar dashboard and the differing sample rates.
I don’t currently have IotaWatt measuring kWh but the Solar dash panel and my Grafana Dashboard aren’t reporting the same figures. I can’t be sure if this is down to the math or if I’ve gfot the query completely wrong.
I am uploading W every 10 seconds. So, am I right in saying I need to take each 10s measurement and divide by 360 to give me kWh?
I have got to this as my query so far
SELECT cumulative_sum(sum("value"))/360 AS "kWh" FROM "consumption" WHERE $timeFilter GROUP BY time(10s) fill(linear)
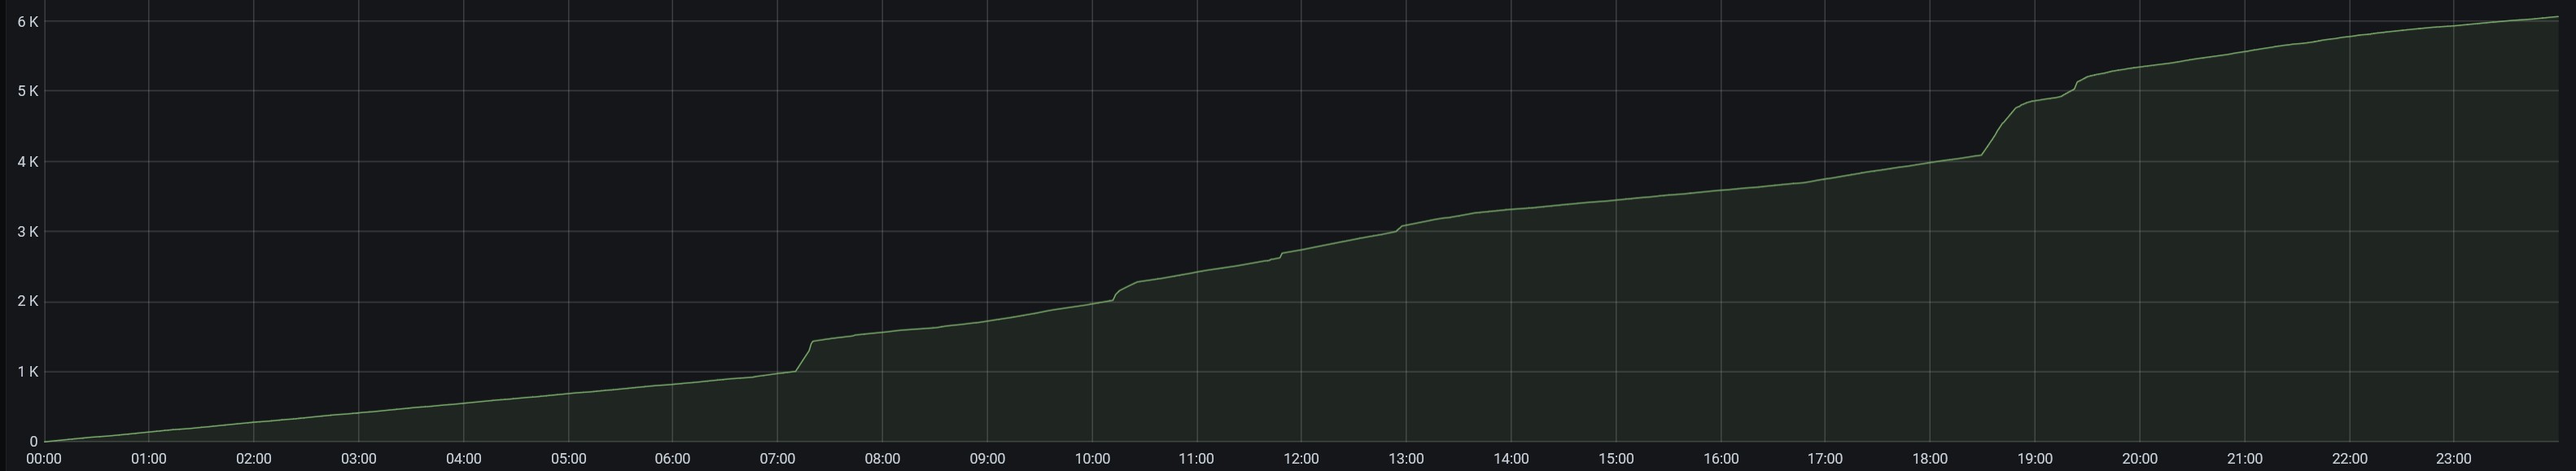
It gives me an increasing slope as expected. However the results don’t seem that accurate.
For instance yesterday my solar dash said I consumed 7.9kWh but this shows only 6.063kWh.
The $timeFilter is still confusing me a bit, as is the actual math.
I’d like to do this in Grafana if I can because I understand the other way you described is to set up an Integrator in IotaWatt to upload another metric of wH. Surely this is wasteful of storage as it created another data field. With Time, Name, Watts and Volts in the DB surely everything else can be calculated?