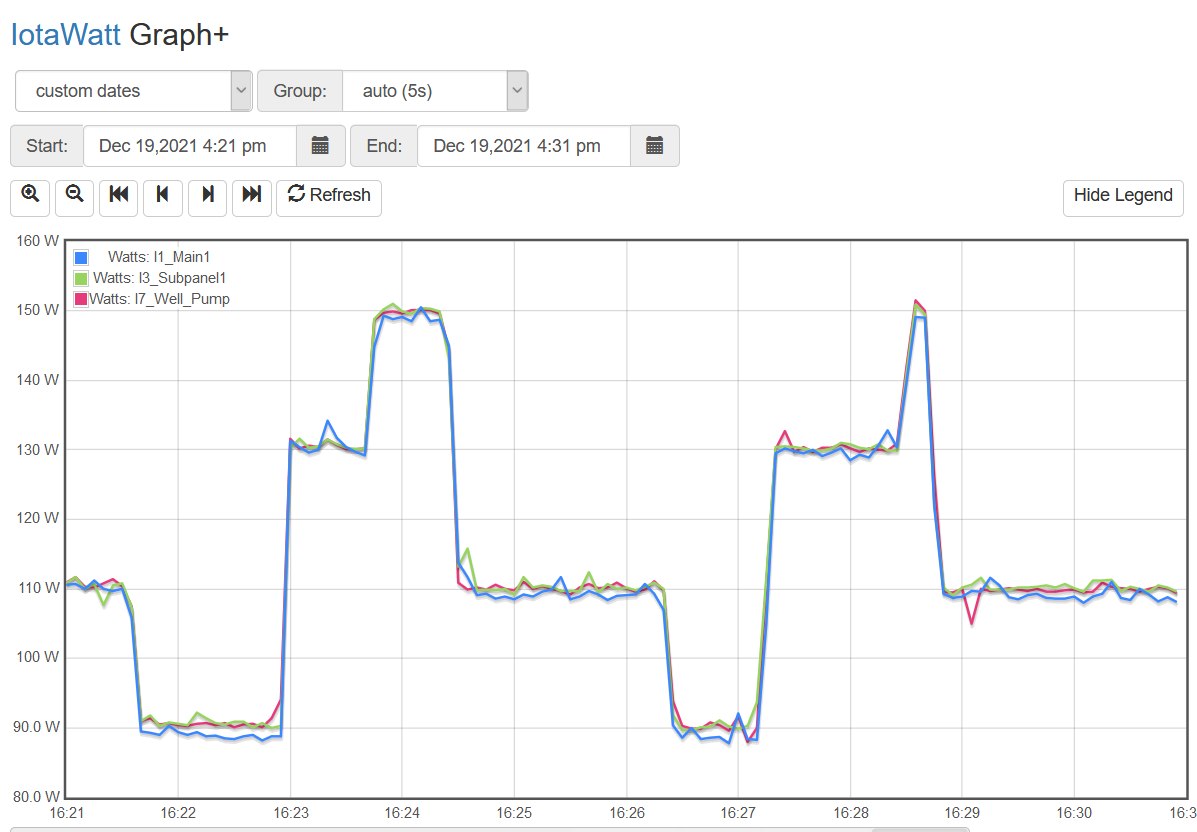
I installed the IotaWatt system in a North American 120V/240V split phase panel. I have a mix of AccuCT 200A, 100A and 50A CTs. As a test, I put one of each size on the same wire. When I graph watts, I see some variation in the recorded watts. For example at 16:23, there is about a 4 watt peak on the blue channel and at 16:29 there is about a 5 watt dip on the red channel. I’m guessing this is due to sampling each channel on different cycles and the power used is changing between channel measurements. I would have thought that a 5 second average would have evened the samples out, though. Are the varying peaks and dips expected?
When I plot the same time period as amps, I see quite a bit of “noise” on the channels, especially the blue I1_Main1. Is this an artifact of the data being stored in the database as watts and amps must be calculated?
Looks normal. You are right that the IoTaWatt samples one input at a time and so with a changing load, different CTs on the same wire might see it a little differently.
But I don’t think that’s the primary cause here. Looking at the amps plot, the effect is most pronounced with the 200A CT, then secondarily with the 100A CT, then almost gone with the 50A CT.
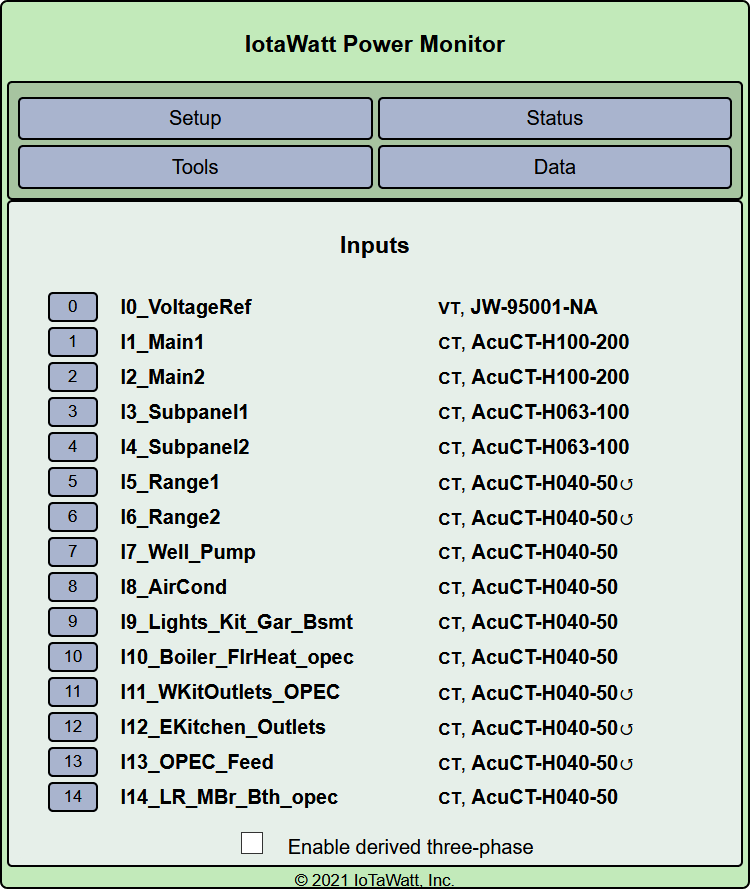
This circuit is drawing about 1 Amp. For the 200A CT that’s 1/200=0.5\% of range. For the 100A it’s 1/100=1\% and for the 50A 1/50=2\%. When the 200A CT is measuring that low current, the resolution of the IoTaWatt 12bit ADCs cannot differentiate, and somewhat the same to a lesser degree with the 100A. I think there is something switching on and off here and the inrush current is what is causing the problem.
If you look at the statistics tab with the Watts plot, how do the Wh match up? I think they will be pretty much the same, but even if a little off, the 200A CT is probably not the best choice for measuring 1 Amp. That said, if you perform the experiment with a similar unity load like a steady state 100W incandescent light, the three plots should be the same.
Thanks for the observation on the percentages. That makes a lot of sense. There are mainly electronics on that circuit so probably a lot of switching power supplies. I did try plugging in a 1000W iron, but the graph scale changed and I couldn’t see the individual circuit variations as well. I thought it was due to the larger Y-axis range, but given your answer, it was more so due to the larger current better matching the ADC sampling resolution.
Here is the statistics tab for the Watts plot. The Wh for the 50A and 100A CTs match, and the 200A CT is about 1% lower.