Im not understanding the multiple CT phase angle values for some of the CT’s in the standard tables.txt files. ( i get the 50 or 60hz but not the multiple phase angle errors ) @overeasy please could you let me know how these variables are added - i ask because i have some discrepancies on a 600A class 0.5 CT which varies more or less considerably versus my utility grade device at varied % of CT capacity.
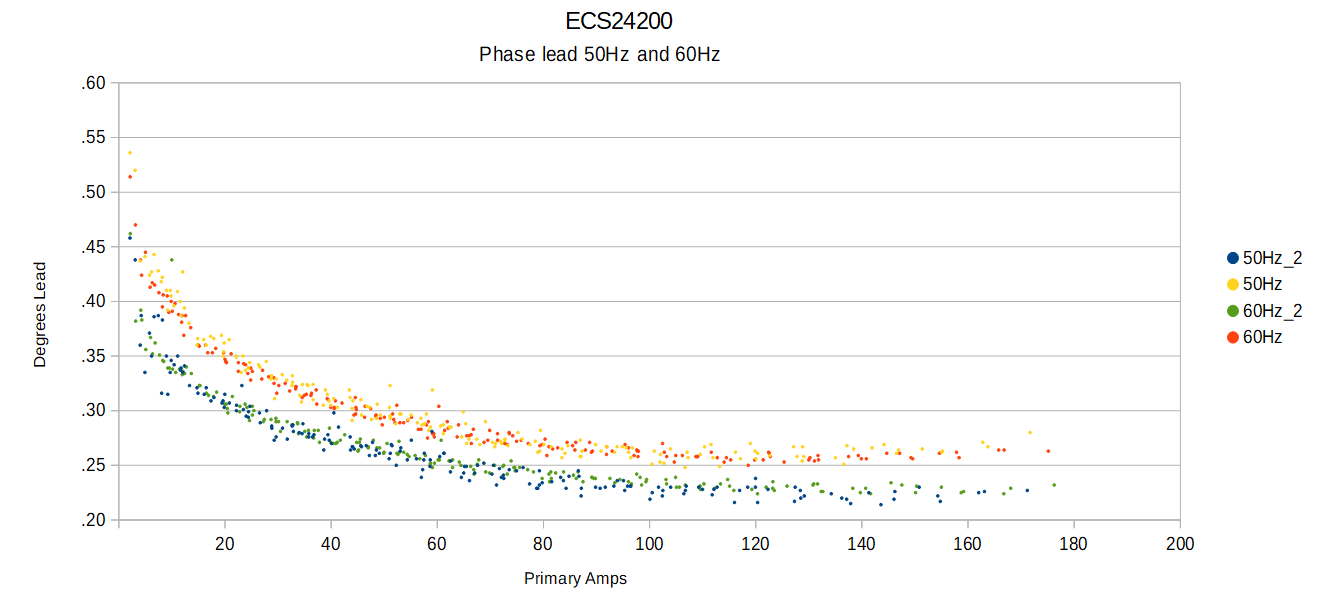
As you can see above, this 200A CT varies from about 0.5° down to a fairly steady 0.25° in midrange.
Realistically, quality larger CTs, and 0.5% CTs, have relatively low shift. Moreover, shift isn’t really a big source of measurement discrepancy until the power factor get down below, say, .70. If you are having issues with accuracy as compared to another measurement source, you might first compare VA between the two. VA would not be effected by phase-correction. Graph+ does not have a direct way to access VAh, but if you plot VA over any time period, the Data Statistics will show VAh.
If the VAh are within acceptable margins and kWh is not, then you might suspect phase-correction as a source of the discrepancy.
Tx Bob . The explanation makes sense. I tried the VA comparative approach first and i am lower in the datasets i checked by about a factor of 1.19 ( example i get 168kVA where the other source is 200kVA ), ive double checked primary output and turns ratio. I must be missing something - any thoughts?
Well then your problem isn’t phase correction. Both because VA is off and because the variance is too great to be a power factor problem.
You haven’t provided much information, so how many guesses do I get? As I recall, you may be building your own hardware. If that’s the case, there are a lot of possibilities beyond the usual suspects. But that said, I’m gonna go for it:
As you point out, the ratio of 200kVA to 168kVA is 1.19. The inverse is .84. The ratio of 20:24 is .833. Is it possible your unit is configured as 24 Ohm burden resistors and the actual value is 20 Ohm?