This is with “today” selected at the top. The x-axis shows the time at around 02:04 but doesn’t specify a date. The plot point detail shows the time at 13:04 on todays date (in the future).
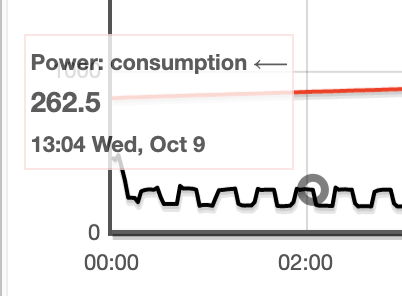
This is with “today” selected at the top. The x-axis shows the time at around 02:04 but doesn’t specify a date. The plot point detail shows the time at 13:04 on todays date (in the future).
Hmmm, 11 hours off. What could that be?
Do you have the time zone offset specified in the IoTaWatt configuration (under setup-device)? Since I believe you are in Australia, you should have the allow daylight time box checked also.
Both the browser and the IoTaWatt need to be using the same local time. The good news is that the data is time stamped with UTC so once you set the time correctly, everything should come together, including the historical data.
As an aside, if you are using PVoutput, correct local time is required as the protocol uses local time time stamps.
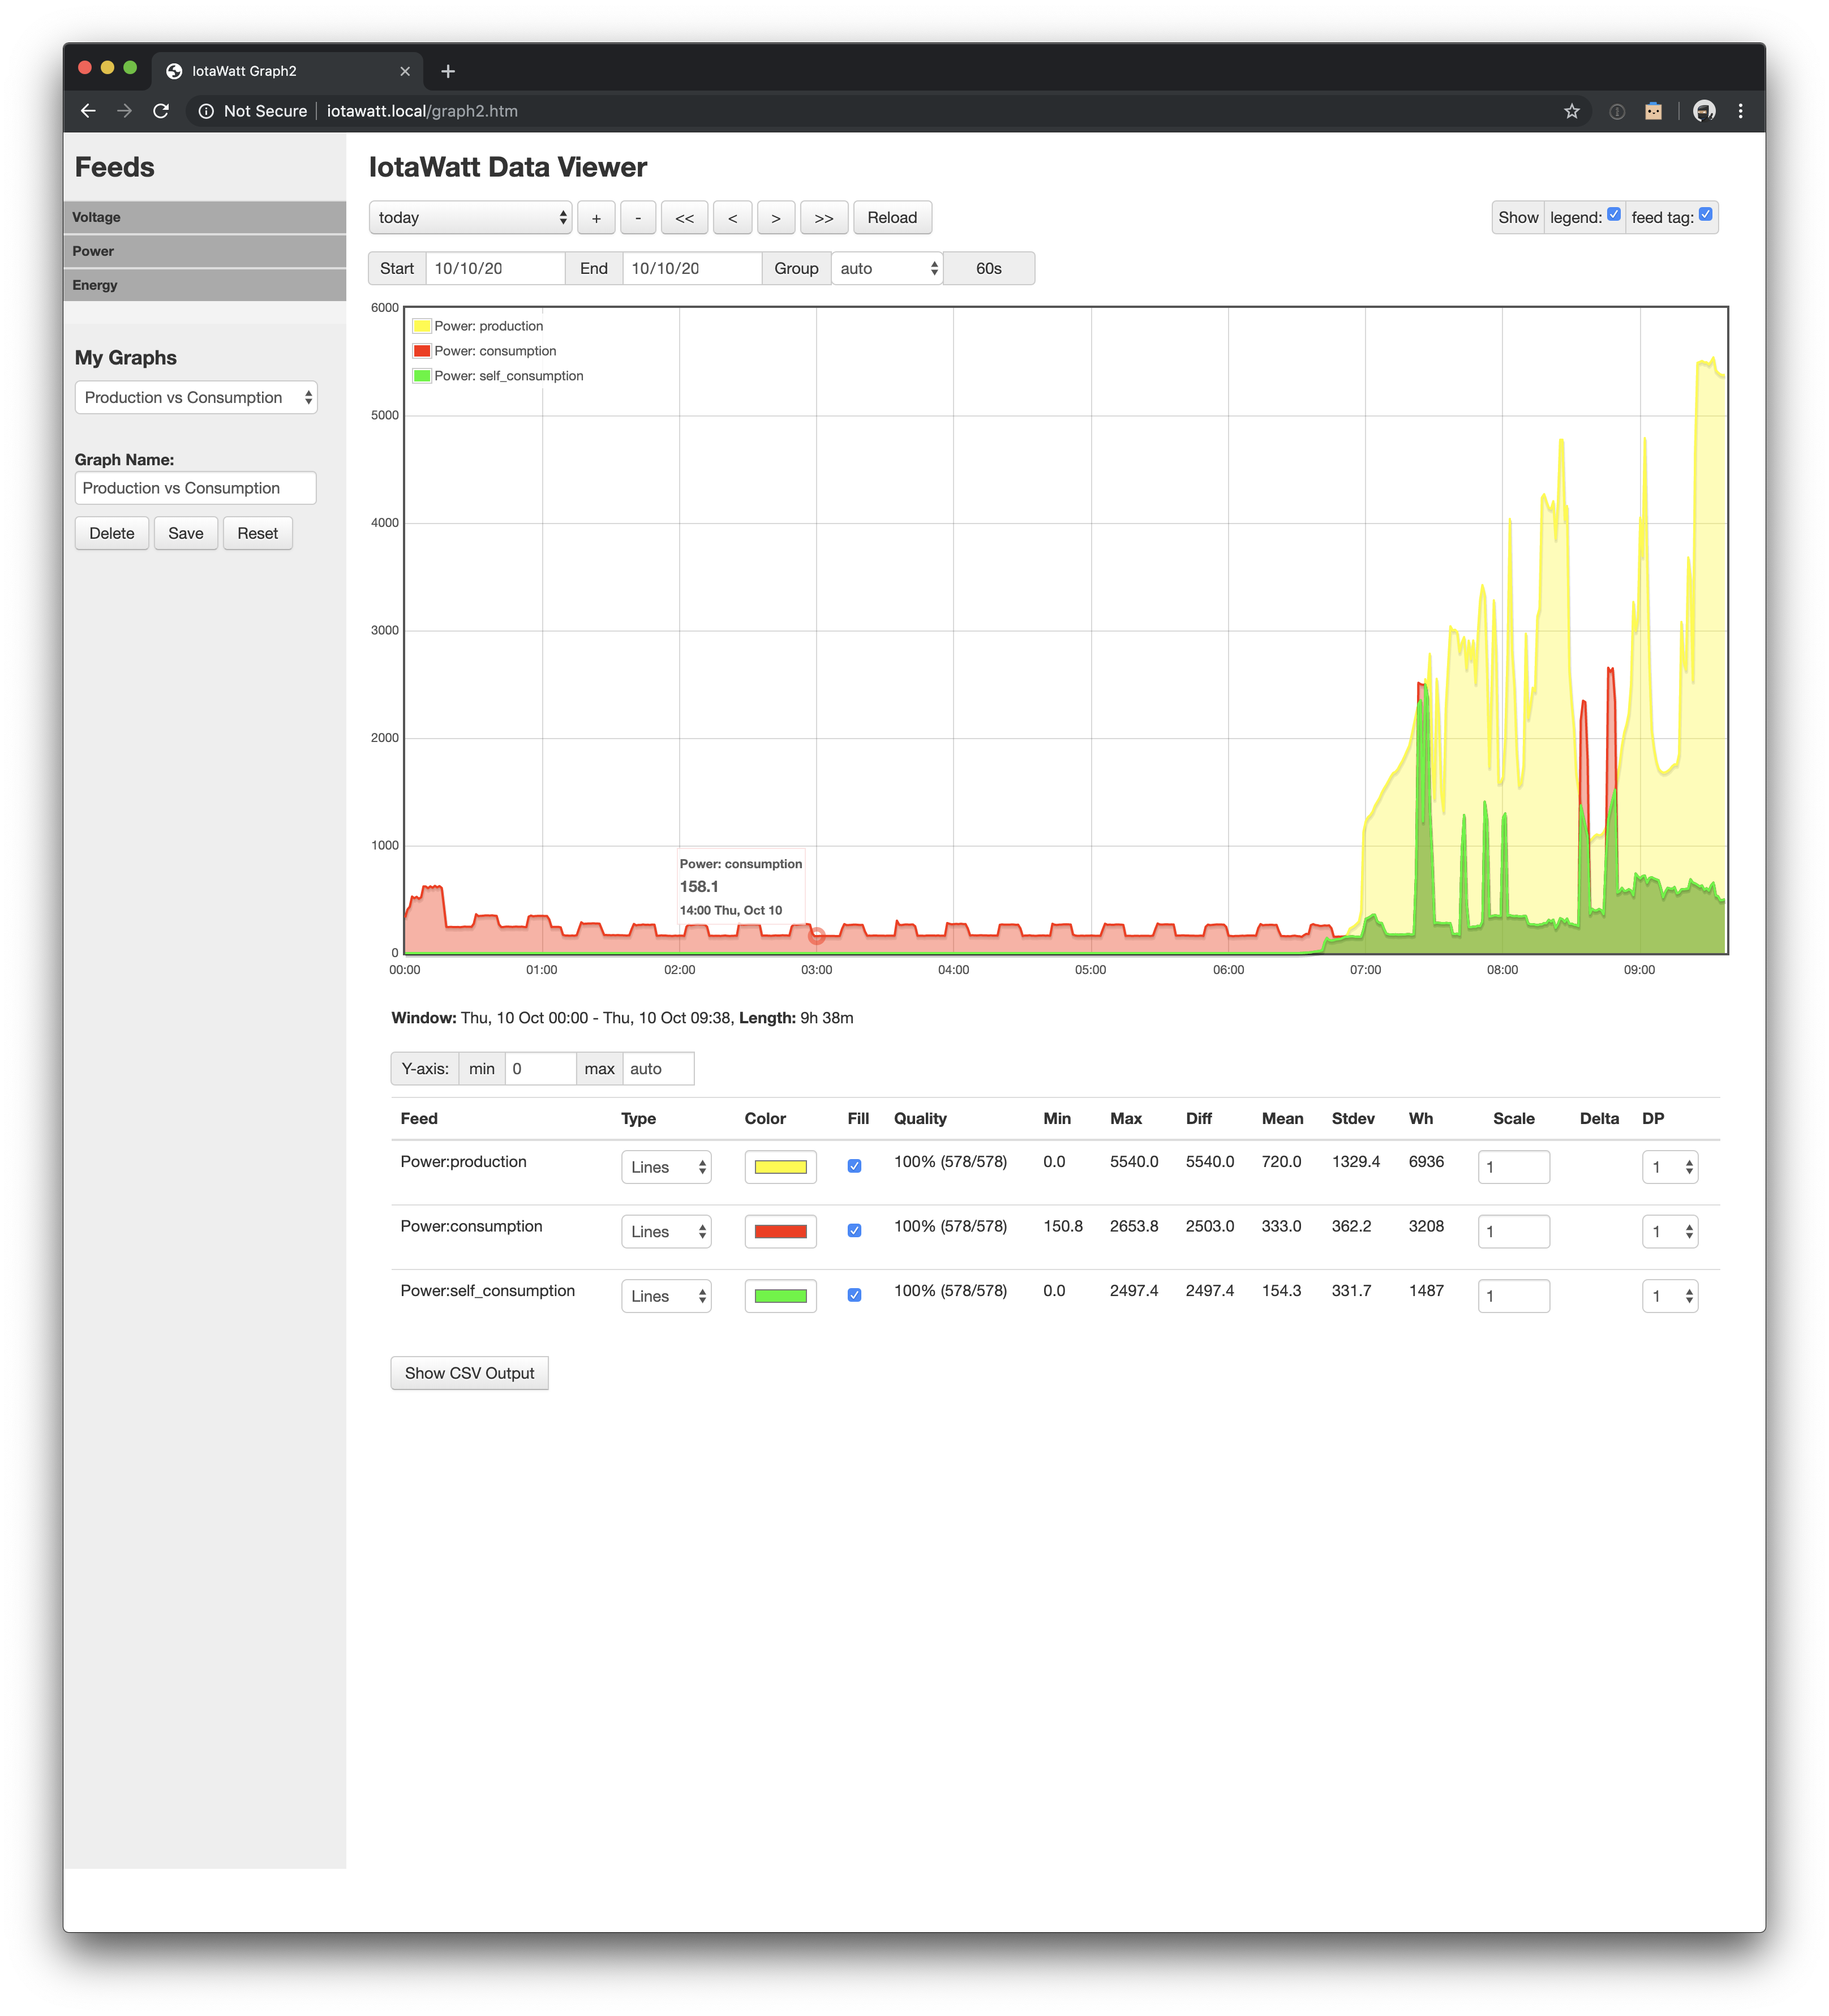
Yep, I set the time to +10 and ticket daylight savings time in the IoTaWatt setup. The X axis is showing the correct time and the plot point is showing the future (UTC plus 22).
The plot point should match the x-axis. Can I see a screenshot of everything - the start and end dates, the graph, and the tooltip?
Here’s a screenshot of everything. The time is 9:39 AM (AEDT) now so the x-axis is correct. The tooltip is showing 11 hours ahead of local time.
Sorry, I didn’t realize that was the original graph program. I’ve been working on Graph+ for so long I misread the post. I’m not surprised the tooltip is wrong in that application. Graph+ seems stable and not a lot of feedback one way or the other. Going forward, I’ll only fix problems with that.
I expect to put it in BETA next week. It’s a big improvement, especially how it deals with time.