Do I need or want Telegraf when collecting data from IoTaWatt? I built a TIG stack in my home lab to monitor multiple metrics as well as data from IoTaWatt. First, I understand that (T)elegraf is the agent that sends data, (I)nfluxDB is the DB archiving the information and (G)rafana is for visualization.
Since Grafana is fairly complex, yet a very capable tool I decided I would take a Udemy course to understand it a little better. In most examples throughout the course and during general research when InFluxDB was used as a datasource, Telegraf is almost always used for versatility regarding the method of data collection.
My question is why does it appear to be missing from examples and discussions regarding IoTaWatt. Can anyone explain the benefits or drawbacks of using it alone or in a mixed influx environment. Does it present limitations or just complicate the setup without providing much benefit?
Cannot speak to the features you may find useful in Telegraf, but strictly speaking, IoTaWatt uploads directly to influxDB (1.8) using the HTTP Line Protocol, so Telegraf is not necessary.
Thanks… I am able to connect to the InfluxDB from grafana(same localhost) when setting up a datasource but I do not get any data.
iotawatt is on the same local network. I have tried using the hostname.domain.tld as well as the IP address with and without the port specified at the end of the URL.
I confirmed there was no data from the InfluxDB CLI
use iotawatt
Using database iotawatt
SHOW MEASUREMENTS ON iotawatt
…
SHOW MEASUREMENTS ON _internal
name: measurements
name
cq
database
httpd
queryExecutor
runtime
shard
subscriber
tsm1_cache
tsm1_engine
tsm1_filestore
tsm1_wal
write
Please post the recent message log.
I see quite a bit regarding its inability to contact an NTP server. Is the address hardcoded? I do not remember seeing a setting I could modify for this. It is most likely being blocked by our Firewall. Is this the reason for the reboots? Would this cause the issue or is this a separate problem?
** Restart **
SD initialized.
Real Time Clock not initialized.
Reset reason: Software/System restart
Trace: 109:2, 125:91[105], 202:55[51], 61:118[55], 23:246, 153:191[161], 230:208[22], 87:215[207], 245:20[62], 163:76[215], 223:33[216], 247:225[95], 138:212[26], 46:145[187], 17:192[172], 16:219[29], 27:101[62], 89:33[104], 138:175[94], 25:115[93], 223:231[2], 156:99[228], 124:172[107], 253:255[218], 57:6[170], 134:212[34], 215:134[201], 130:98[75], 24:202[224], 68:15[16], 118:225[38], 207:109[57]
ESP8266 ChipID: 6144631
IoTaWatt 5.0, Firmware version 02_05_08
SPIFFS mounted.
Local time zone: +0:00
device name: IotaWatt
Connecting with WiFiManager.
** Restart **
SD initialized.
Real Time Clock not initialized.
Reset reason: External System
Trace: 101:2[128], 125:91[105], 202:55[51], 61:118[63], 7:126, 145:63[161], 230:208[22], 87:214[142], 245:20[62], 163:76[227], 223:1[208], 255:225[95], 138:212[11], 42:129[171], 81:208[172], 16:219[29], 19:101[60], 89:161[104], 138:175[118], 25:115[93], 223:231[10], 156:99[228], 124:172[111], 253:251[214], 57:6[170], 134:212[34], 199:135[201], 130:50[75], 27:202[225], 68:15[16], 118:225[38], 207:109[41]
ESP8266 ChipID: 6144631
IoTaWatt 5.0, Firmware version 02_05_08
SPIFFS mounted.
Local time zone: +0:00
device name: IotaWatt
Connecting with WiFiManager.
RTC not running, waiting for WiFi.
** Restart **
SD initialized.
Real Time Clock not initialized.
Reset reason: Power on
Trace: 97:2[133], 125:219[107], 202:55[51], 61:246[183], 23:246, 25:191[169], 238:208[86], 87:220[143], 245:16[62], 160:204[215], 223:1[220], 244:229[31], 138:196[27], 44:129[179], 81:193[140], 16:219[29], 19:101[30], 89:161[108], 138:175[94], 25:115[89], 223:231[2], 156:99[228], 118:172[111], 253:255[222], 57:6[154], 134:212[34], 199:130[205], 130:58[75], 26:202[224], 68:15[16], 118:225[38], 223:109[57]
ESP8266 ChipID: 6144631
IoTaWatt 5.0, Firmware version 02_05_08
SPIFFS mounted.
Local time zone: +0:00
device name: IotaWatt
Connecting with WiFiManager.
RTC not running, waiting for WiFi.
HTTP server started
WiFi connected. SSID=HA3, IP=192.168.1.xxx, channel=11, RSSI -85db
MDNS responder started for hostname IotaWatt
LLMNR responder started for hostname IotaWatt
timeSync: service started.
statService: started.
Updater: service started. Auto-update class is MINOR
Updater: Unrecognized auto-update class MINOR.
New passwords saved.
WiFi disconnected.
WiFi connected. SSID=HA3, IP=192.168.1.xxx, channel=11, RSSI -83db
WiFi disconnected.
WiFi connected. SSID=HA3, IP=192.168.1.xxx, channel=1, RSSI -82db
WiFi disconnected.
WiFi connected. SSID=HA3, IP=192.168.1.xxx, channel=11, RSSI -81db
WiFi disconnected.
WiFi connected. SSID=HA3, IP=192.168.1.xxx, channel=11, RSSI -81db
WiFi disconnected.
WiFi connected. SSID=HA3, IP=192.168.1.xxx, channel=11, RSSI -84db
WiFi disconnected.
WiFi connected. SSID=HA3, IP=192.168.1.xxx, channel=11, RSSI -84db
timeSync: No time update in last 24 hours.
WiFi disconnected.
WiFi connected. SSID=HA3, IP=192.168.1.xxx, channel=11, RSSI -87db
WiFi disconnected.
WiFi connected. SSID=HA3, IP=192.168.1.xxx, channel=11, RSSI -87db
WiFi disconnected.
WiFi connected. SSID=HA3, IP=192.168.1.xxx, channel=11, RSSI -87db
WiFi disconnected.
WiFi connected. SSID=HA3, IP=192.168.1.xxx, channel=11, RSSI -87db
WiFi disconnected.
WiFi connected. SSID=HA3, IP=192.168.1.xxx, channel=11, RSSI -86db
WiFi disconnected.
WiFi connected. SSID=HA3, IP=192.168.1.xxx, channel=11, RSSI -85db
WiFi disconnected.
WiFi connected. SSID=HA3, IP=192.168.1.xxx, channel=1, RSSI -84db
WiFi disconnected.
WiFi connected. SSID=HA3, IP=192.168.1.xxx, channel=1, RSSI -82db
WiFi disconnected.
WiFi connected. SSID=HA3, IP=192.168.1.xxx, channel=1, RSSI -82db
timeSync: No time update in last 24 hours.
timeSync: No time update in last 24 hours.
timeSync: No time update in last 24 hours.
timeSync: No time update in last 24 hours.
timeSync: No time update in last 24 hours.
timeSync: No time update in last 24 hours.
timeSync: No time update in last 24 hours.
timeSync: No time update in last 24 hours.
timeSync: No time update in last 24 hours.
timeSync: No time update in last 24 hours.
timeSync: No time update in last 24 hours.
timeSync: No time update in last 24 hours.
timeSync: No time update in last 24 hours.
timeSync: No time update in last 24 hours.
timeSync: No time update in last 24 hours.
WiFi disconnected.
WiFi connected. SSID=HA3, IP=192.168.1.xxx, channel=11, RSSI -87db
WiFi disconnected.
WiFi connected. SSID=HA3, IP=192.168.1.xxx, channel=11, RSSI -84db
timeSync: No time update in last 24 hours.
timeSync: No time update in last 24 hours.
timeSync: No time update in last 24 hours.
timeSync: No time update in last 24 hours.
timeSync: No time update in last 24 hours.
timeSync: No time update in last 24 hours.
WiFi disconnected.
WiFi connected. SSID=HA3, IP=169.254.120.194, channel=11, RSSI -90db
WiFi disconnected.
WiFi connected. SSID=HA3, IP=192.168.1.xxx, channel=11, RSSI -87db
Updater: Invalid response from server. HTTPcode: -11
timeSync: No time update in last 24 hours.
That is probably your problem. The IoTaWatt is monitoring power but not recording the measurements in the datalog because it doesn’t know what time it is. IoTaWatt uses the google timeservers at time.google.com.
So allowing NTP requests to time.google.com fixed the reboot issue and now I see data in influxdb but …
I am now seeing data showup in the influxdb database but I am having trouble finding arrive in the the dashboard that I imported.
select * from ReefTank
name: ReefTank
time Watts ct device units
1591975310000000000 49.27 ReefTank IotaWatt Watts
1591975320000000000 73.66 ReefTank IotaWatt Watts
1591975460000000000 55.68 ReefTank IotaWatt Watts
1591975470000000000 76.91 ReefTank IotaWatt Watts
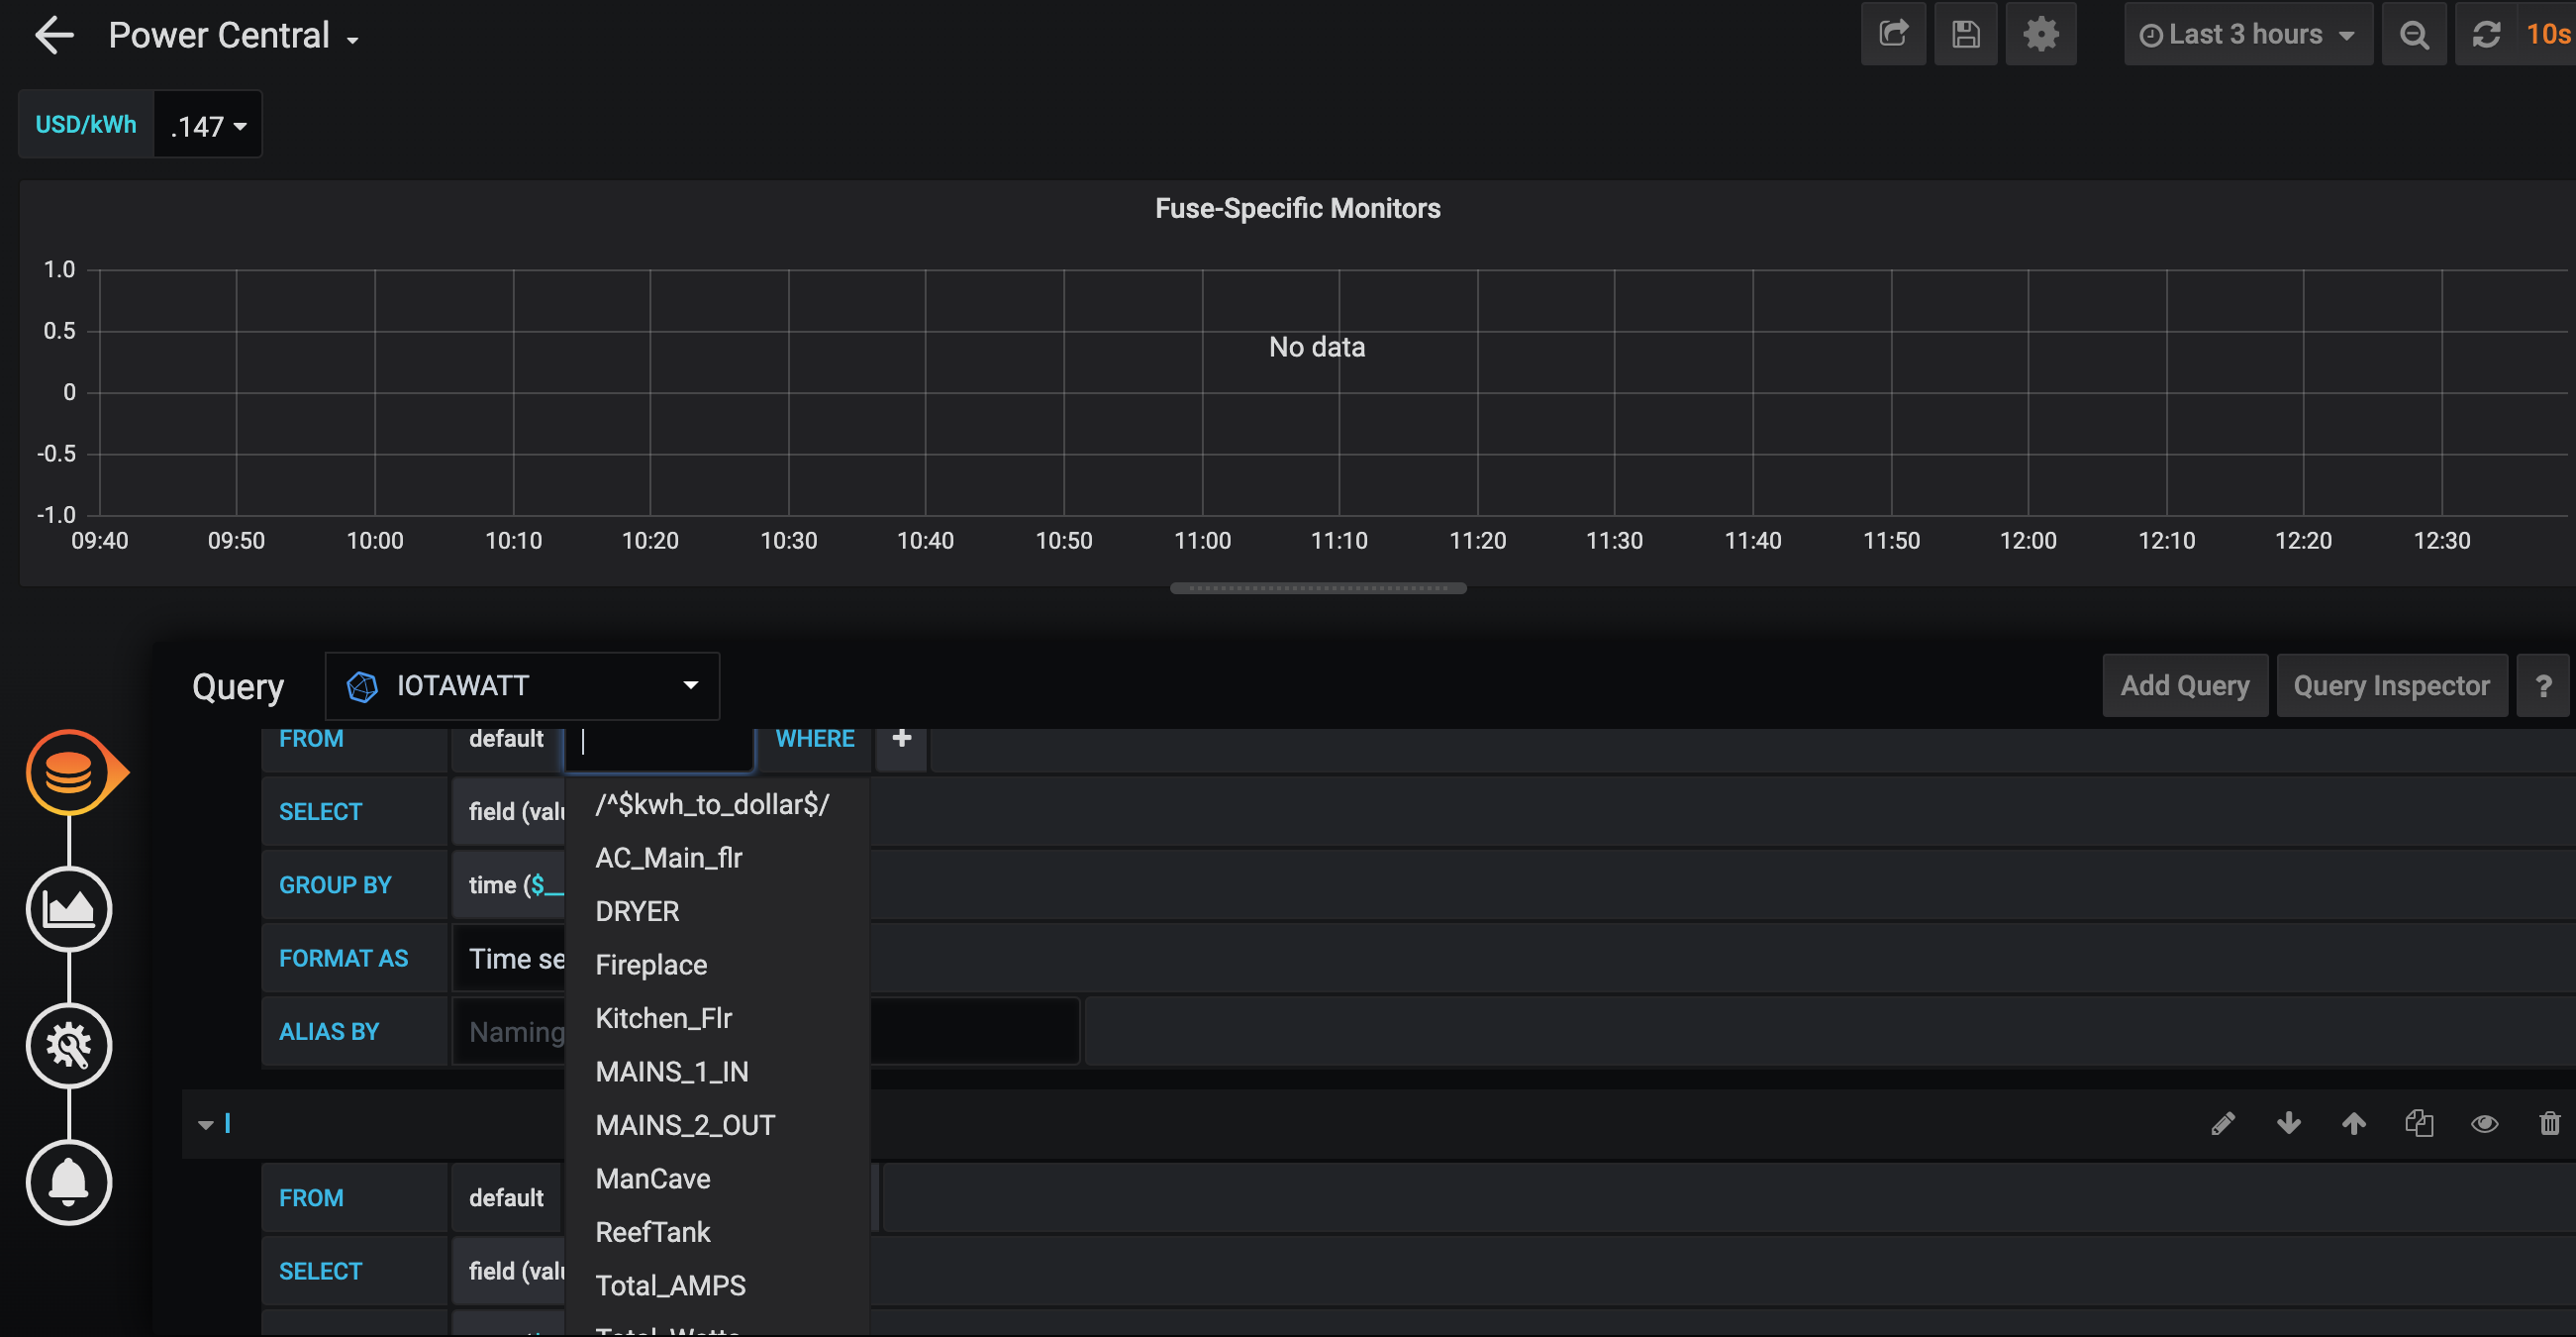
In the dashboard…
Tables show up but the graph still says no data
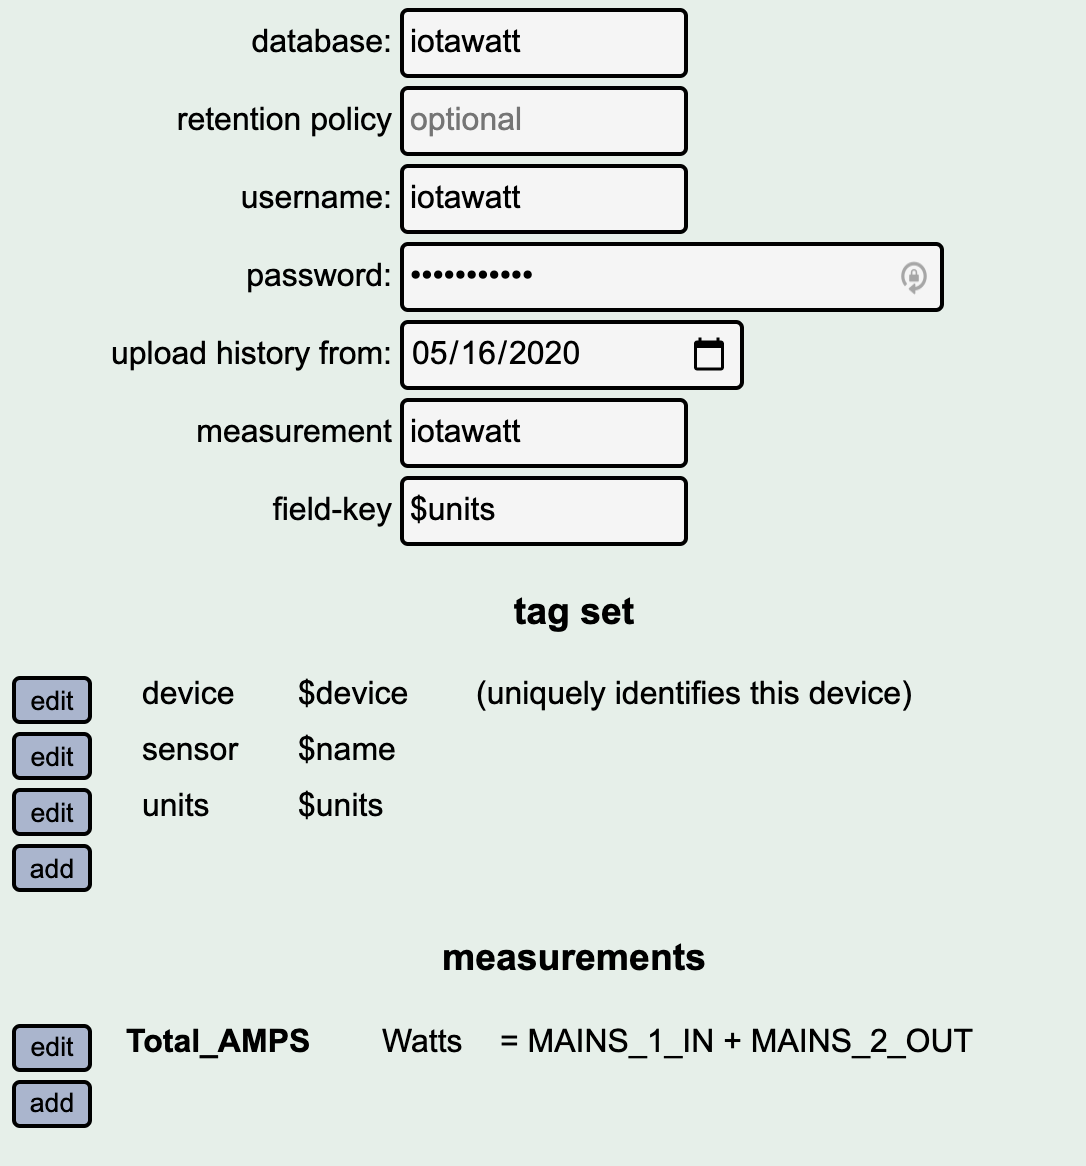
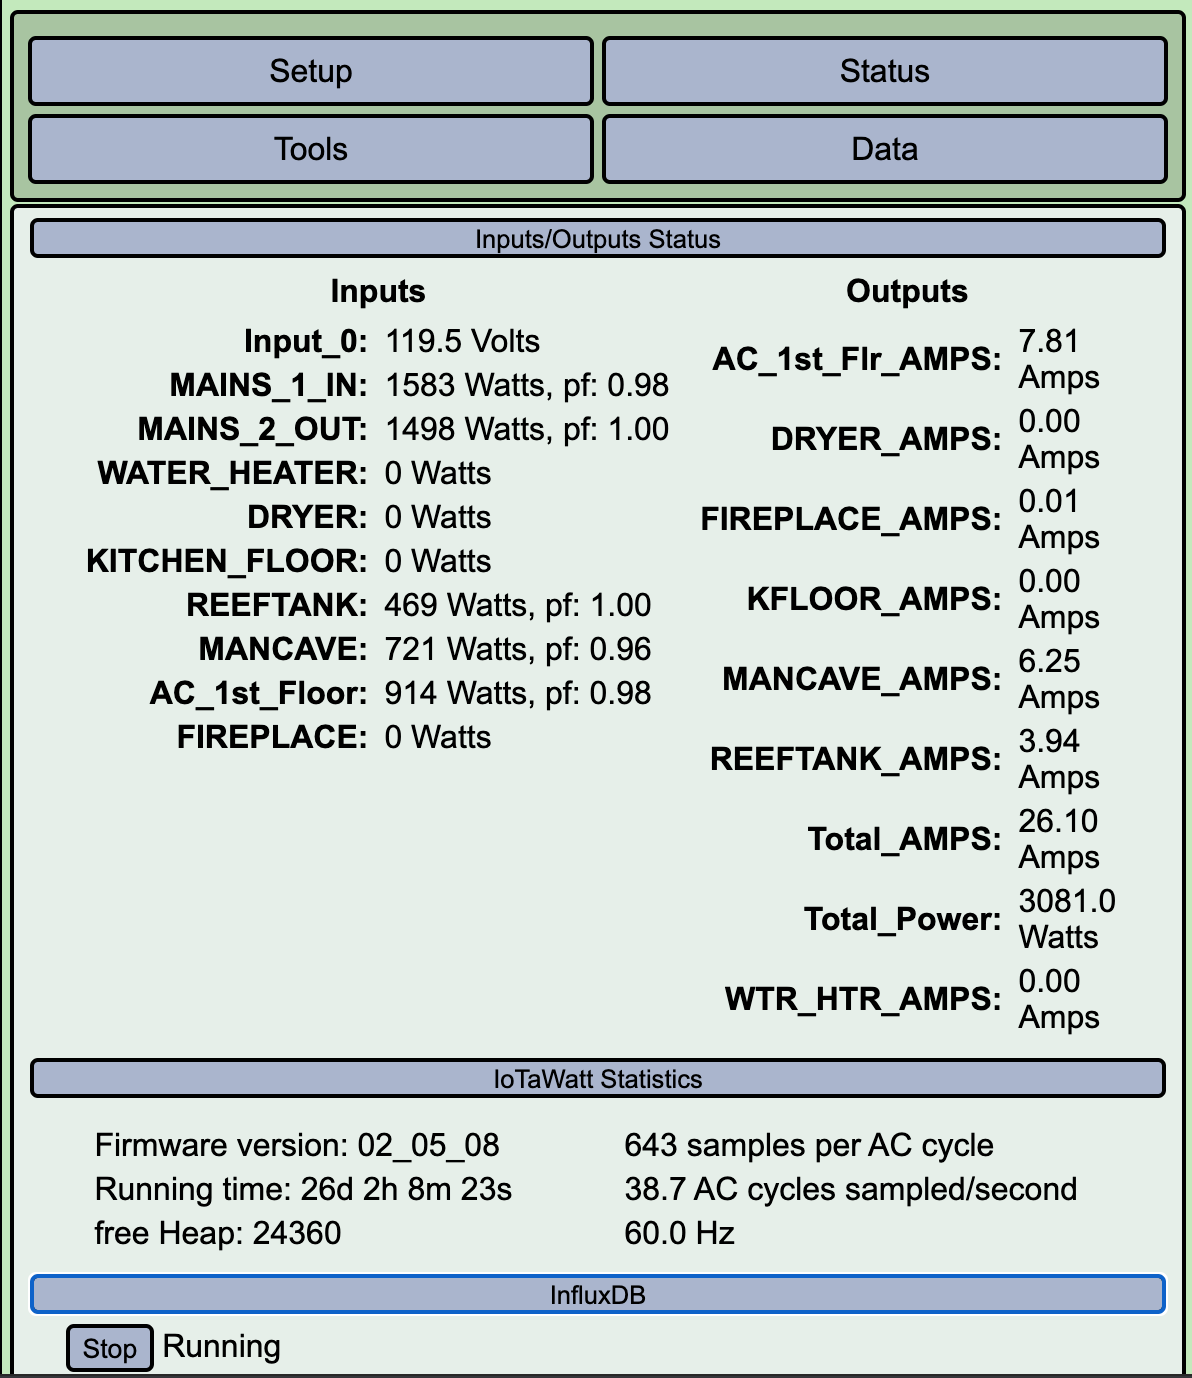
This is what I have configured.
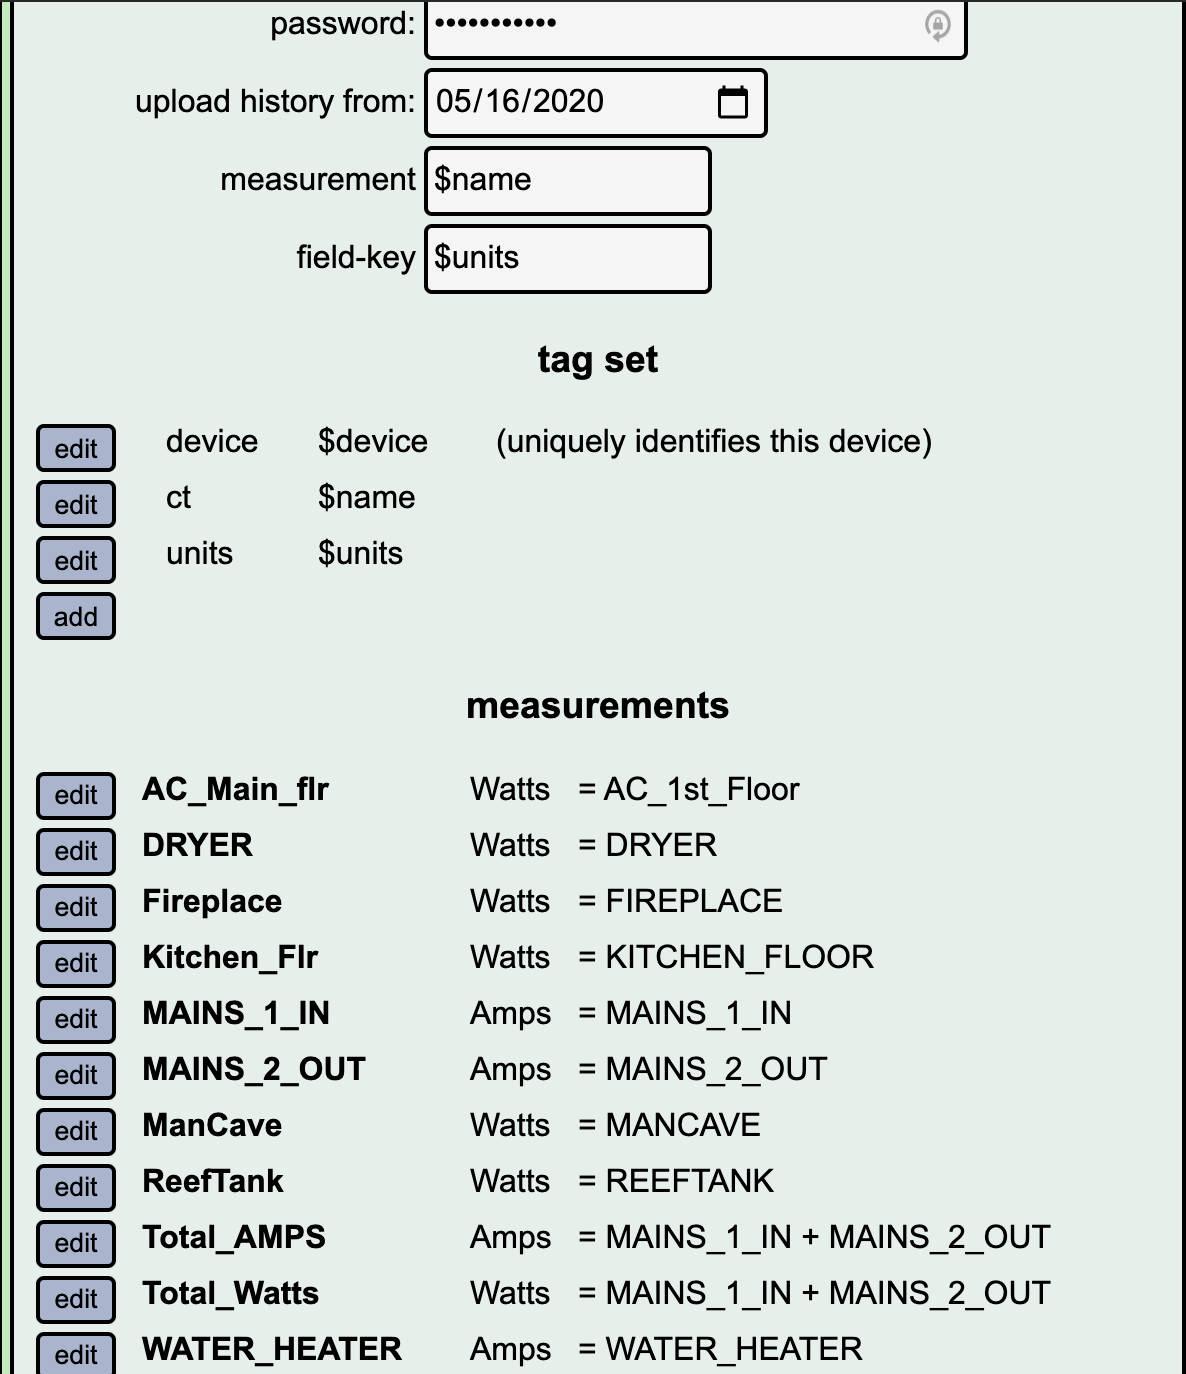
At this point IoTaWatt appears to be posting the data as specified. There is a lot of good documentation and forums for both influxDB and grafana. I’m really not a wiz at it. One thing I can partially see under the dropdown is that you appear to be selecting the field-key “val…?” - probably “value”. Your setup is using a field key $units which translates to ‘Watts’ in most of your measurements.
If you click the Query Inspector" you will see the query that grafana produces and the response that it gets from influxDB. Yours is a more complicated upload than I would use. Presumably you have good reasons for doing it that way. Solving these issues is a great way to learn and usually pays off later as you use it more. Give a man a fish, teach a man to fish…
Yes, the dashboard is something Bob created and agreed to share his JSON.
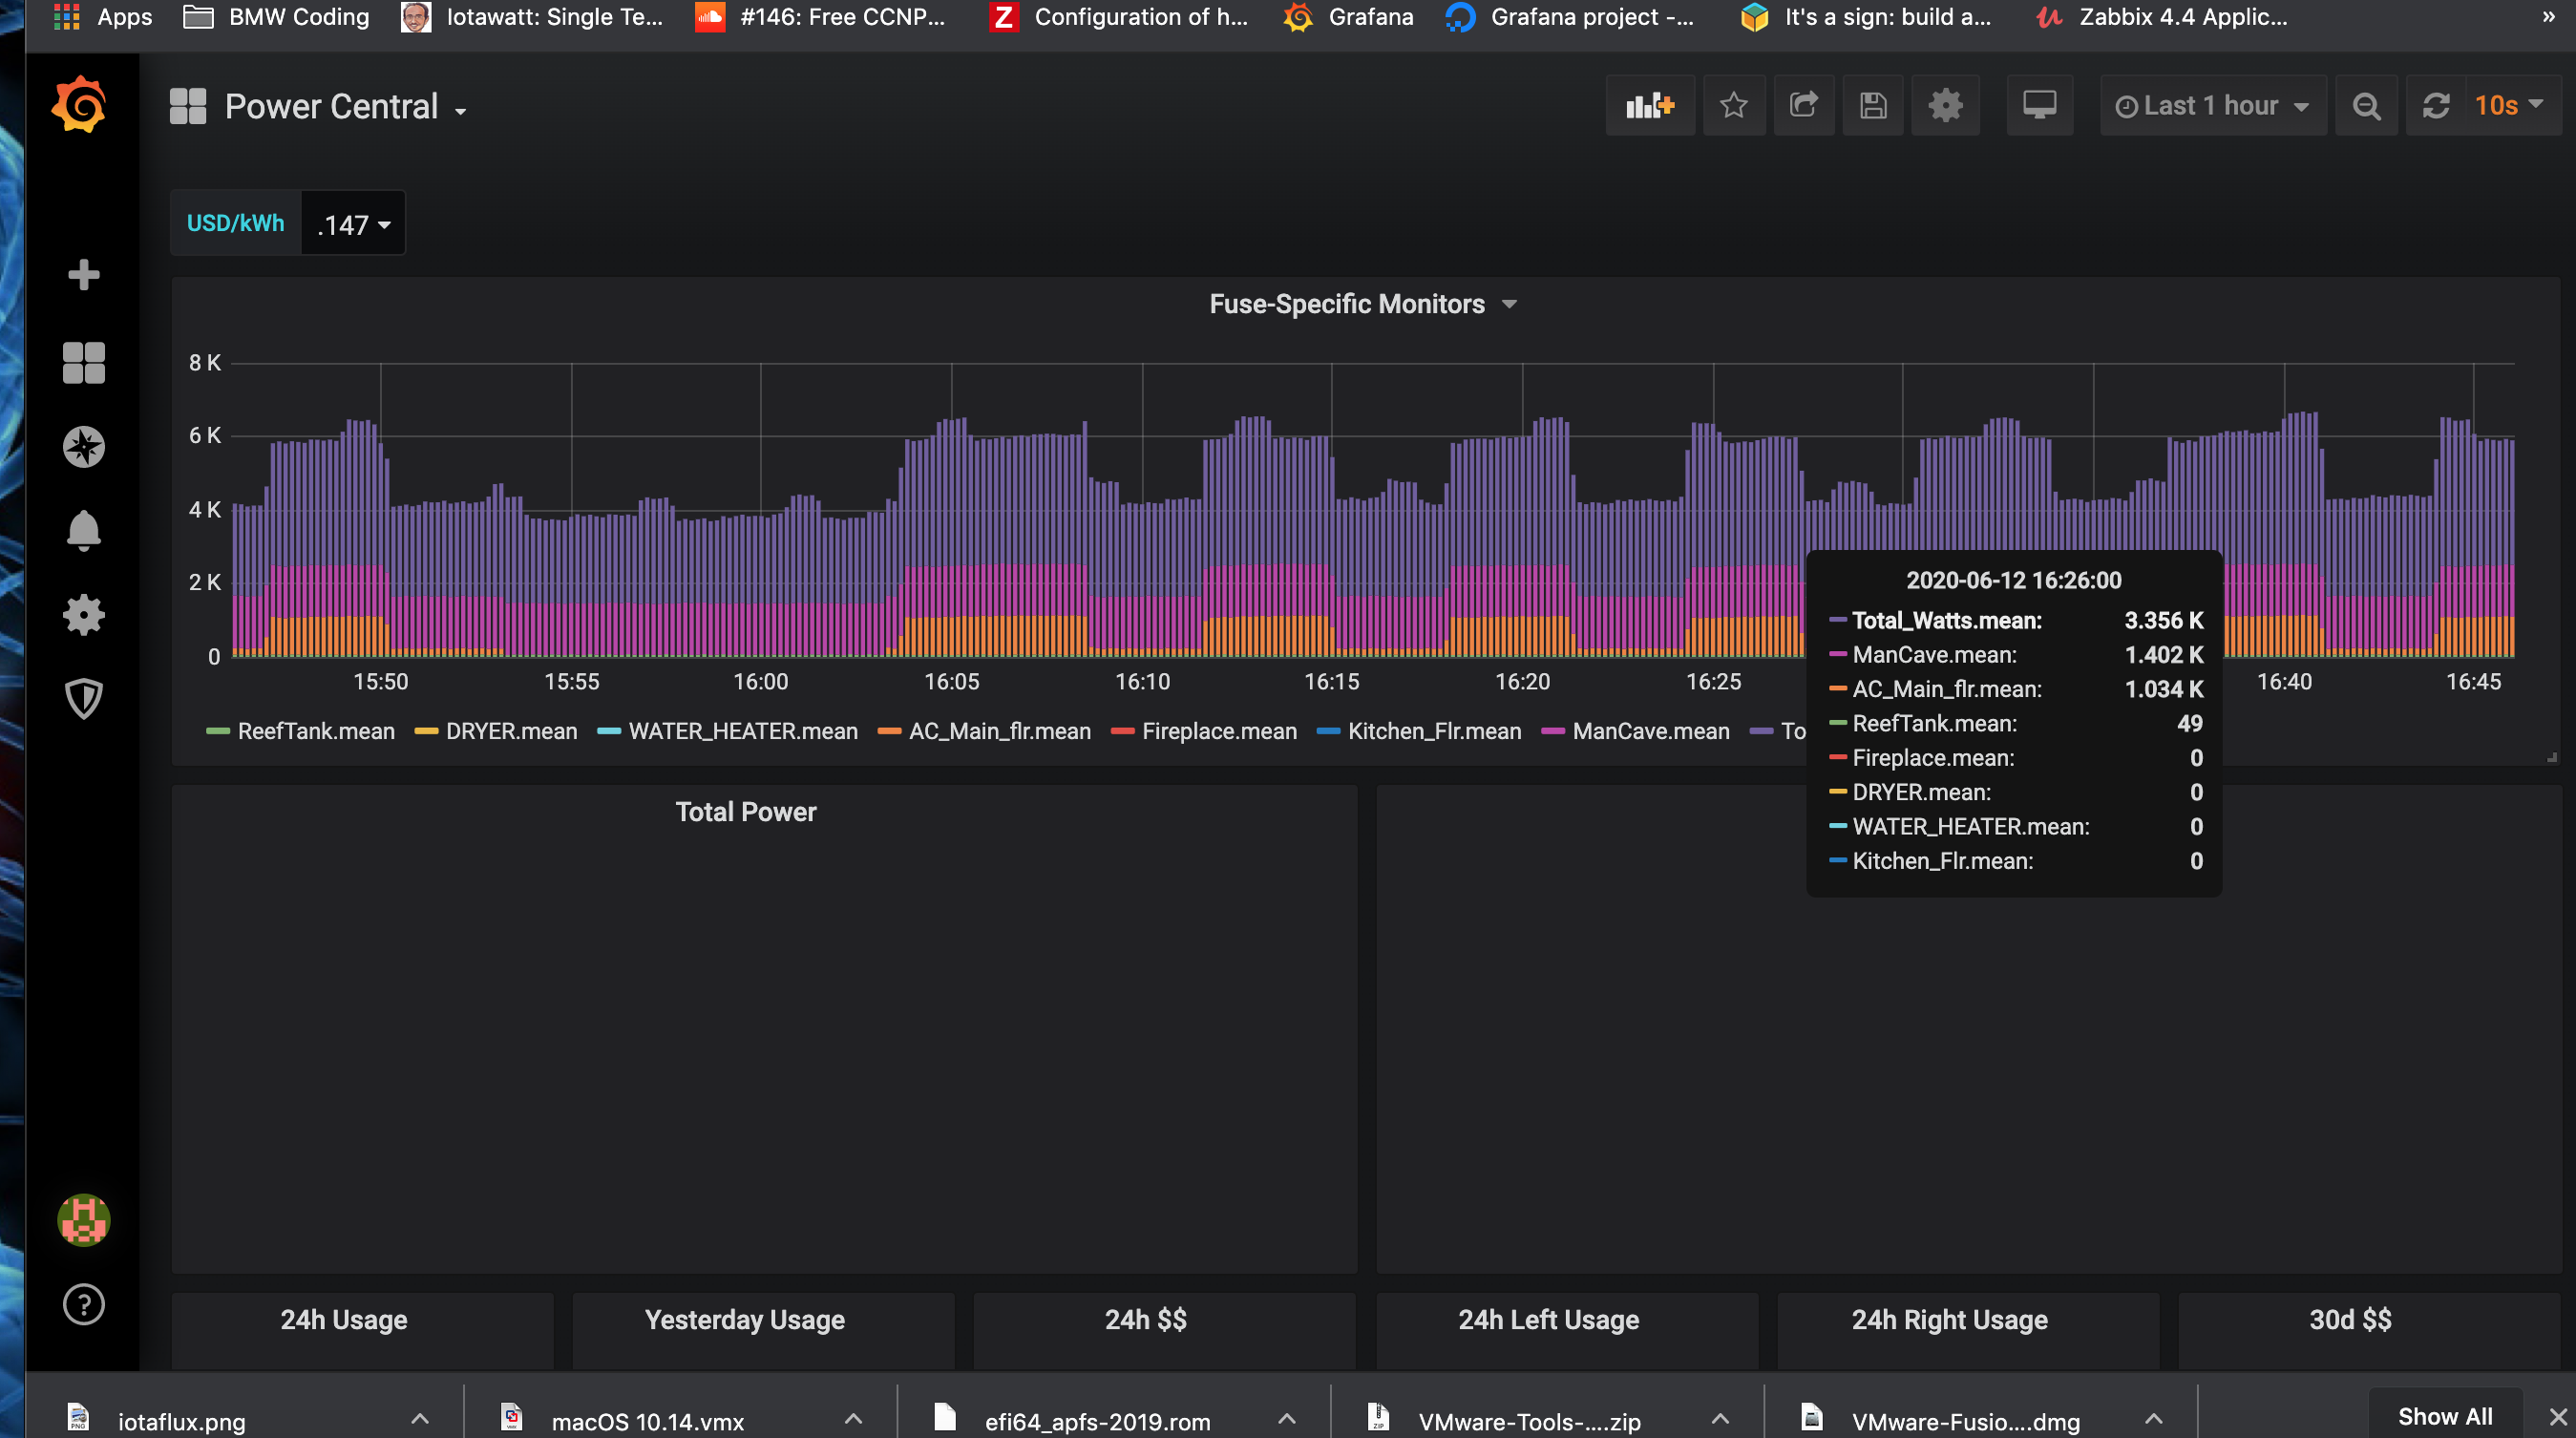
I am trying to create this…
I successfully imported the JSON and apparently the data but something isn’t lining up.
Mostly working now…Yeah. default is value…did not get that at first.
Looking at that thread, I think @matt shared that json.
Looks like you’re on your way.
Yes it was Matt but shared in the Bob’s Blog thread. Thanks, you have a great product.