Hi! I’m getting an issue where my Import Energy graph is going up and down, which seems odd. Since it is split into import and export, I woud think import should only ever go up (otherwise it is an export).
I’ve undoubtedly misconfigured something or misunderstanding it, but I can’t figure out exactly what.
I have a solar CT, which goes up during the middle of the day, and down to zero at night (of course).
I have a mains CT, which correctly shows power use including the solar - i.e. it drops or goes negative when the solar is high, goes positive when solar is low.
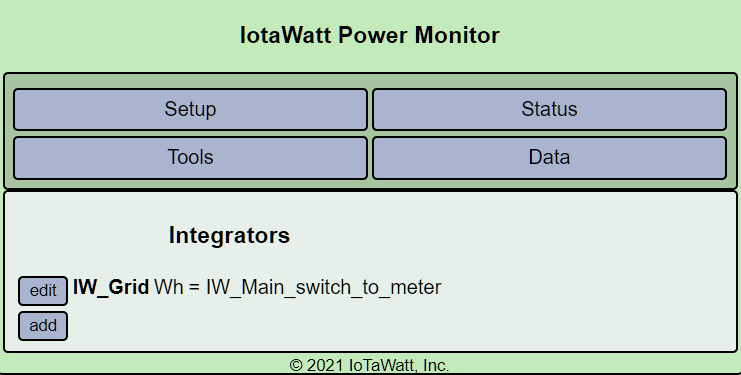
From that, I’ve created an integration.
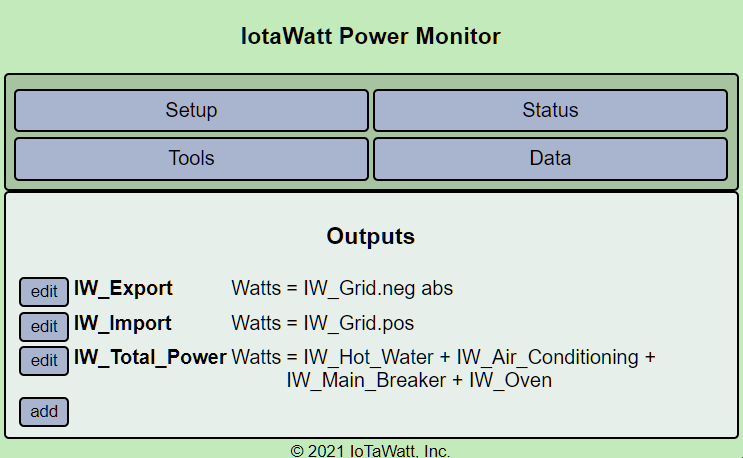
From the integration, I’ve created an import and export Output (import is grid.pos, export is grid.neg abs).
These appear to be ok when viewing power use, with the Import showing power use dropping to zero when solar is on, and the export also positive when solar is high and zero at other times.
However the issue is when viewing Energy in either Graph+ (wh) or original graph (Energy). For other CTs which don’t take solar into account (i.e. Hot Water or Oven) they continually climb as expected. The Import one however goes up AND down. The Export one stays at zero.
Can you post your integrator setup and your outputs setup please?
Thanks in advance for your help. It is most likely that I’ve messed up somewhere.
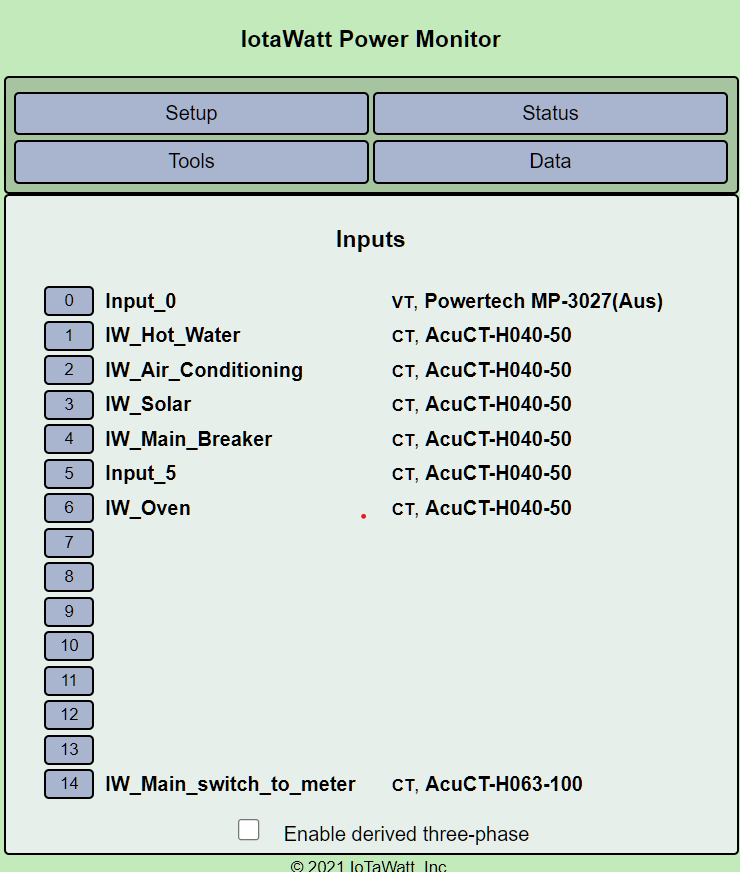
Inputs: (only 14 - main switch to meter and Solar are relevant to this issue)
Integrator:
Outputs:
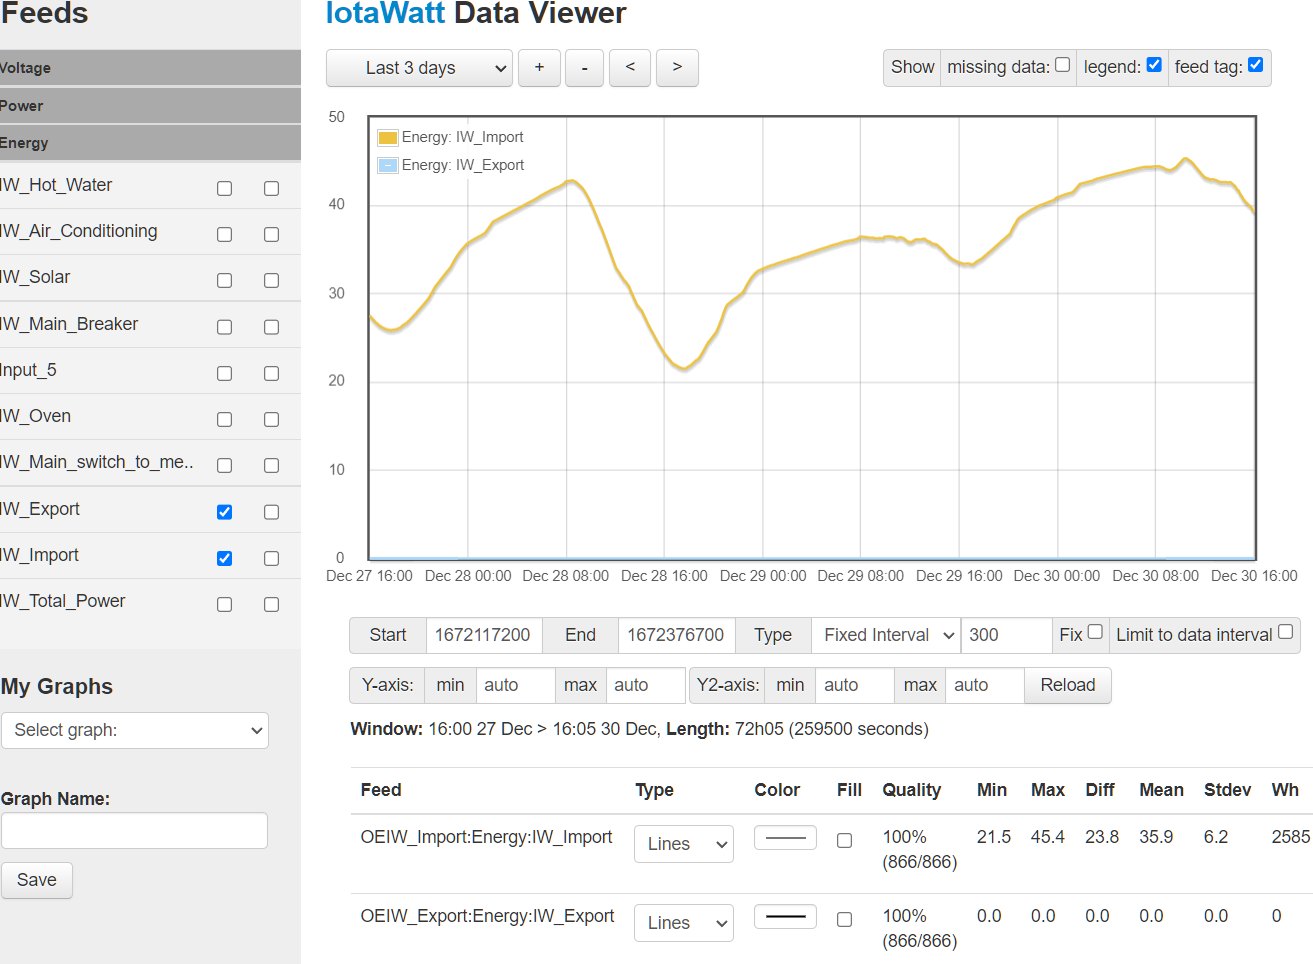
Example of what I mean from the Graph:
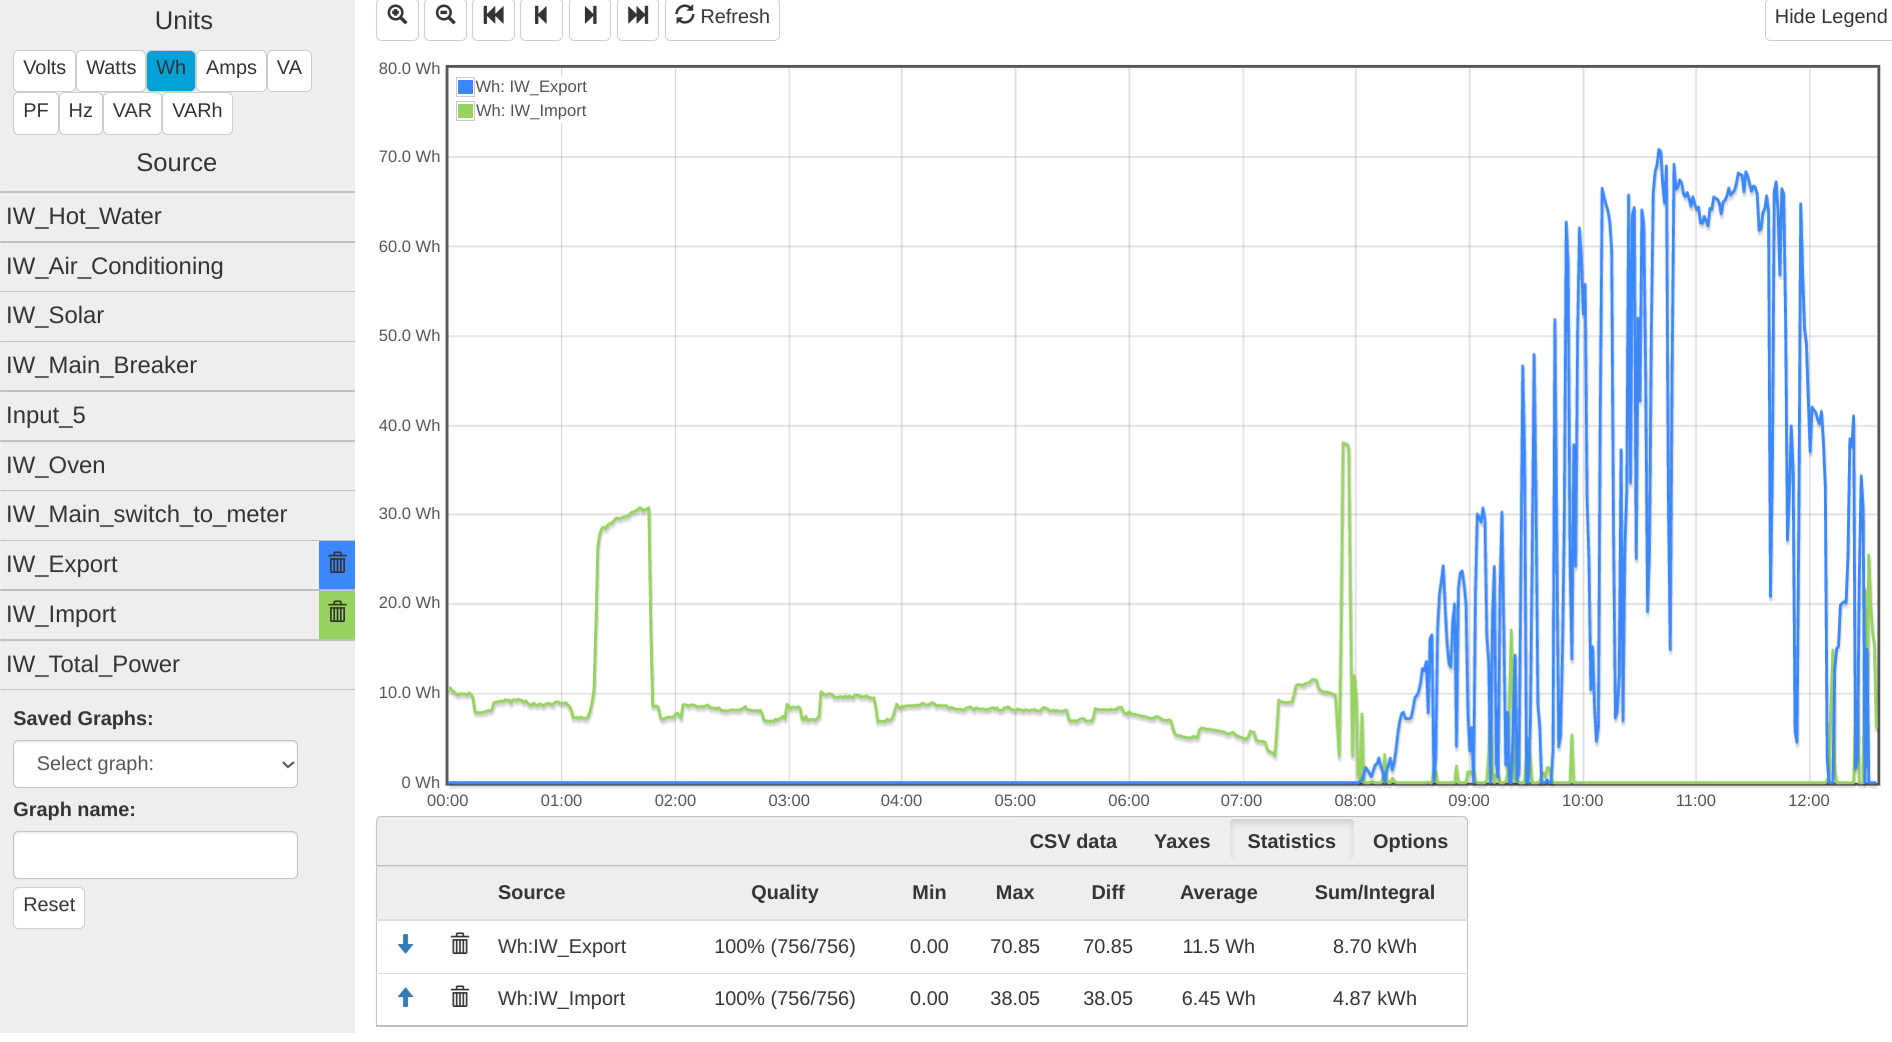
Can you plot watts for the main, solar and import for yesterday please using Graph+ and show the statistics tab with the plot?
Here you go. Thanks for the assistance.
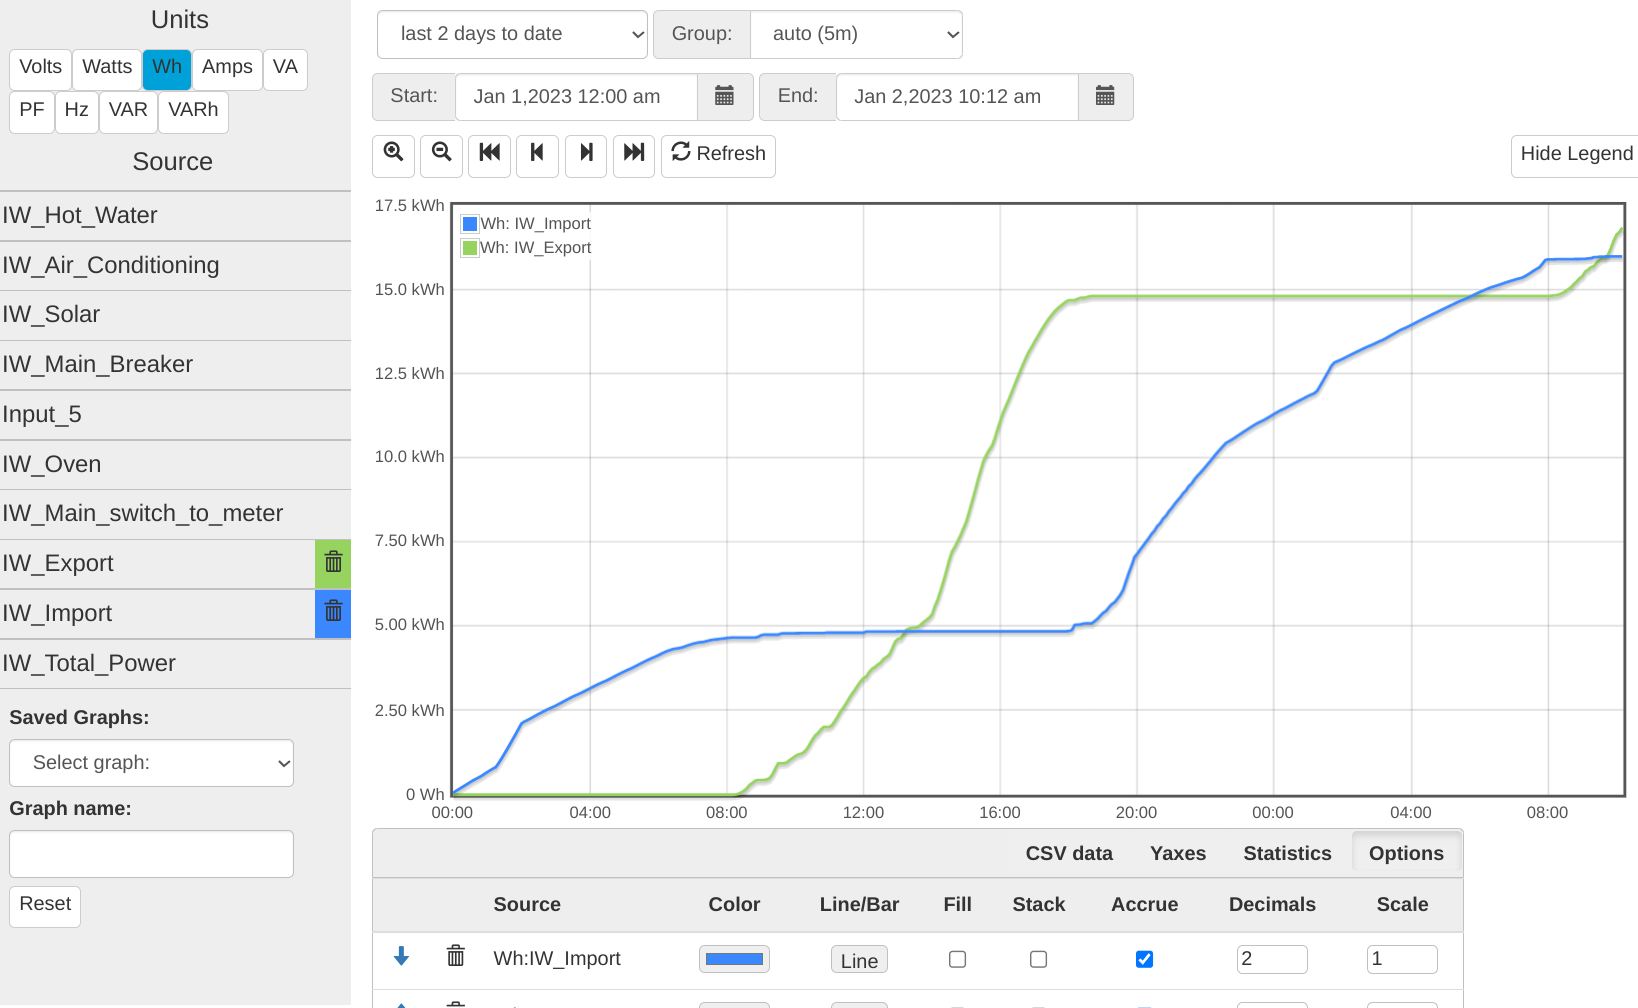
That looks OK, can you plot import and export WH for the last two days with “accrue” checked for both in the options tab?
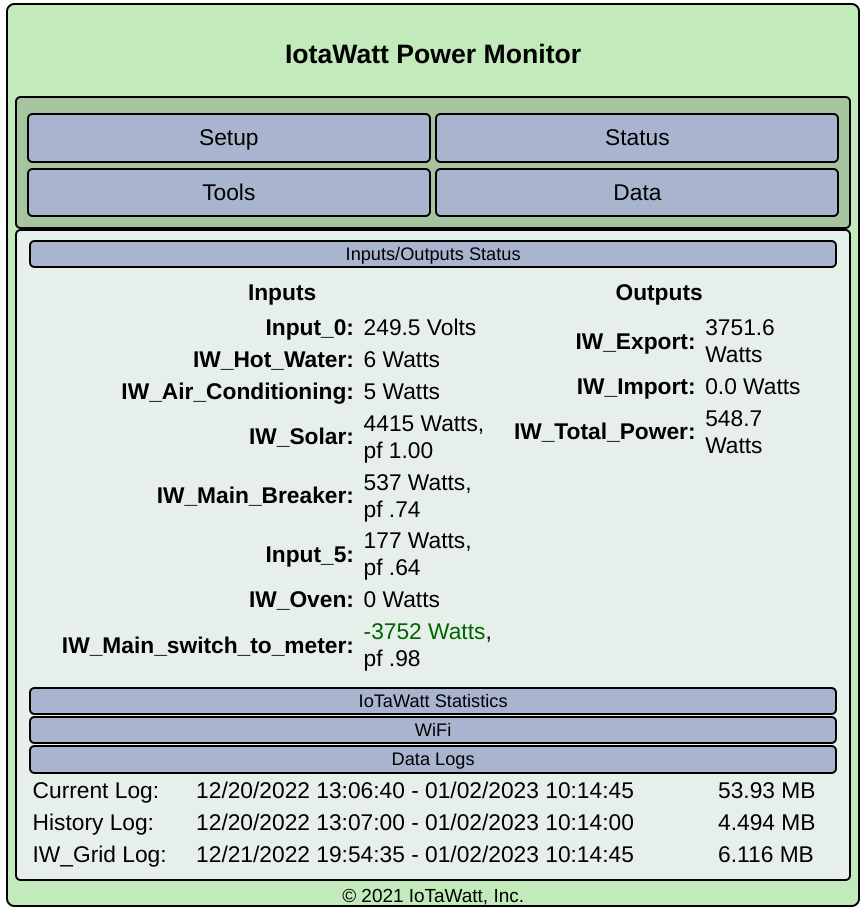
Also, the status display with the data logs tab expanded?
That looks pretty good. You imported until about 8am when the solar started to produce and it switched over to mostly export. About 6pm the solar tapered off and import started again. At 8am the next day it started all over again. Nothing is decreasing.
I can’t say why the old graph was going up and down. The truth is I haven’t done anything with it years since developing Graph+ with query. I should just remove it from the next release as it doesn’t do anything special and requires a whole different API in the firmware.
The import/export graph for Graph+ doesn’t seem to track energy for me either.
I assumed that Wh would track energy, however it just seems to mirror Watts rather than be cumulative. Maybe I’ve just misunderstood its purpose?
So what would be the best method to track cumulative energy use / generation or import/export over a day or a week? Or maybe that’s something better done by something external like Home Assistant?
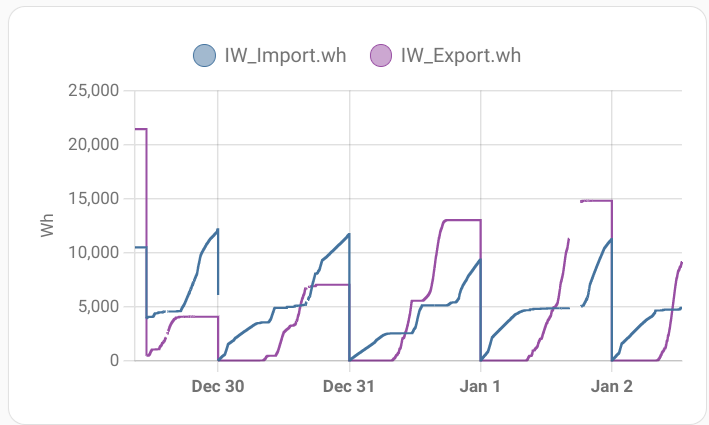
Funnily enough I just found that it seems to work as expected in Home Assistant:
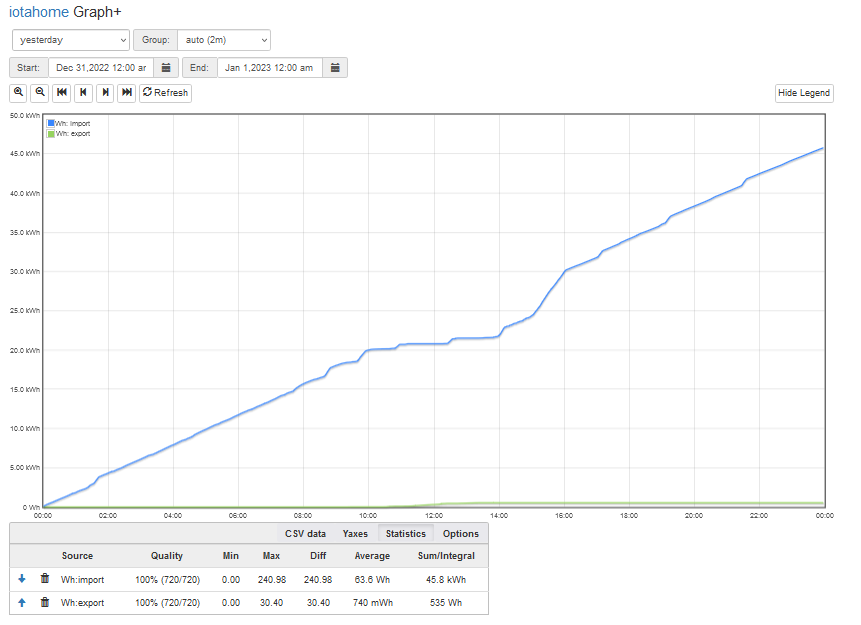
You just plotted Wh in each interval, which is probably every two minutes (you can see it in the Group parameter at the top which is not shown in your screenshot). In the previous plot you checked the accrue box under options which caused Graph+ to accrue the values throughout the plot, ending up with the total. My solar export is very little but you can see yesterday’s totals in the statistics at the bottom when I check accrue:
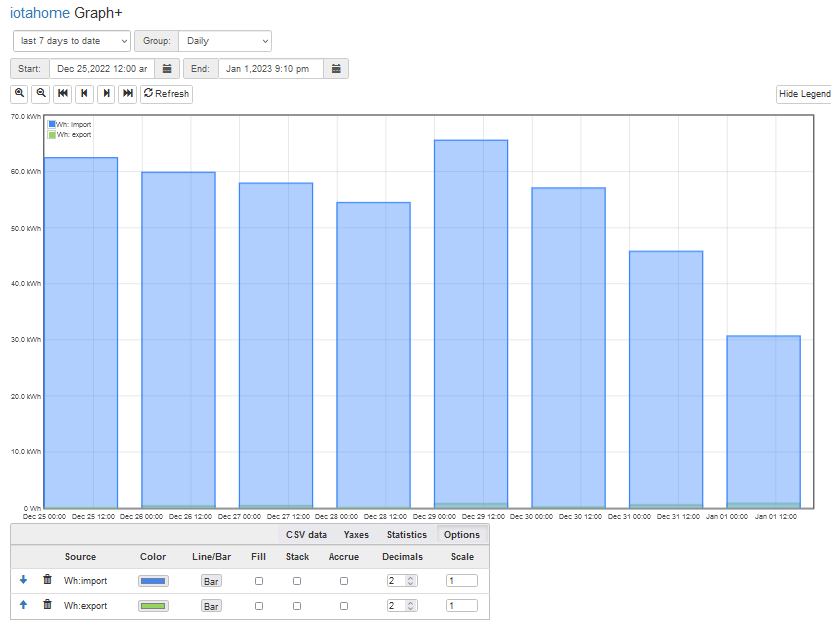
If I want to see the total import and export for the last 7 days, I can do this:
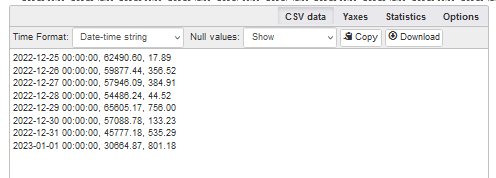
and if I click the CSV tab I’ll see the total import and export Wh for each day.
This method with Graph+ is more accurate and actually easier to use that HA once you understand it.
Ok so I was just misunderstanding the Graph+ setting, and now it makes perfect sense.
Thanks a lot for your outstanding support (and product)!