Not sure what you are looking for. I build the dashboards with their pretty easy GUI by defining a new dashboard, adding panels and editing the panels to specify the data to be graphed. Under the hood but visible are queries of influx that feed the individual panels. I’m no guru with this type of stuff, yet I found it was pretty easy to get basic results with a few hours of fooling with it.
By way of context, I upload IoTaWatt data to an instance of influx on a local Raspberry Pi. I have created a free grafana account at grafana.com and link that to my influxDB instance using my home IP and a port mapped to the influx query port.
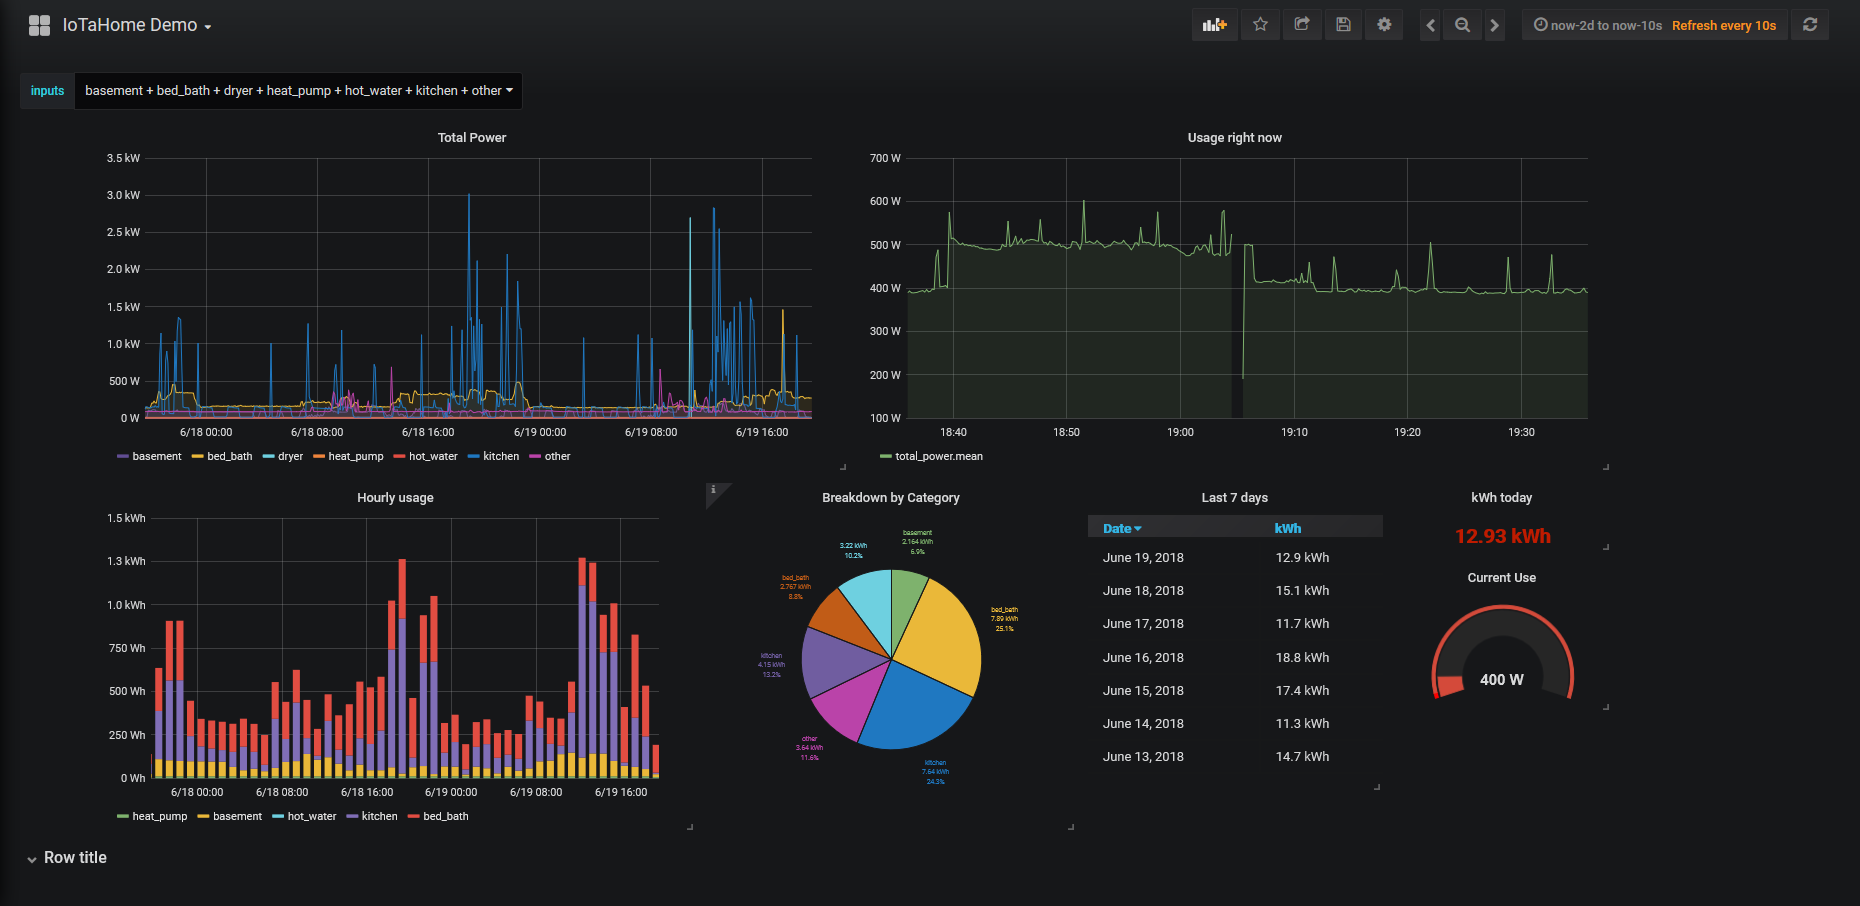
So here’s what the demo dashboard looks like:
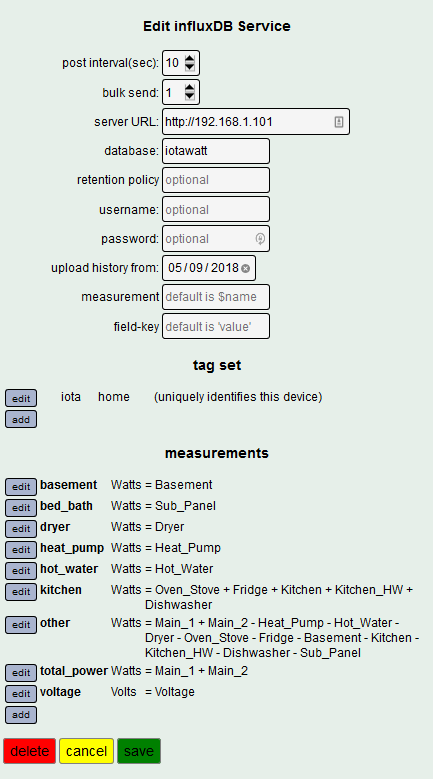
The IoTaWatt influx configuration looks like this:
Here are the details (edit) of the upper left panel:

Now if you still want code, Grafana will output it’s internal dashboard definition in Json, so here is that file:
IoTaHome Demo-1529450490310.json (22.8 KB)