Why do I add my solar to the mains to measure consumption? shouldn’t i be subtracting it?
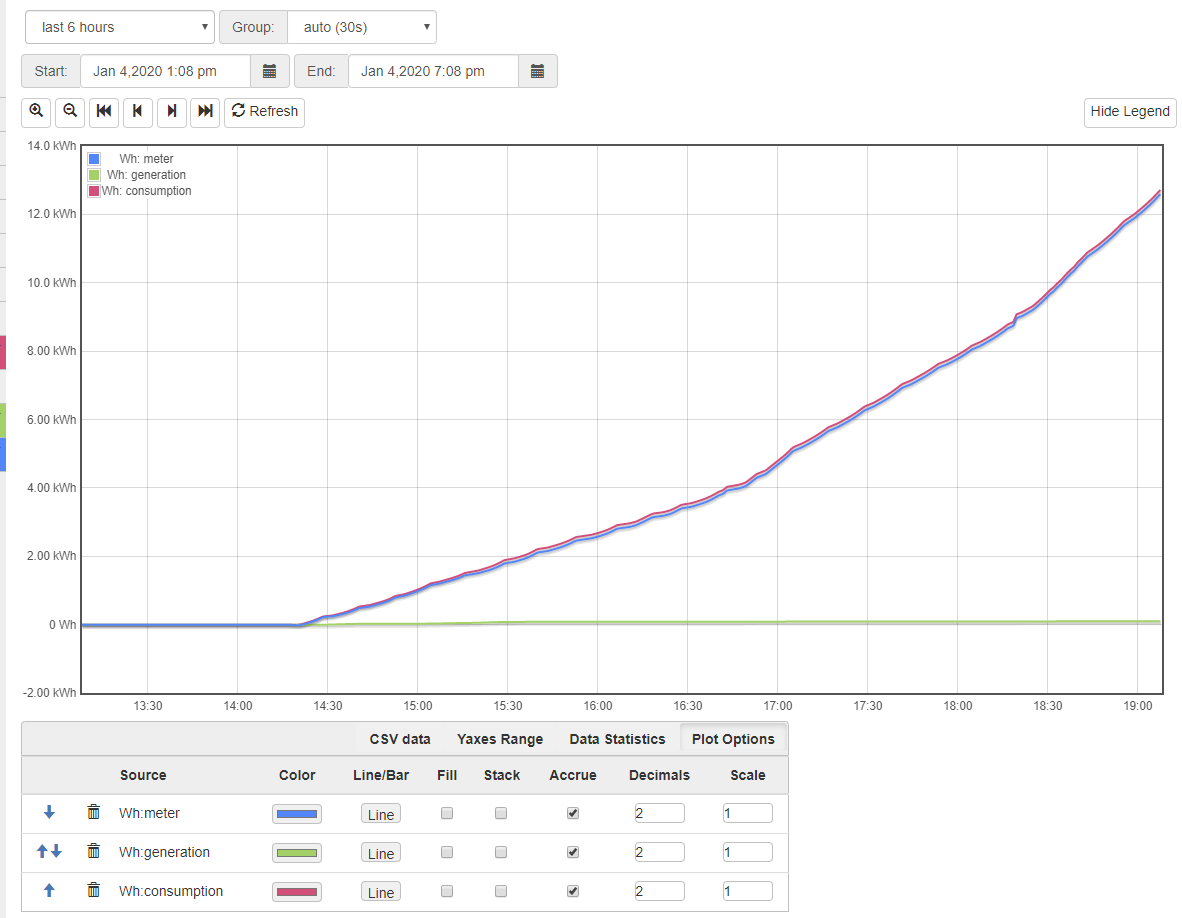
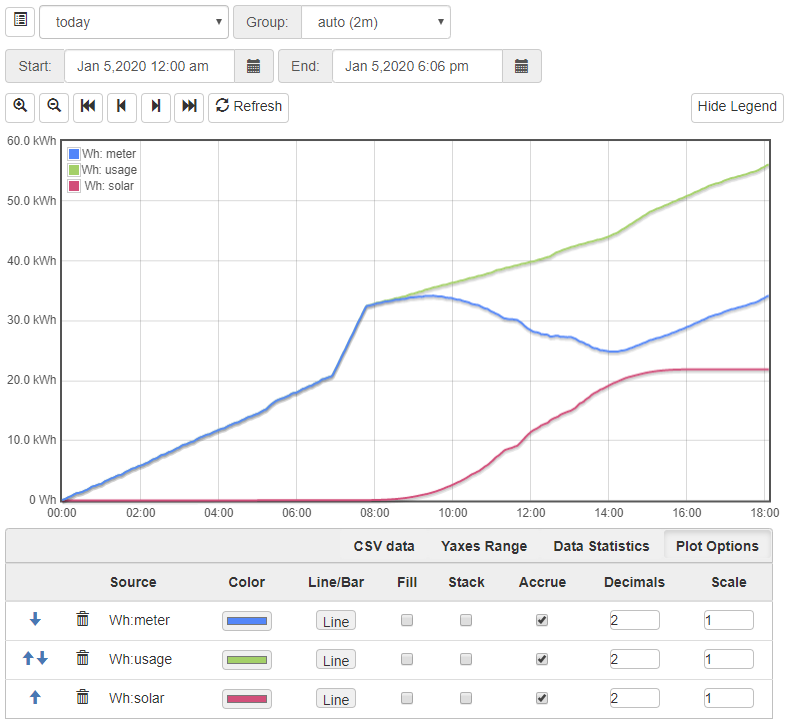
Adding it clearly works since in the graph the ‘meter’ line is less than the ‘consumption’ line.
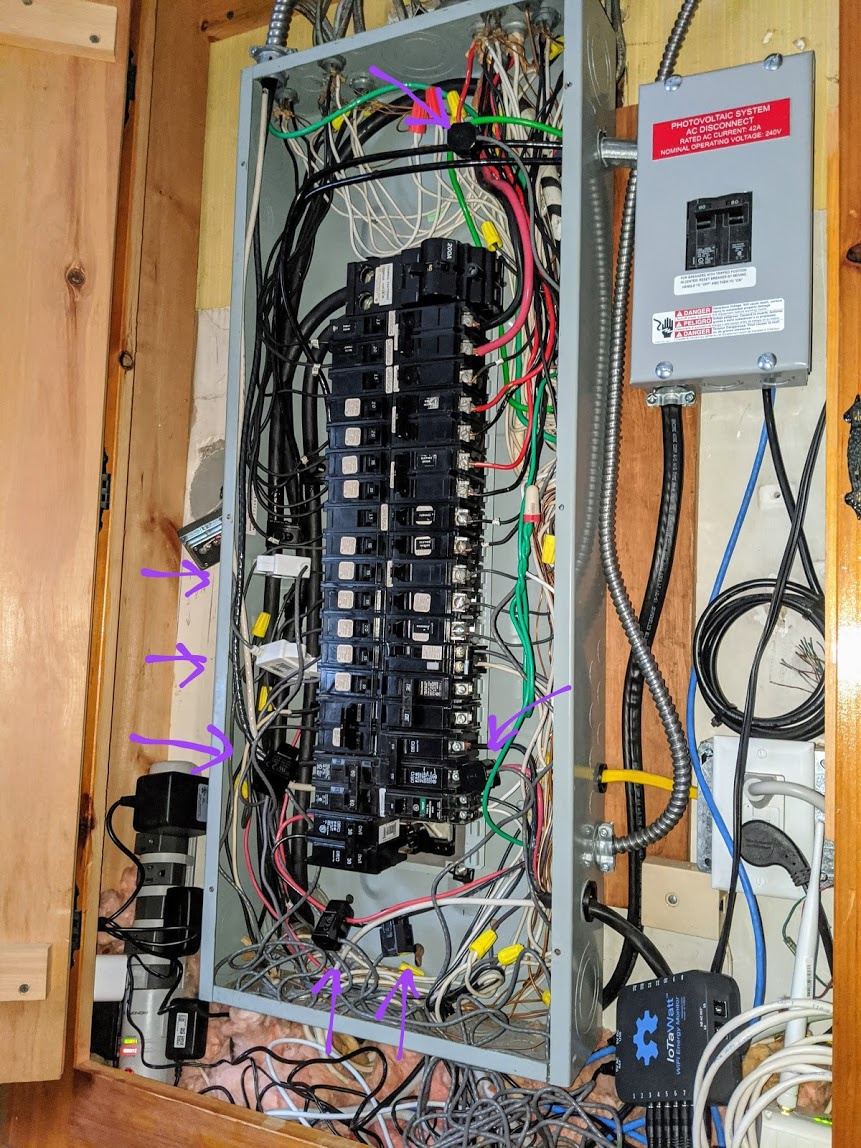
If I need to move wires around, I assume I must unhook the CT from the high voltage line prior to disconnecting it from IotaWatt - correct?
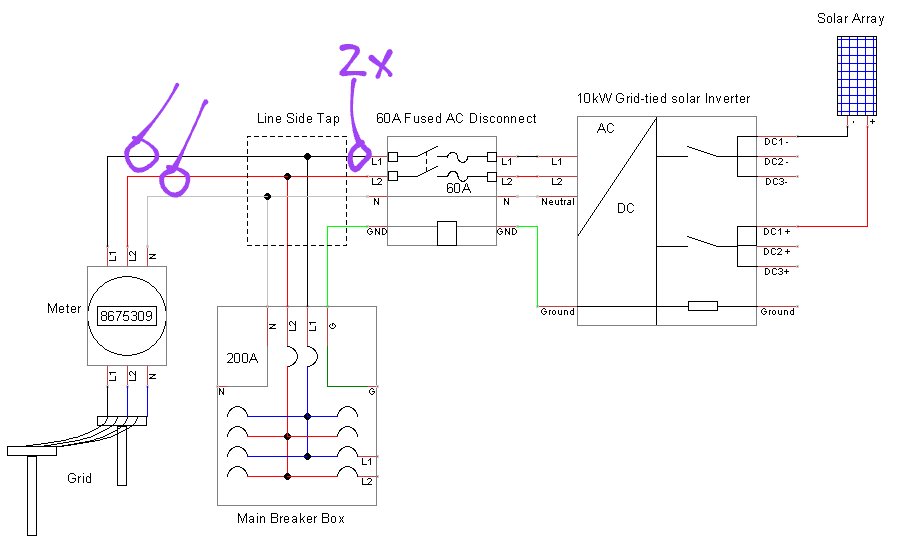
It looks as if your solar is connected to the main supply upstream of the mains CTs. It is much more common that the solar is brought into a breaker in the panel. So your solar will not have any effect on your consumption. Some folks call this “type 2” solar.
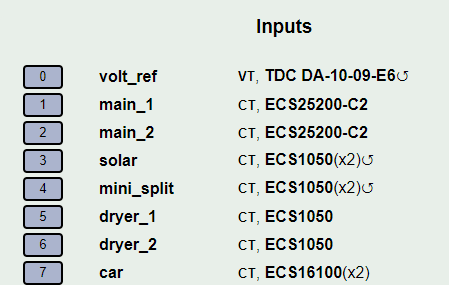
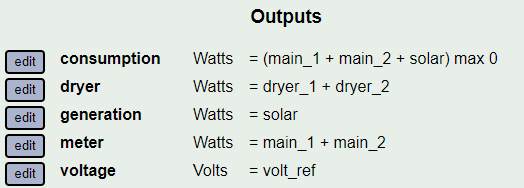
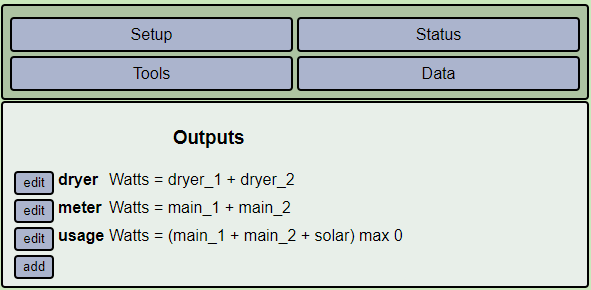
With this setup, your consumption is simply
main_1 + main_2
Same as your “meter”.
You had no generation today. I assume you are in the northeast. Pretty dreary day. Go Pats.
Oh, to answer your question, no, you do not need to remove the CTs to disconnect from IoTaWatt. All of the Echun CTs have diodes that protect them while disconnected. That said, belt and suspenders, remove or directly short them if they will be unplugged indefinitely.
I have mains_1 and mains_2 on the lines coming in and the solar ct on one of the solar wires prior to the line side tap.
My grid meter should read the same as mains_1+mains_2 but to measure what I’m actually using I gotta factor in what solar is producing - right? When I tried subtracting solar it seemed to be incorrect but adding solar worked. (I generated a very small amount today due to Northeast skies but it’s there when I hover on the values)
The solar feeds into your service downstream of the mains and provides power to your circuits. What does not get consumed by your circuits is in fact subtracted because it drives the mains negative.
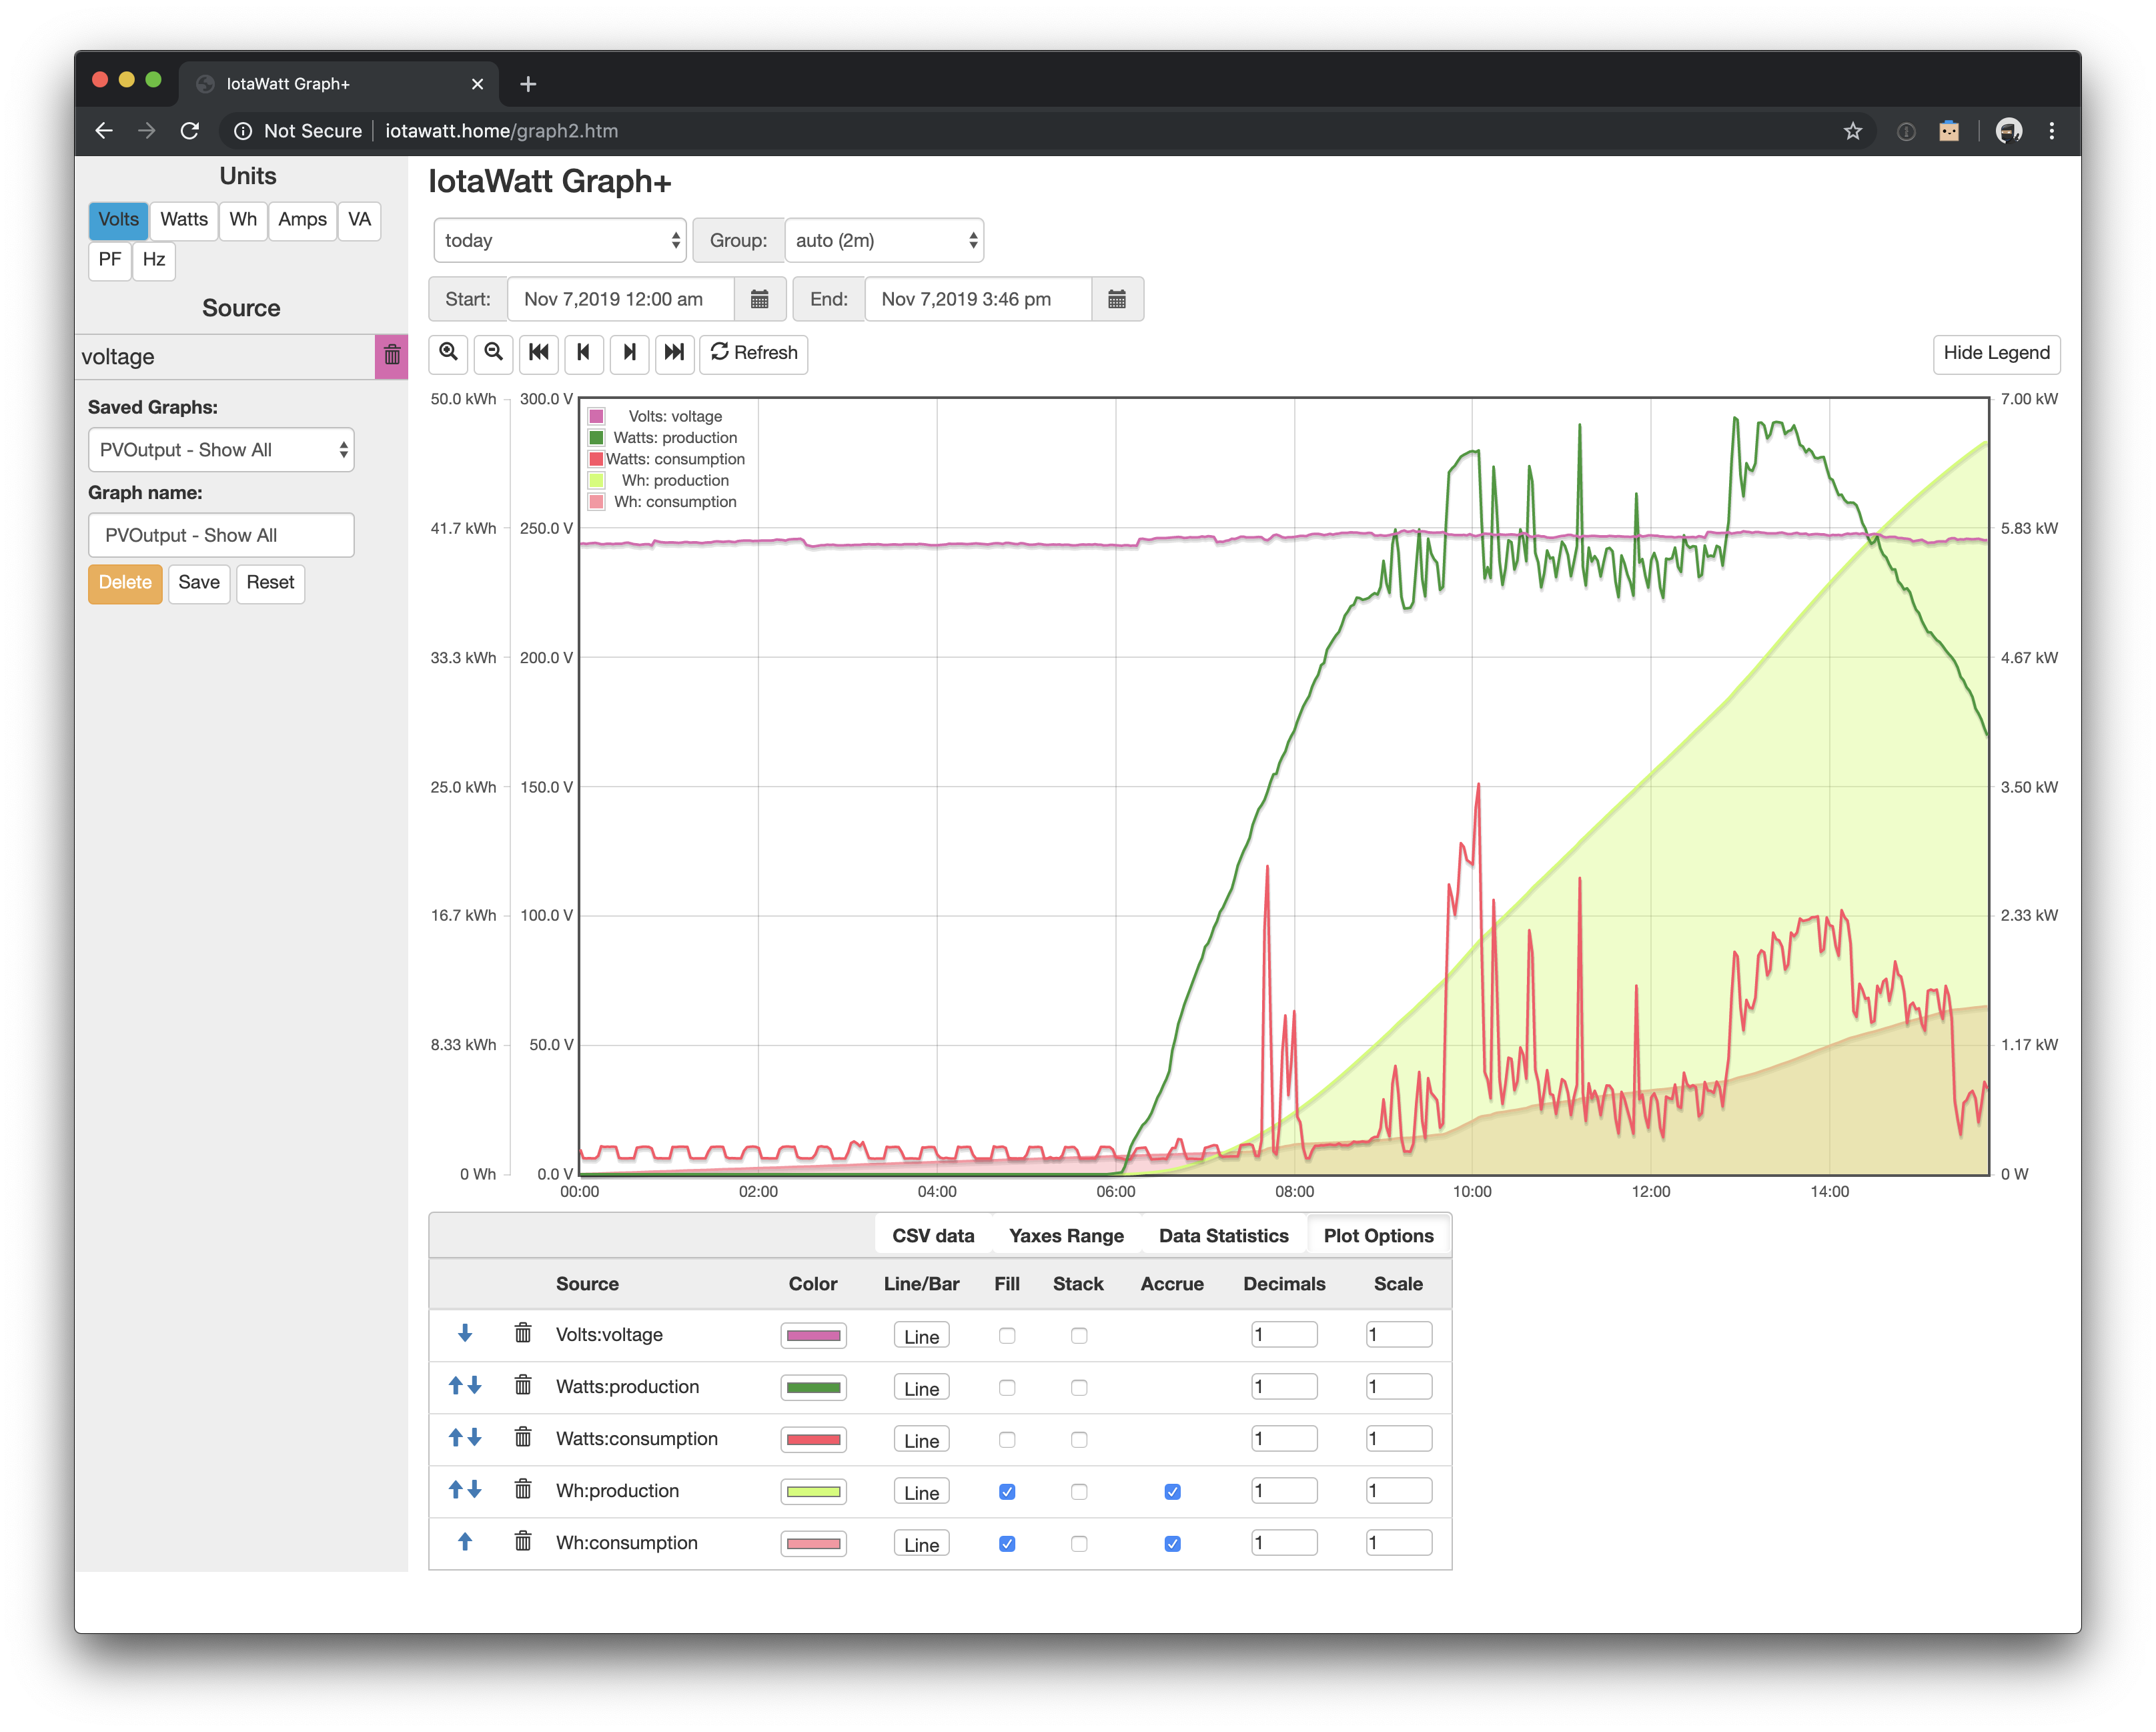
Here’s a Graph+ from @mrmachine that mimics the PVoutput live data display. He plots both the power and accrued energy on the samegraph. You have the data to visualize this way as well.
I will throw in my configuration and details below when measuring energy along with a battery and solar. Remember there are a few different things you need to remember based on the direction of energy flow along what you are wanting to measure.
Solar only has Generation (one-way) so this is easy to measure by doubling or having two CTs to measure the positive flows from the panels to the load center
Consumption or usage of energy by the home is measured by adding the use of grid and amount of solar which tells you what the home is consuming. So this is adding the two values together as you stated.
Exporting if when any excessive solar generation is sent out to the grid.
In the example below from my IoTaWatt (again remember I have a battery which also acts like a grid where I can import (discharge) and export (charge) to this storage device.
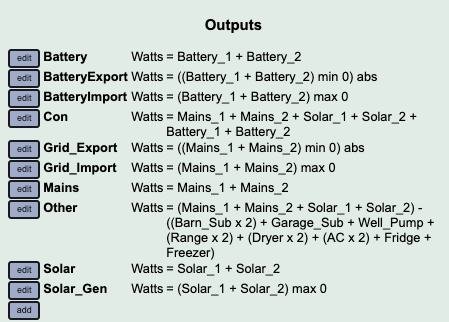
So for me, my total consumption (Con in the image below) includes my two Mains + Solar + Battery
I have grid import (to the home) which is a positive number coming from my two mains into the home.
I have generation which is the positive inflow coming from my solar panels CTs.
Grid Export is any negative values from the mains CTs meaning I’m sending this to the grid. Same for the Battery Storage unit.
Not sure if this is helpful in your situation, but you can see my outputs from the IoTaWatt below.