Hello,
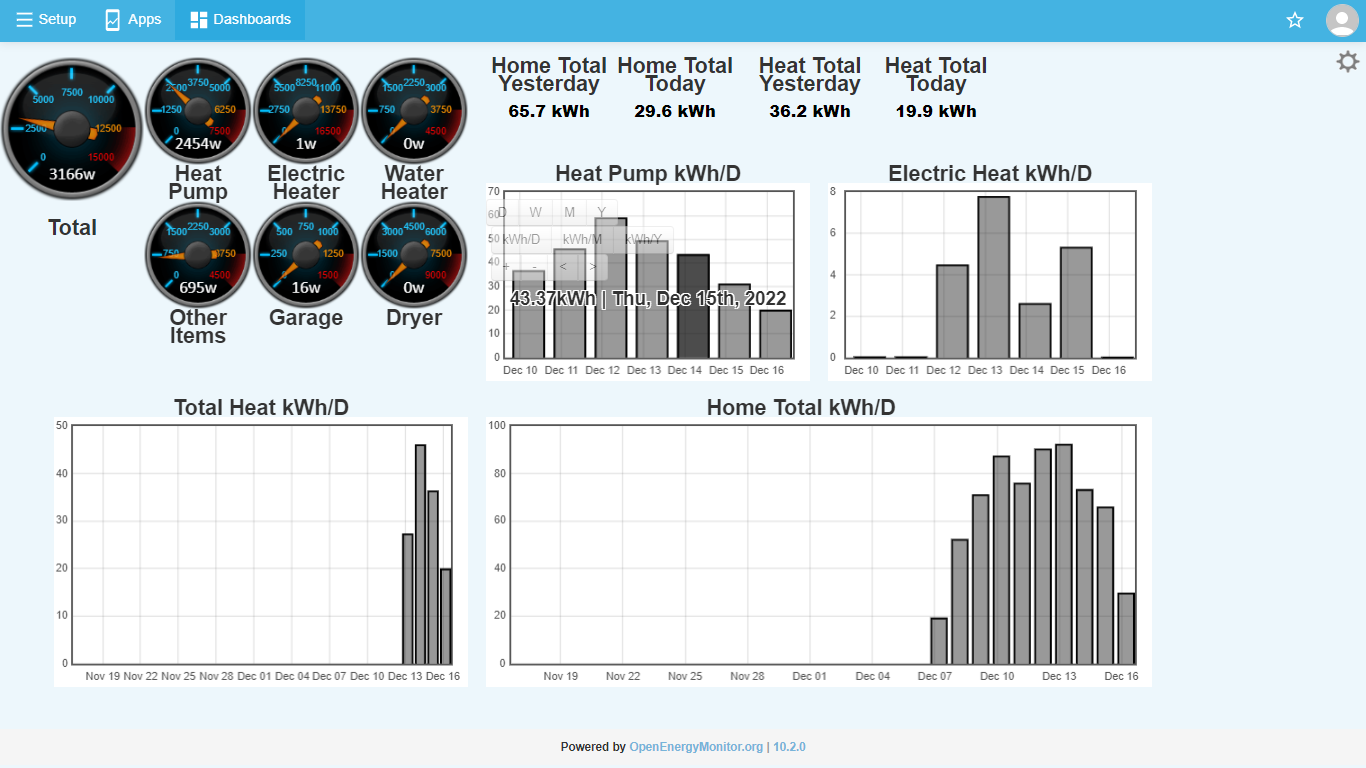
Just wondering if anyone would share their grafana dashboards. I have tried emoncms and I like it, but the dashboards are not as cusomizable as I would like. So i have stumbled upon influxdb2 and grafana, it is a huge learning curve for me, especially flux language. Just looking for dashboard ideas and if anyone has any flux query examples please post!
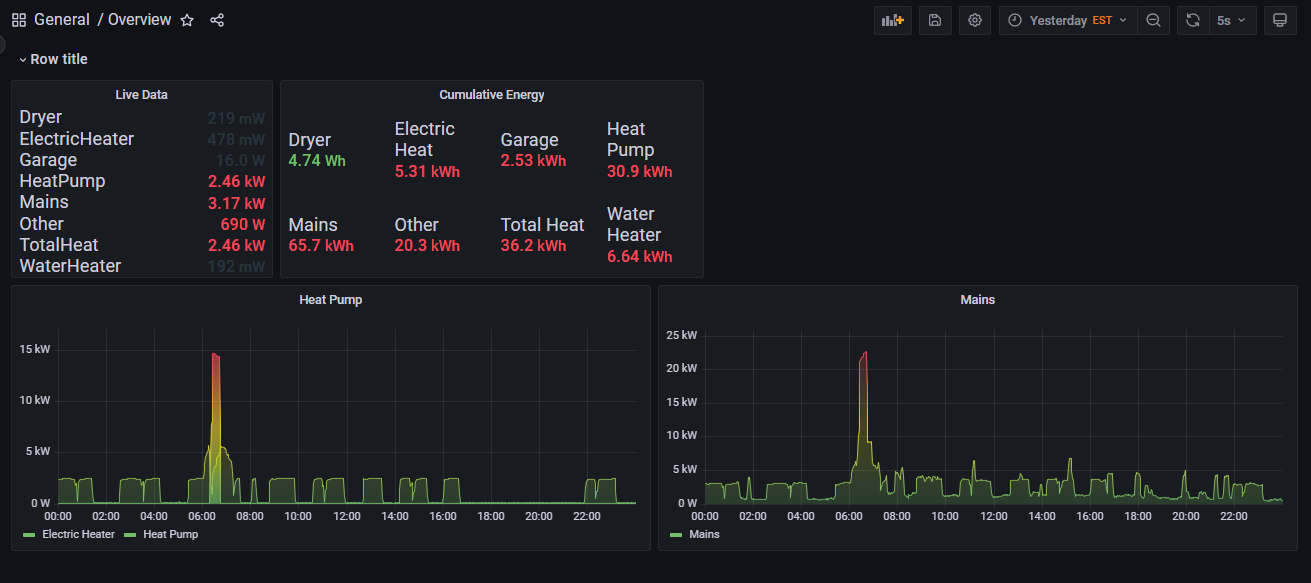
i like grafana a lot more. so many more options.
The heat pump graph has my built in electric heater overlayed, so i can see when that is coming on at the same time (the big 15kw spike). The two graphs and Cumulative energy part change depending on what time frame is selected at the top. Live data always stays live regardless of time frame chosen.
My graphs are focused on heat pump because I just got one installed and want to monitor how much it costs for heating. Going from an old oil furnace was a big change for me. Especially being in a cold climate. If anyone has dashboards in grafana please post pics and flux queries. I am not very creative and looking for ideas. Thank you!
Edit: if anyone is wondering what the heat pump is doing during the large spike, its because my thermostat goes from 68F to 70F. If its too cold out for the heat pump to get up to temp quick enough it supplements with the electric heat. I will be changing this and come up to temp more gradually to minimize the amount of time my electric heat will come on
A few people have shared some of the things they have done. If you search the forum you should be able to find them. One thing is that InfluxDB has two versions 2.0+ (which has flux) and 1.8 (which uses influxql). So, the queries are quite different.
I like Grafana (and InfluxDB), but creating a great dashboard is a combination of art and science. Grafana makes it easy to create beautiful things that provide little value. The first question you have to ask is what questions do you want to answer by looking at your dashboard. This is something that I have been thinking about (on and off) for years. I used Smart Energy Groups when it first came out. It was free to begin with but then moved to a paid model. If the model had been decent, I would have stuck with it. I then switched to emoncms.org. I didn’t like it as well, but it was decent enough. I have moved many things off of it to a local instance of InfluxDB and Grafana. I haven’t done much with the data from Iotawatt, since I am not sure exactly what I want from it.
I will probably dedicate some time to figuring it out over the next few weeks/months. In addition to Iotawatt, I have a lot of sensors/controls running Tasmota that publish data to MQTT and then some NodeRED stuff to publish better data to InfluxDB and do some control. Most of the control is for freeze protection systems, so critical but somewhat forgiving.
I want to know everything is normal, at a glance, but what does that really mean?
Last week, I just happened to be looking at the total watt draw and noticed it was high. This is not abnormal, it just means one of the big loads is running. Since it stayed that way for several mins, that was unusual. I then looked at the various loads and saw that my heat pump water heater was running the element. Since it is in economy mode, it should never do that (but if the top sensor gets down to 104°F, it will turn on the upper element). I looked at the watt graph in the web UI and it definitely looked wrong. I then pulled up the data I collect from the HPWH in emoncms.org. While it was running the heat pump, it was not heating the water. After more checking I discovered the heat pump was not drawing enough current. I cycled power on the water heater and the heat pump started heating again. It took awhile to be certain, since it was still turning on the element. It does appear to be back to normal, but I am keeping a closer eye on it.
I think keeping track of daily and monthly kWh usage is a useful thing. I also look at the voltage, since that is interesting. What are you interested in knowing?
not OP, but have been thinking a bit about this - and what I’d like to see once I eventually get some time to build a dashboard.
Monitoring of CT’s that are assigned to the hot tub, I’d like to see that the pattern is typical (ex. is the motor running for it’s filter cycle, is the heater turning on) I’d also like to add element similar to what beestat has for the ecobee, where it the heater usage is compared against the outdoor temperature, do to a sort of a degree/day calculation. There’s a lot of fud on how much it costs to run a tub, it would be nice to get actual numbers.
Similar to #1, but simpler - today/this weeks use compared to historical for various appliances, is the fridge/freezer/furnace/a/c/etc running more then it normally does - might indicate that they need servicing or a cleaning.
General number compare against the utilities billing system/outdoor temps, likely would like to integrate the natural gas usage in there too somehow, but that’ll be at a monthly level.