Not sure how to create this query in Influxdb so hopefully someone can help me out:
I have attached 3 CTs to our gen set at the office and I would like to build a new Panel which simply displays the total time the generator has run. I would assume the best way is to create a query which adds the time for any value of “total_gen_power” which is > 0 and adds that time to says “total_gen_run_time”.
Any help on this would be highly appreciated. Thank you everyone!
Taking a quick look at the influx functions documentation, you may want to try using the count() function to count the number of non-zero power values in each group, multiplying that total by the measurement interval in seconds should produce the total seconds runtime for each group. That can be converted to minutes, hours etc using the obvious math.
I was interested in something similar, so I looked at the links and didn’t see a real solution there. There were some really good hints, which were helpful. I now have something that appears to give decent results. Here is what I did:
I use Tasmota on many of my devices (based on the esp8266). I set them to use 0 and 1 for POWER state.
I have a flow/function node in Node-RED that listens to MQTT and creates arrays in InfluxDB format and then forwards to InfluxDB
The data looks like this:
> precision rfc3339
> select * from PowerControl where time > now() - 10m and "NodeName" = 'BasementFan'
name: PowerControl
time                     Name NodeName    POWER Sensor
----                     ---- --------    ----- ------
2021-01-13T19:26:36.233Z      BasementFan 0     POWER
2021-01-13T19:26:46.731Z      BasementFan 1     POWER
2021-01-13T19:26:57.136Z      BasementFan 1     POWER
2021-01-13T19:27:07.557Z      BasementFan 1     POWER
2021-01-13T19:27:18.092Z      BasementFan 0     POWER
2021-01-13T19:27:28.558Z      BasementFan 0     POWER
I then use Grafana to create an influx query:
SELECT integral("POWER") FROM "PowerControl" WHERE ("NodeName" = 'BasementFan') AND $timeFilter GROUP BY time($__interval) fill(null)
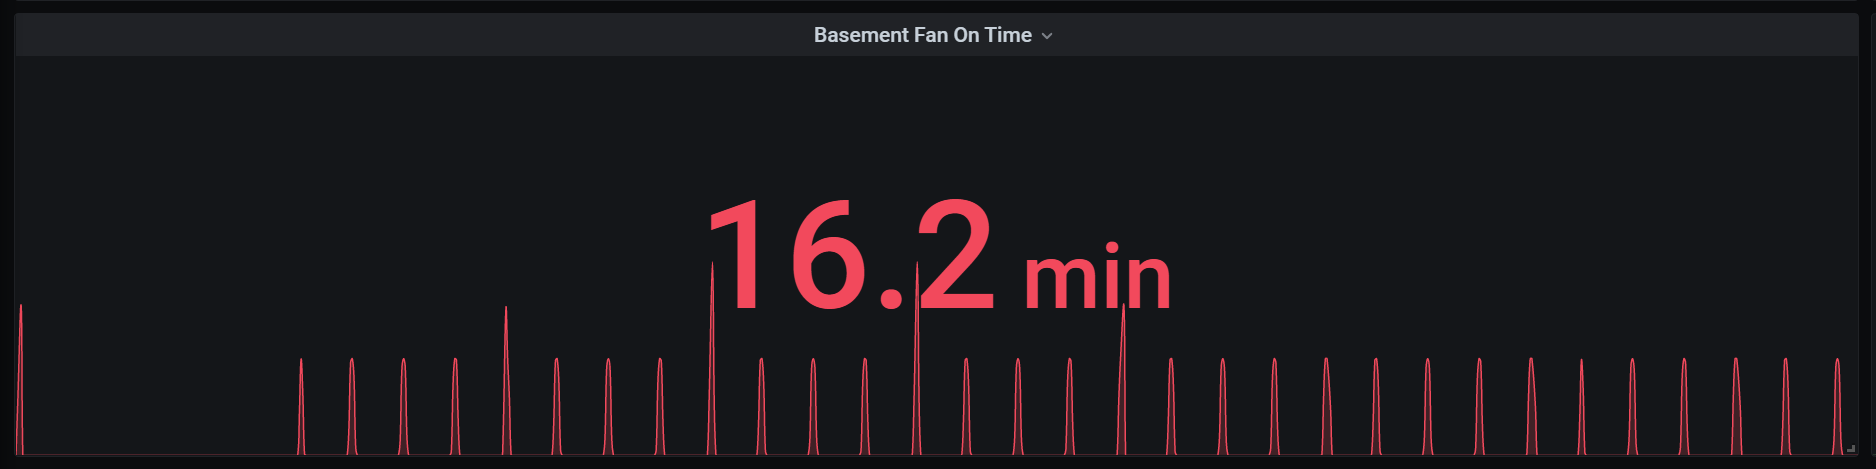
I use the new-ish Stat visualization (it replaces the old SingleStat)
There are two ways to reduce the data. The very new Transform and the older Display --> Show --> Calculate --> Total.
The old way preserves the “shape” of the data, so Stat can also do the sparkle line, which is cool
The last bit is to use the Units. I find using the Field tab makes it easy to set the units to seconds. There is a search box that makes it easier to find the units. I find the categorization they use not memorable, but search works well. Grafana does the math and switches the units from seconds to min or hour (or bigger as needed)
here is an example panel of a fan I have in the basement that is on 30s every 5min to move the air around