Graph+ feedback

Just wanted to give a bit of feedback on graph+, some bugs and a few personal suggestions:

First a couple bugs.

  • When an input is renamed, output formulas update with the new name however saved graphs do not. When selecting a graph that contains inputs you have renamed, you get a 400 error ‘Invalid query. Invalid series: ‘previous input name’’.

  • When pressing reset, the saved graph drop down selection doesn’t reset. You then have to select ‘select graph:’ and back to the actual selection you wanted.

  • While viewing the page from mobile; decimal, scale, and Yaxis options cannot be changed. Selecting them opens then immediately closes the keyboard with no opportunity to enter anything.

These points are more quality of life / personal opinion:

  • missing sections of data are not very apparent on the graph. Instead of dropping to 0 for the time period of missing data, a line is drawn from the last data point to the first data point across the gap and if fill is selected it is filled in. Unless you mouse over it and notice no tooltip, it gives the impression that that data is there.

  • Graph data ‘quality’ doesn’t show less than 100% for time frames that didn’t have that input/source configured while data was collected from other sources (even if those sources are not displayed/selected).

Example: input 1 has been recording for several weeks, then I add and configure input 2 later. In the graph, input 2 has 100% quality for the whole time that only input 1 was configured despite having 0 data.

  • a dark mode for the web pages would be greatly appreciated, but that’s just my opinion. (I’m a bit of a cave troll, lol)

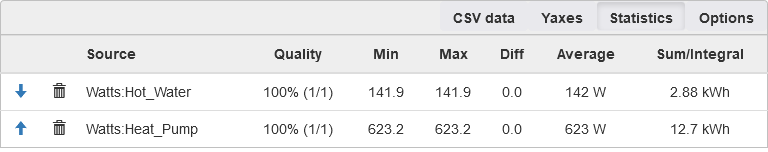
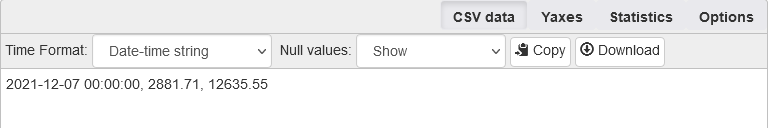
  • please increase the KWh displayed in the statistics of a graph source to have 2 decimals. (ex 12.16KWh)

  • and finally, a bit more granularity in the interval options would be really handy (30m,10min,1min, 30s, 10s, 5s.). This would be particularly useful in the bar graph view. Auto works, but it leaves some control to be desired.

Any way, I’m loving the device. Keep up the great work m8, you’ve created something pretty awesome at a great price. I love that it’s completely independent, doesn’t require any external services and was easy to setup.

Hope all is well with you, Merry Christmas! :slight_smile:

1 Like

No way around that. There is no history of changed names anywhere. In general, you are asking for trouble changing the names of inputs.

Mobile browsers are so much different from the major browsers and there are each other that I don’t have the time, knowledge or resources to try to make Graph+ responsive to them.

Probably something that could be done about that. Do you speak javascript and JQuery?

That data is not available for individual inputs. Probably should show the quality stats in a single place unassociated with the individual inputs.

Nah

The kWh display is three significant digits. That is consistent with the default decimals in the underlying data.

If you want an accurate value, choose units Wh and group all then look at the CSV.

That has implications with the size and response of the query. The idea is to make it as intuitive and automatic as possible. I tend to shy away from options that can cause problems for users. The IoTaWatt doesn’t sample while it’s doing a query, so keeping them to the auto interval is safer. The select and zoom features usually work for me.

No history required. Update the Input name anywhere it is used upon pressing save in the input config page. Your are currently doing this for Outputs, do the same for the saved graph strings.

Things change, stuff gets added and removed from setups, setups move. People will inevitably rename inputs. “Just don’t” is… a poor answer.

Fair. I think this has to do with a lack of padding at the bottom of the page (keyboard tries to scroll the page so you can see what you’re typing, but can’t), but I’m really not sure. Just passing on a bug I noticed. I’m getting the same behavior in Chrome and OperaGX on Android.

Unfortunately not in any meaningful way :confused: A slow goal, but life gets in the way and it’s not a priority.

I don’t see what you mean here at all…

I could see wanting to limit the number of data points sent/displayed so some extent, but auto already breaks things down as small as 20min for full months of data. I’m not trying to display a year in 1m intervals, more like a day or two in 10 or 30min intervals, or be able to change from 1hour to 3hours and keep the same interval.

This is definitely more important with the bar graph view: When viewing the last hour of data for example, I can either look at 720 bars that essentially meld together looking exactly like the line graph, or I can have 1 bar totaling everything. I have no option to look at say 10min intervals and see 6 bars.

You could easily limit this by only allowing people to select intervals larger than what auto would pick. You’d only ever be sending equal or less data than what auto would be sending anyway.

That’s great for those that want a hands off kind of experience, but doesn’t mean those that want to go more in-depth shouldn’t be allowed/able to. I wasn’t asking you to remove the auto feature or set something else as default, just allow for a couple more options in an existing dropdown menu; especially when viewing sub-24hr time frames as the only option then is auto.

1 Like

I like the idea of doing a global name update when an input name is changed. (The documentation doesn’t contain the above advice “you are asking for trouble changing the names of inputs”.) I’m new here and I’ve already seen that 400 Bad Request error; it isn’t pretty and it looks like an internal error in IoTaWatt (and I was going to report it as such until I read this thread):

400 Bad Request
{"error":"invalid query. Invalid series: ThirdFloorNorth"}
/query?format=json&header=yes&resolution=high&missing=null&begin=s-12h&end=s&select=[time.utc.unix,KitchenSplit.Watts.d1,Dishwasher.Watts.d1,Input_9.Watts.d1,Input_4.Watts.d1,ThirdFloorNorth.Watts.d1,HeatPump240V.Watts.d1,Basement_Lights.Watts.d1,Main_Floor_Plugs.Watts.d1,Refrigerator.Watts.d1,Furnace_Blower.Watts.d1,Washer_Dryer_GasHotWater.Watts.d1,Kitchen_4x20_Sockets.Watts.d1]&group=auto

(On the other hand, seeing the actual error message in full detail is a refreshing change from software that simply says “ERROR” and tells you nothing else. If you have an error, showing all the detail is very helpful!)

Of course, a global renaming of the form “switch the names on two inputs” can get you into trouble if you do it the naïve way and just rename A to B (briefly creating two inputs called B everywhere) and then go down to B and rename it to A (renaming all of the inputs named B to be A everywhere). (The problem could be avoided by refusing to allow two inputs with the same name.) You have to use the programmer trick: rename A to C, rename B to A, rename C to B.