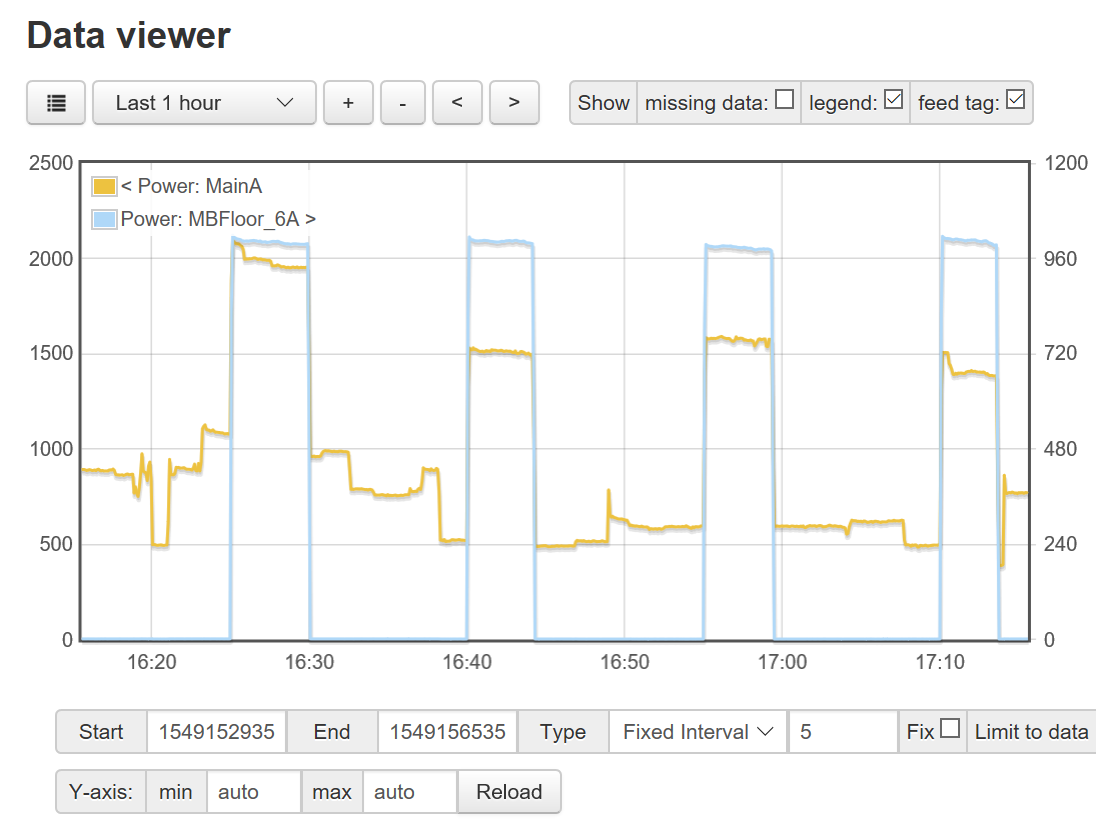
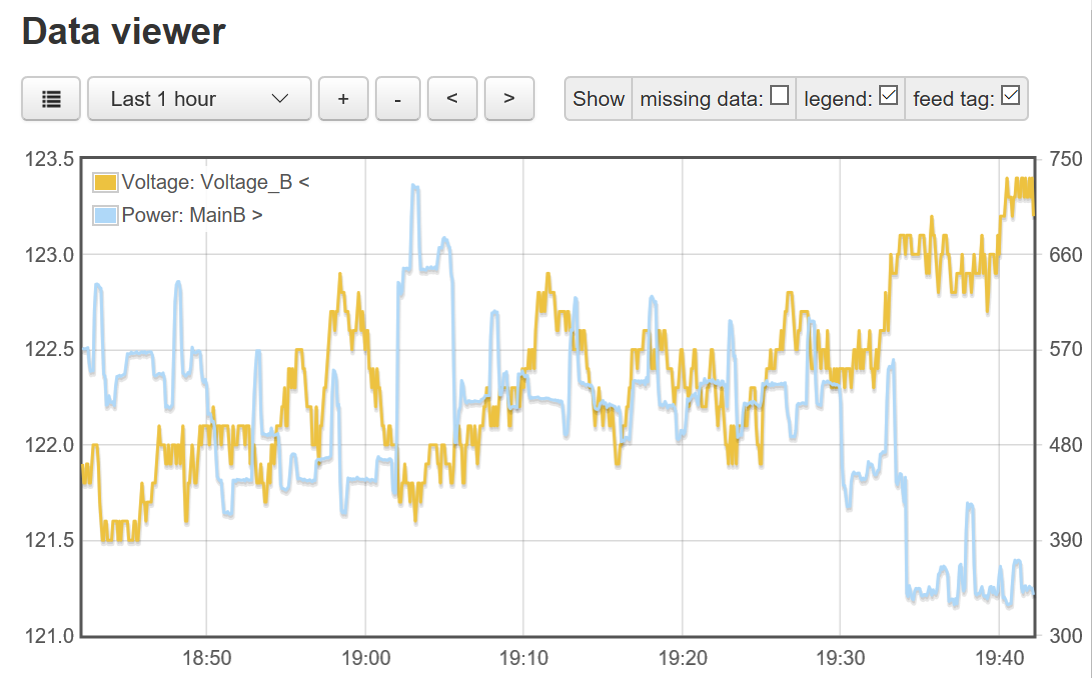
Here is a simple two line change to add a ‘< ’ at the beginning of the tag or a ’ >’ at the end to indicate which scale applies to each line. To be able to turn it on/off would require a few more lines of code, but should be pretty simple.
This is something that I recall folks asking for years ago at the Emoncms site. Nice!
Two minor things if you agree and have time:
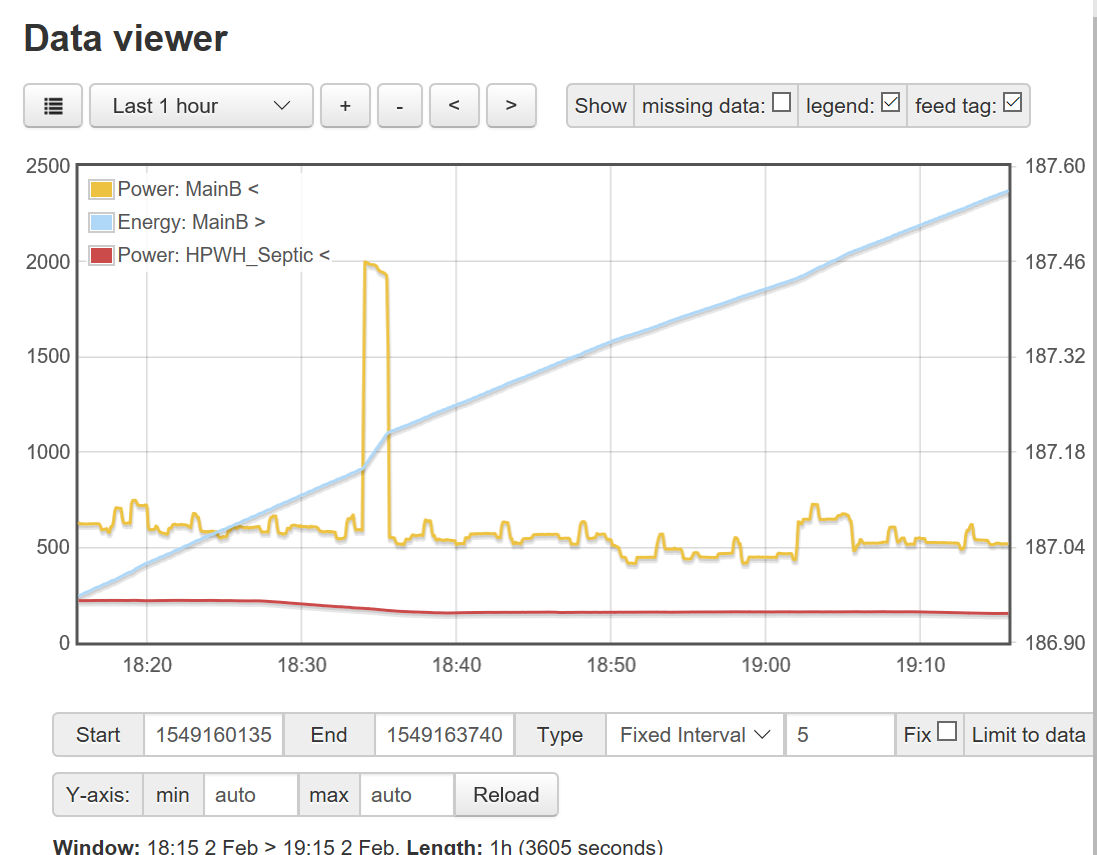
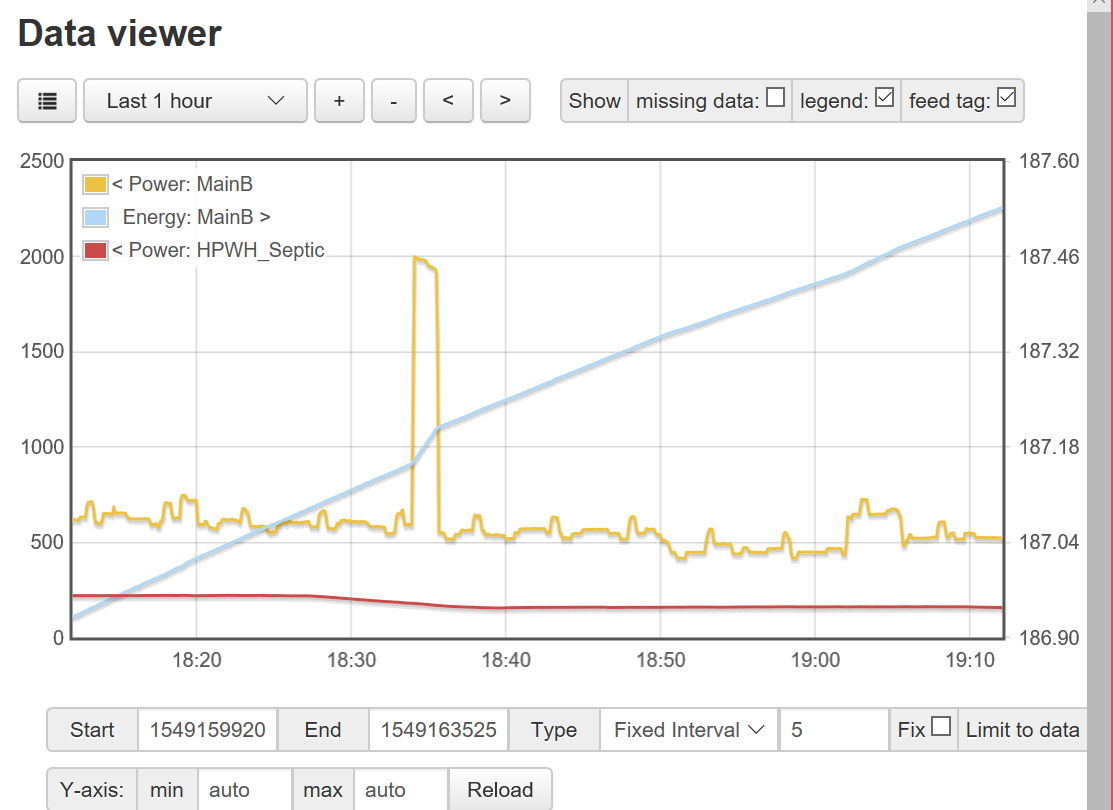
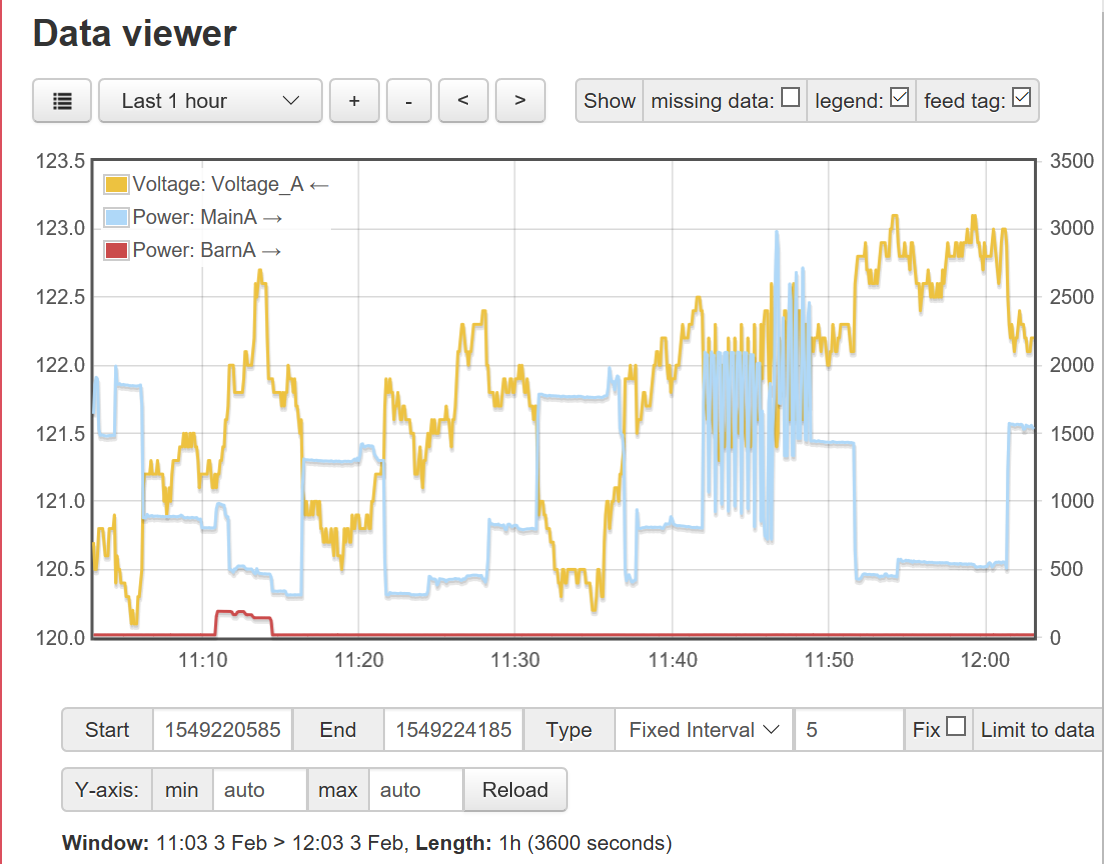
I think the arrows could be at the end of the name in either case so that all the names line up.
My philosophy is to suppress things that are not needed, so I’d only do this when two scales are used.
This addresses the alignment, which I didn’t like before either.
(upload://gpRV5qW8mtnCkHLLAXRGueSUkhp.png)
Since I can have whatever I want on my system, let me know which one you like.
The second request is harder, at the point where I make the decision I don’t know what is being used. So, I will need to keep track of that. It should be possible to do this from the edit page and also from the saved graph page.
I went to the OEM forum and they said they would be happy to get a PR, so I will have to set up emoncms locally and make the change(s) there and then submit a PR to them.
You need to decide if you want these changes as different PRs and the process you want to use to accept them.
Some of this stuff has bothered me for years. Having two IotaWatt devices was the push I needed to do something about them. I have another change for the main page to show the device name, that seems to work most of the time. (Every once in a while the onload event seems to not fire, but it defaults to IoTaWatt (but I could change that to IotaWatt, like the current default.) When you figure out how you want to handle PRs, I can submit one. There is also the one for different yscales, by @timbailey99. I like that one too.
It’s the little things that make the difference. This looks great.
Have you explored the character set for other indicators like an actual arrow, or a finger pointing right or left?
Indicates it only has relatively recent browser support for arrows.
I’ll try them out and the finger pointers too and see what it looks like. HTML has come a long way in the last two decades.
I also agree about the little things. I used to design UI and experiences and I always said, “no UI is good UI”, meaning that it was better to figure out what the user really wanted and just do that. Only if it was not possible to figure it out, would it be a good idea to have some control to have the user tell us what to do.
I tried the simple arrow seems to look the best and has a consistent view across browsers. The other choices seem to be implemented differently and don’t have good alignment with the text.
I think they are saying that the &laff HTML entity is new. The support for UTF-8 character set is pretty well settled. So I think they are saying that ← would be more reliable than &laff.
Yes, the newer one with arrows is more intuitive than the <>. One last thing. Since you have a version that already integrates all of the PRs for the graph app, could you post the file and let others try it? If there are no problems, I’ll merge it with the next release in a week or two.
Here are the three files to add support for the time selection, scale/axis indicator, and device name indication for the graph and add the device name to the index. graph.htm (16.9 KB) index.htm (102.9 KB) graph.js (36.6 KB)
The PR is current on GitHub.
For those that want to try it, you can download the files and use the file manager and editor to upload the new files to your device. Save the old ones first or you can get the originals from GitHub, in case you want to go back.
Note that the 3 day view on narrow screens has bad time axis labels. That appears to be a bug in the flot library, but that library doesn’t seem to be being significantly updated. Works fine on wider screens so not too much of an issue.