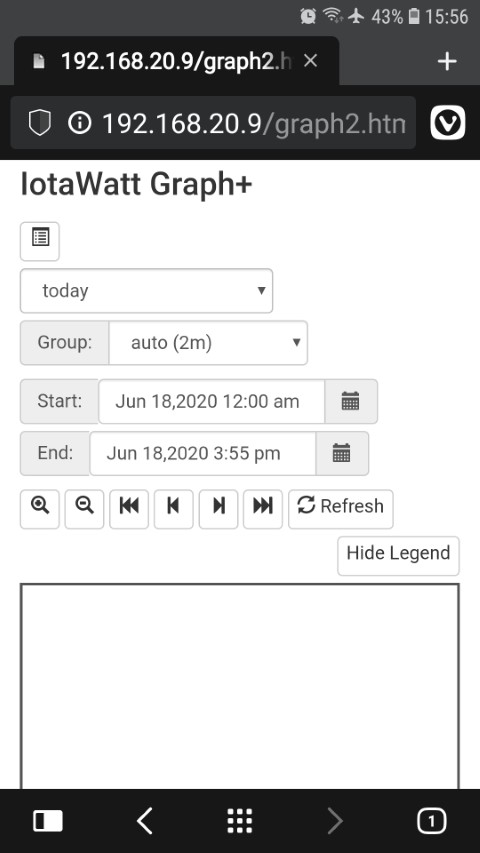
I have just tried to display the graph.htm & graph2.htm web pages on 2 different Android devices - one phone & one tablet, with 2 different web browsers Vivaldi & Chrome. None of the 8 combinations display the left side panel, so it’s therefore not possible to select a saved graph. Any thoughts on this? The default and status pages appear OK. Even the more complex File Manager page appears OK. A completely unrelated grafana dashboard (with fixed IP address) also displayed OK. One possible clue - from my Windows 10 PC I can open http://iotawatt.local/graph2.htm whereas from the other devices I have to use the IP address, eg 192.168.20.9/graph2.htm. Attached is the screen cap from the phone running Android 8. Firmware version: 02_05_09. Thanks for any suggestions.
Two things,
What happens when you rotate the device to landscape mode?
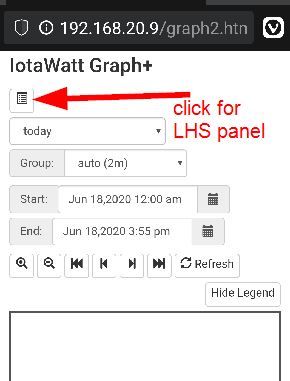
Graph+ uses bootstrap adaptive CSS, so it’s normal to suppress the left column, but it should appear when you click the show box in the upper left under the title.
Ah great, thanks @overeasy - I hadn’t noticed that small button yet as yesterday was my 1st attempt to get IoTaWatt graphs on an Android device. The PC web page doesn’t display it, of course.
It is the same layout in landscape & portrait by the way.
For others I’ve annotated below:
Any thoughts on my 2nd question re having to hard code an IP address eg 192.168.20.9 instead of using a http://iotawatt.local?
That’s more about the browser recognizing the .local protocol. Don’t have an android device, but Chrome is from the same folks and sometimes it requires “http://” as in http://IoTaWatt.local. Other than that, maybe someone else can shed some light.
No worries.
The tablets browser (Chrome engine) displays a “DNS_PROBE_FINISHED_NODOMAIN” error for that URL. Am trying set up a tablet dashboard. One link/ shortcut would (eventually) be to individual IoTaWatt graphs.