Having had my early IoTaWatt logging to Emon for nearly 2 years I thought it time I started making better use of the data. My device came from the Open Energy folks, its on 02_04_00 Minor, and has never required my intervention to keep it logging to Emon.
On installation I recall not being able to view any graph data, assuming that was still work in progress I used the Emon display editor to display the basics.
Having seen what can be done with the likes of Grafina etc, and having a good few years worth of data it’s time I started making more productive use of this data. I also have a good few years of history on Fronius SolarWeb, PVOutput and Victrons VRM - I’m aiming to build a consolidated display.
But, I still don’t appear to be able to view my devices graphs, directly.
The so called “enhanced graph” in that release is an experimental application based on a completely new query API in IoTaWatt. It has been out for several months and I have collected quite a pile of issues. The current version of that effort is being redeveloped and is looking good, but will not be released soon.
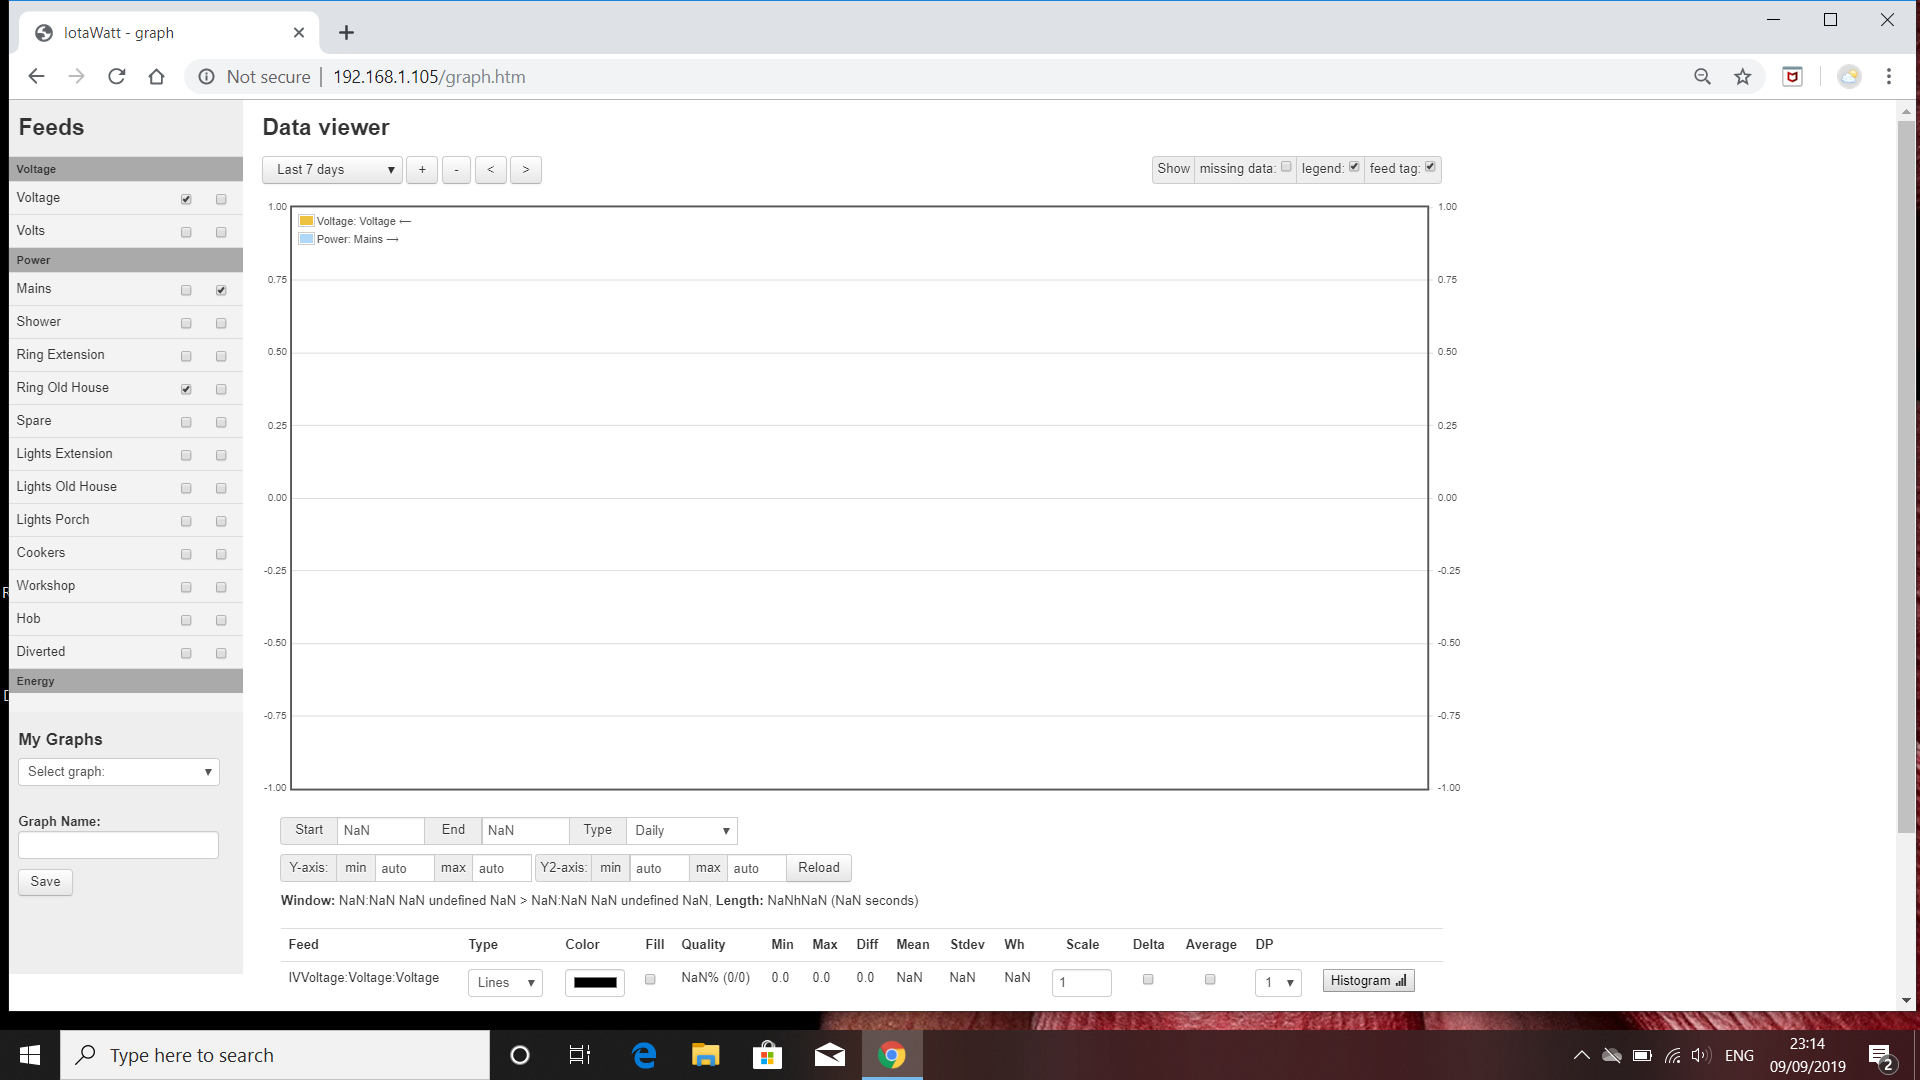
The original graph program has been solid for years, and that’s what you should be using. I need more information about your problem using it. You report that it fails to display a graph within the data viewer. Could you post some screenshots:
In the state where you believe it should be displaying a graph.
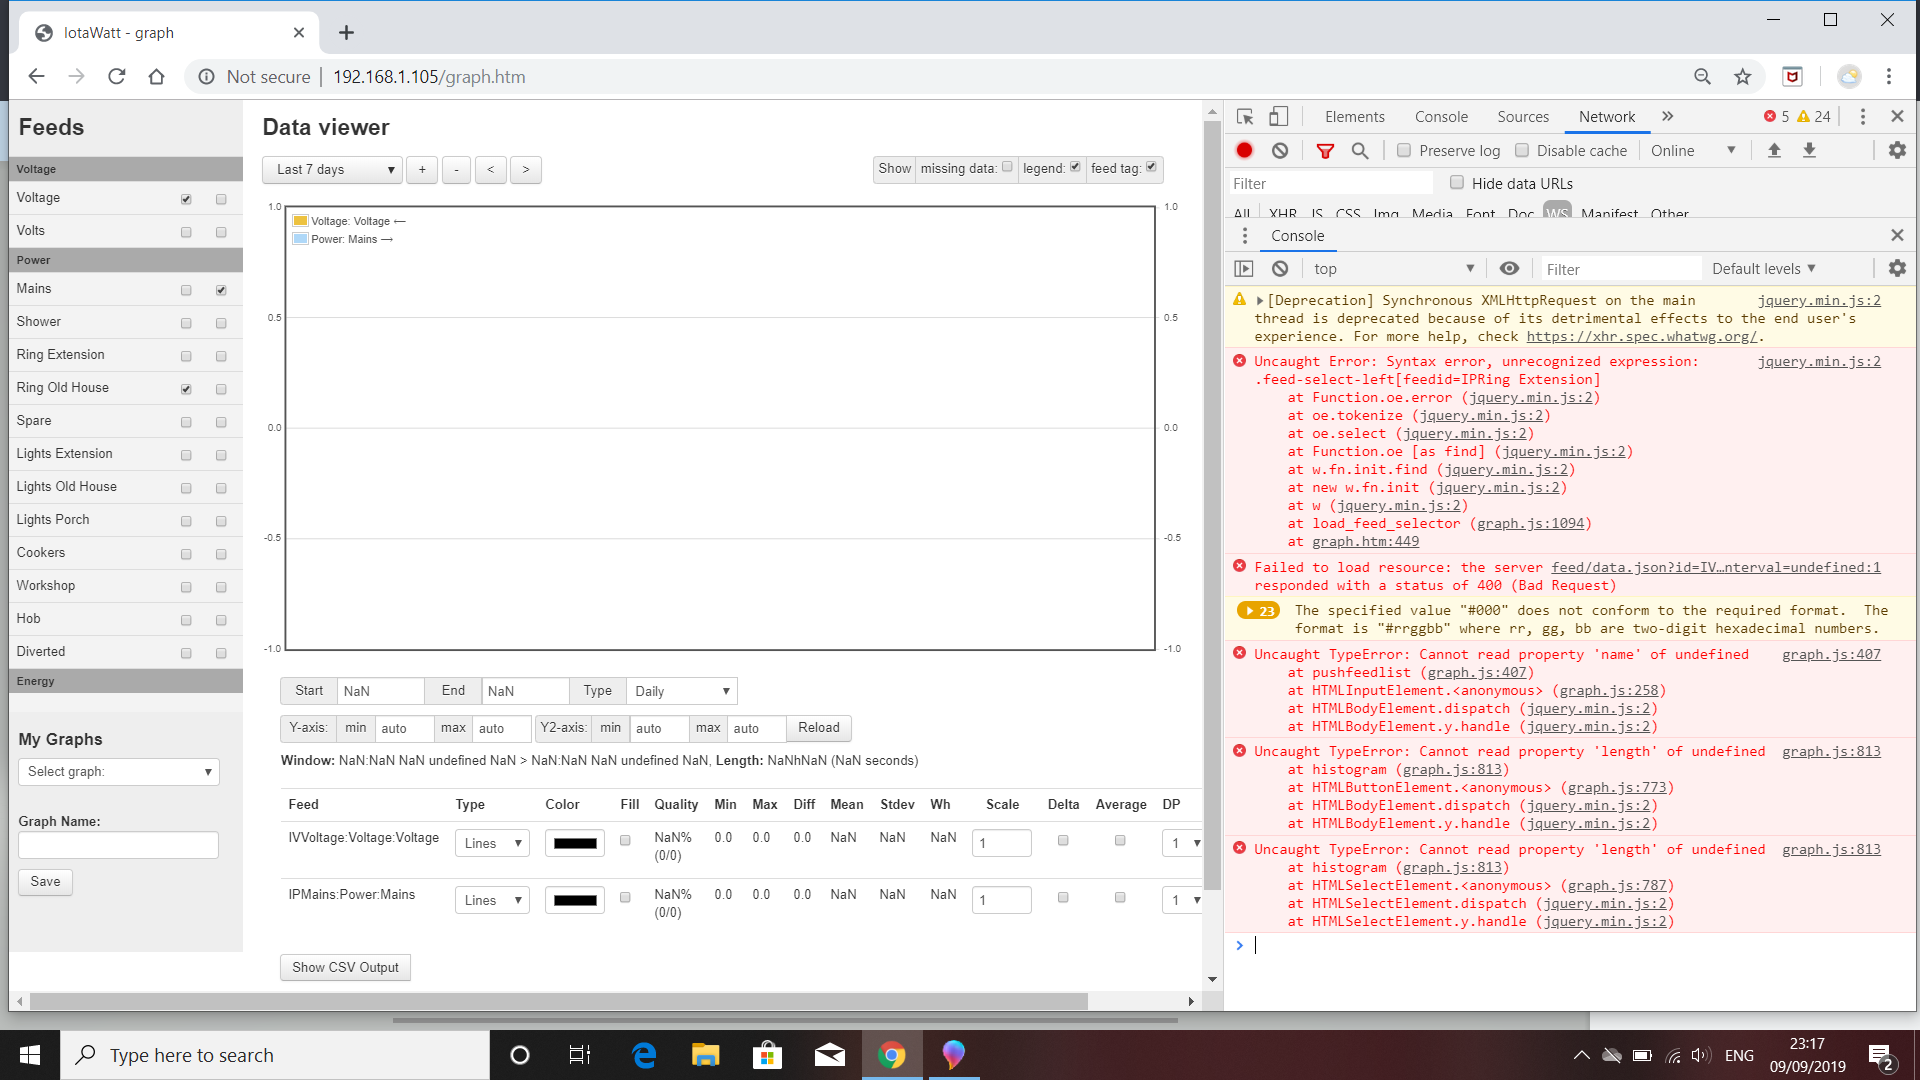
Press PF12 to start the browser javascript debugger and select “network” or whatever shows the network requests, then display it in the above state.
Without changing anything in the above, press “console” to see any javascript error messages.
These instructions apply to firefox. If you have another browser try to replicate or say which browser you have.
This is @Sean support thread. Could you start a new thread if you are experiencing a problem please? I’ve been looking at your graphs just about daily for the past week, so I’ll probably need a little more information to help you.
I think @timbailey99 is right. The key is that you have had this IoTaWatt for years. Without going way back, I seem to recall that there was a time when the configuration app wasn’t particular about spaces in the names. It now requires no embedded spaces in the names. I had just finished going through the javascript traces that you posted and sure enough it was having problems locating feeds in the list by name.
Another clue is that you have two feeds without spaces selected and one with embedded spaces, yet only the two without a space are showing in the graph legend.
So I think Tim’s solution is also good - substitute the underscore (’_’) for the embedded spaces.
I can see that you tried to display them, and got so far as to have the legend created but then no graph. I don’t have enough context in the javascript debug trace, but I think the presence of names with spaces in the feedlist can cause the lookup of names without spaces to fail.
If changing the names causes flow on effects then you might also be able to quote (not tested) the feed id in that function. It allready quotes the tag…
function load_feed_selector() {
    for (var z in feeds) {
        var feedid = feeds[z].id;
        $(".feed-select-left[feedid='"+feedid+"']")[0].checked = false;
        $(".feed-select-right[feedid='"+feedid+"']")[0].checked = false;
    }

    for (var z=0; z<feedlist.length; z++) {
        var feedid = feedlist[z].id;
        var tag = feedlist[z].tag;
        if (tag=="") tag = "undefined";
        if (feedlist[z].yaxis==1) { $(".feed-select-left[feedid='"+feedid+"']")[0].checked = true; $(".tagbody[tag='"+tag+"']").show(); }
        if (feedlist[z].yaxis==2) { $(".feed-select-right[feedid='"+feedid+"']")[0].checked = true; $(".tagbody[tag='"+tag+"']").show(); }
    }
}
ie add the single quote around each feedid similar to the tag
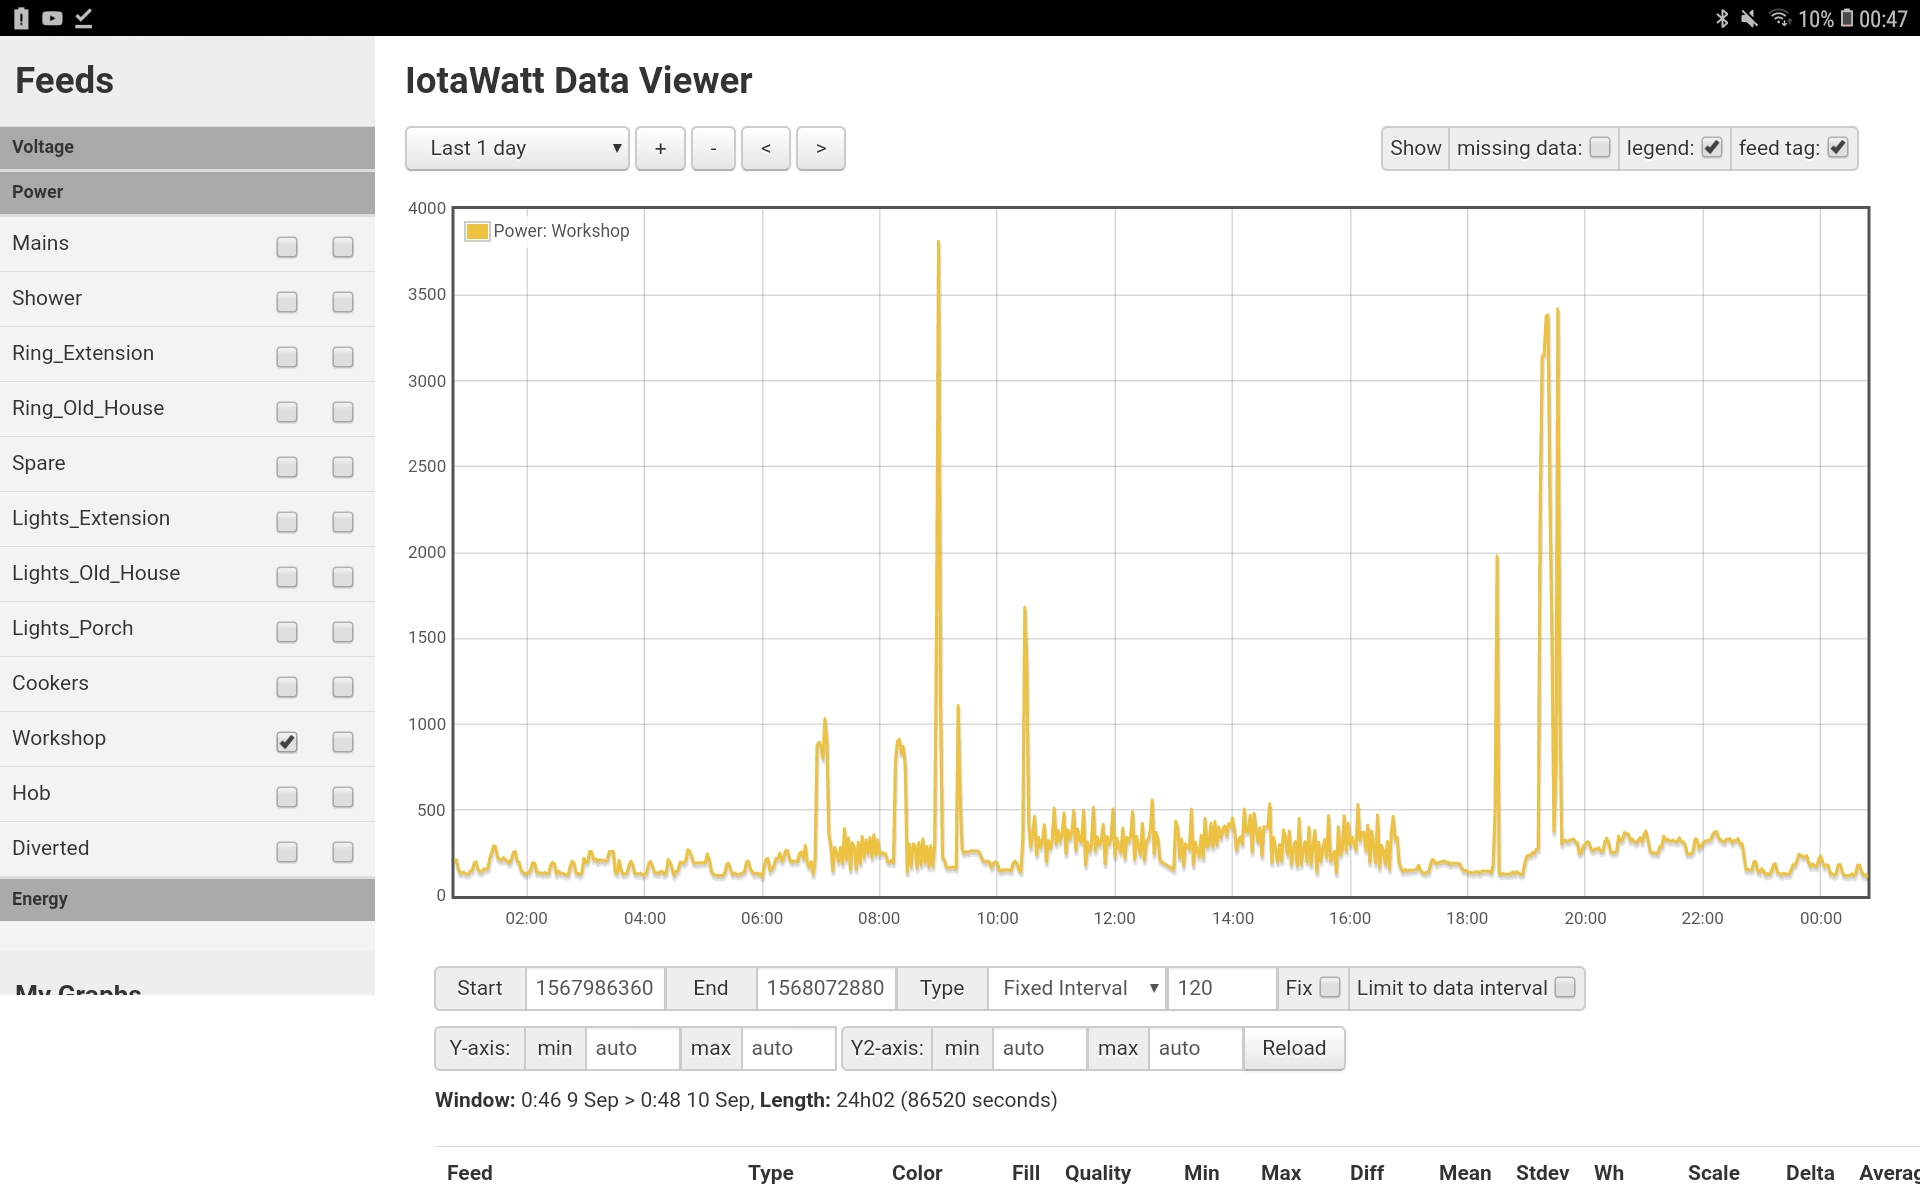
Well that seems to be a rather painless solution - on changing feed names there is now a not a valid name warning given if a space is included… I’ve clearly got some house keeping to be doing with the names, but so far so good - thank you folks - and thank you Bob for a brilliant product.
However, credit where due, Data Viewer was originally developed by Trystan Lea over at Open Energy Monitor as part of Emoncms. I’m sure you noticed the similarities.
It was adapted to IoTaWatt a couple of years ago, before the OEM redo of their package. With the adaptation to IoTaWatt came full asynchronous graph loading.
The new graph to be released soon retains the basic paradigm but is a mostly fresh implementation.
That’s a good insight @timbailey99. It would be great to allow spaces in the names. I’ll keep that in mind and see if it can be accommodated in the future. Have to make sure there are no unintended consequences.
The whole concept of feeds and feed names was an expedient way to adapt the Emoncms graph program to IoTaWatt. Now that I’m in the middle of reimplementing that, several of the basic paradigms are changing, and the notion of “feeds” is one of them.
No UK bundle is planned. You can use theEuro bundle with a universal power strip for the power supply and VT, or get the Aussie bundle and buy a ?U.K. power supply and VT from Farnell.
Any idea when we will be able to type the times that the graph will represent? I really need this to be able to figure out how much power something is using from one day to the next.
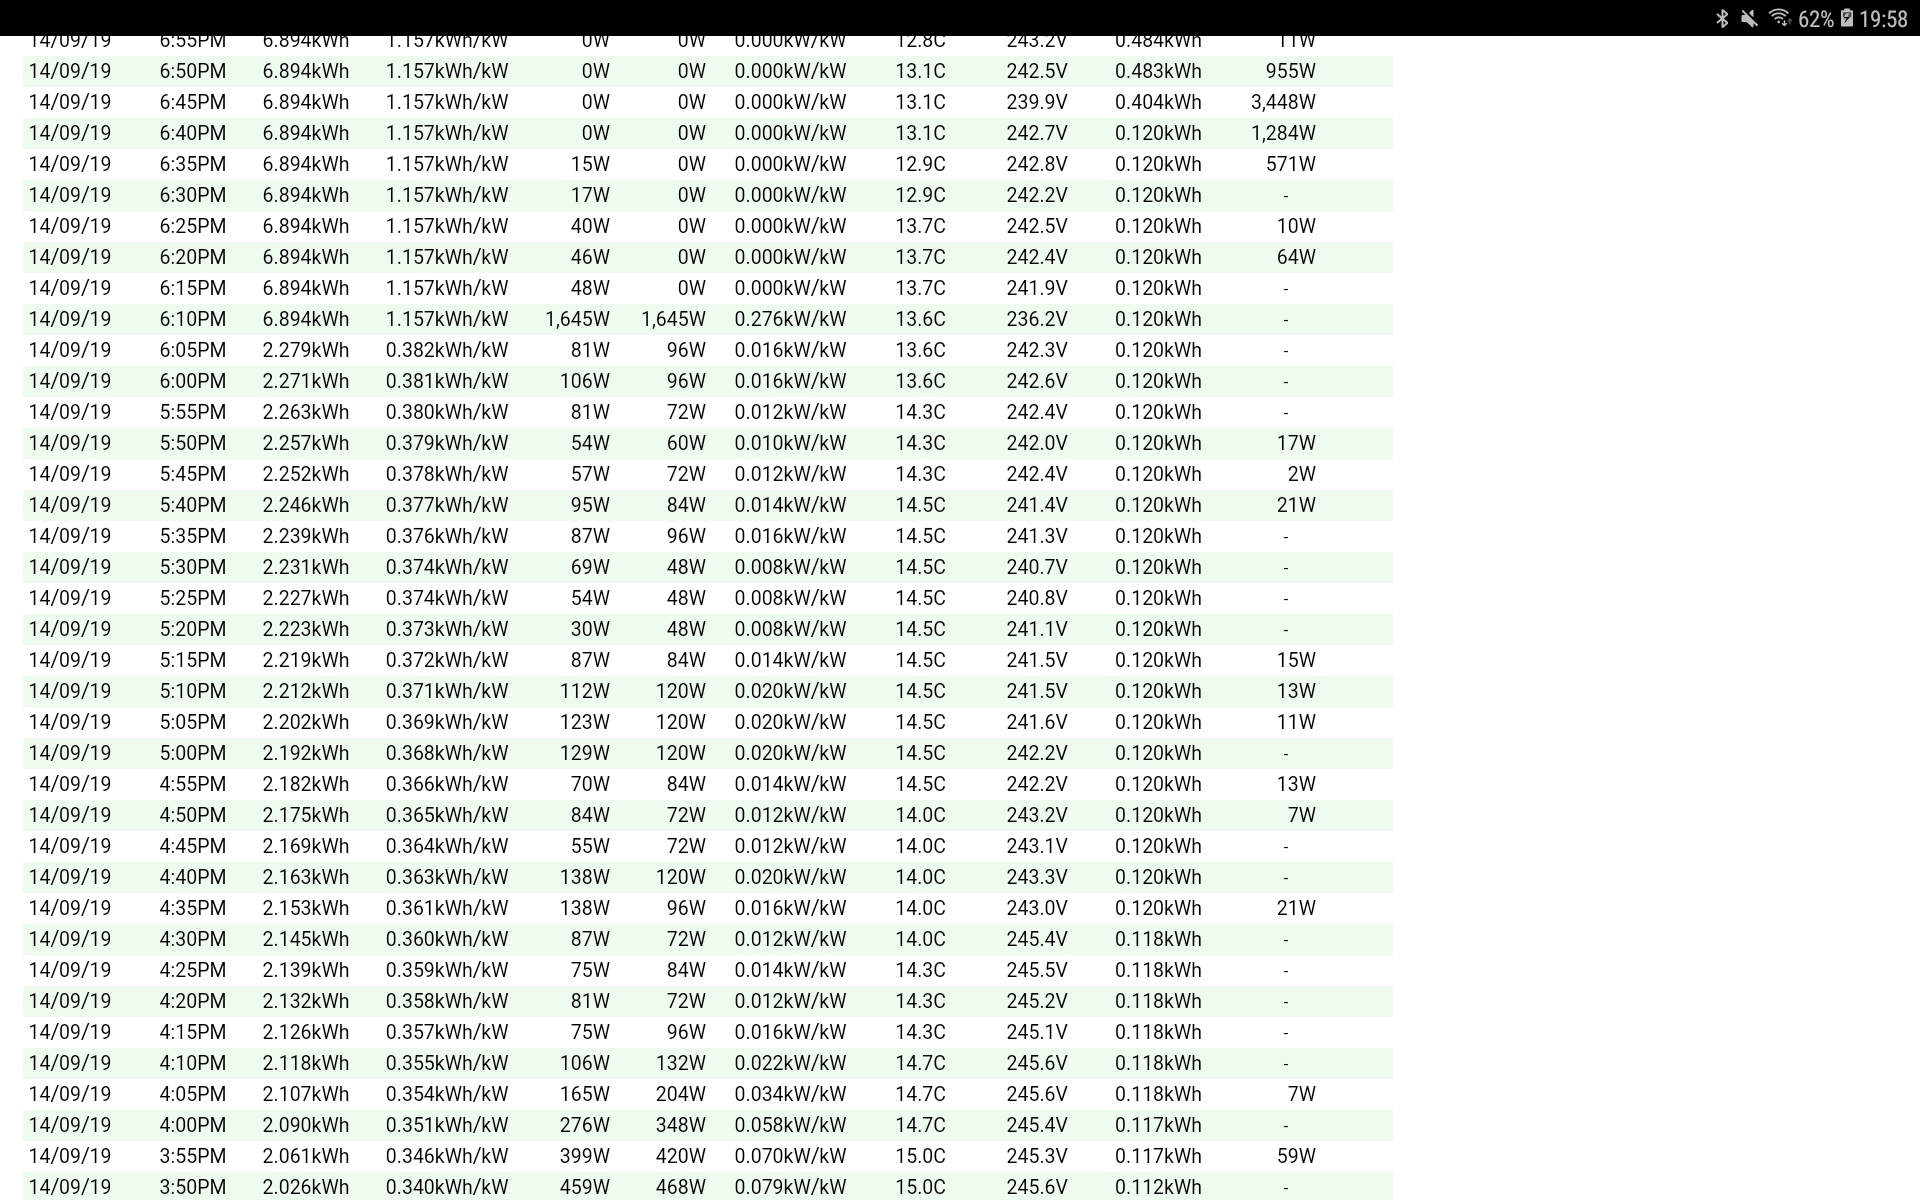
So I’ve started posting consumption & voltage to PVOutput - along with generation via Fronius push, and it’s mostly working as expected - other than the numerous missing consumption records - oddly the voltage records are present.
I’m aware the Fronius push can fill in its missing records in the event of connectivity issues, I thought IotaWatt did the same so I’m at a loss to explain the consumption gaps.
The PVoutput upload was not designed to work with other data sources. Both your Fronius and the IoTaWatt are uploading status records for the same time periods. I don’t know what happens when you do that. You can try to ask Bankstown on the PVoutput forum.
What I think could be happening is the Fronius is sending a status record after the oTaWatt and stomping on the data that the IoTaWatt sent. The occasional consumption data might be when the Fronius beats the IoTaWatt to it.
At a minimum the IoTaWatt recovery looks at the last status posted and picks up from there, so anything the Fronius posts during a lapse will leave a hole in the IoTaWatt recovery.
The question I have, is why not just upload both generation and consumption with IoTaWatt? Is there any significant difference between the Fronius generation numbers and the IoTaWatt?
Thanks Bob, I’ll disable the Fronius upload and confirm your theory in the morning.
Currently the Fronius push records are the only accurate data I have access to for the AC coupled PV generation, there is also a 140kWh Victron ESS sharing the same cable back to the house as the PV - so part of my exercise to make more productive use of the data may well require an amount of circuit segregation.
Be sure to add generation to your PV output. Check the documentation as there are min and max functions that you should be using to insure you comply with PVoutput requirements.