This badly edited image should help illustrate the actual - I’m aware that circuit segregation will be required.
The original AC coupled PV was installed some 7MWh ago (I can’t recall how many years ago that was) on it’s own sizeable circuit - a few years ago an assortment of battery systems came and went, along with a number of management systems as part of some evaluation work for a commercial requirement - the system that remains now is somewhat of a legacy from that work, having proved how effective such a system can be.
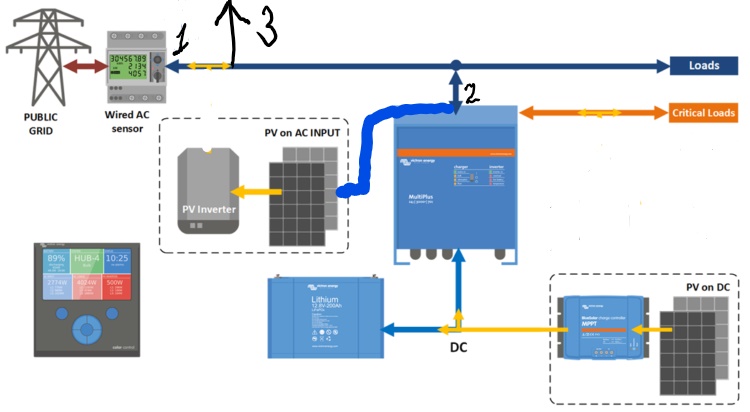
So all PV, and battery generation is fed via a single circuit back to the point of consumption - thats the physical constraint until I segregate.
To answer your questions:
Mains CT is at position 1
CT at position 2 “Workshop” - which meters all generation PV & battery
CT at position 3 “Diverted” - dedicated circuit to diversion device.
Critical output not used or metered.
The diversion device is modbus tcp/ip connected to the Victron Venus device - there is also a Batrium BMS for the battery, which dictates to the Venus device charge and discharge parameters etc … this is all functioning rather well, other than my wanting to consolidate the data, rather than having it spread across Victrons VRM, Fronius SolarWeb, and PVOutput - added to which is IotaWatts ability to log per circuit.
If I could aggregate just the Fronius pushed solar generation with the IotaWatt data into a single PVOutput system I would be happy, but I’ve tried that and it stomps on the Iotawatt data (leaving no actual consumption records)
Did any of the above make sense ?