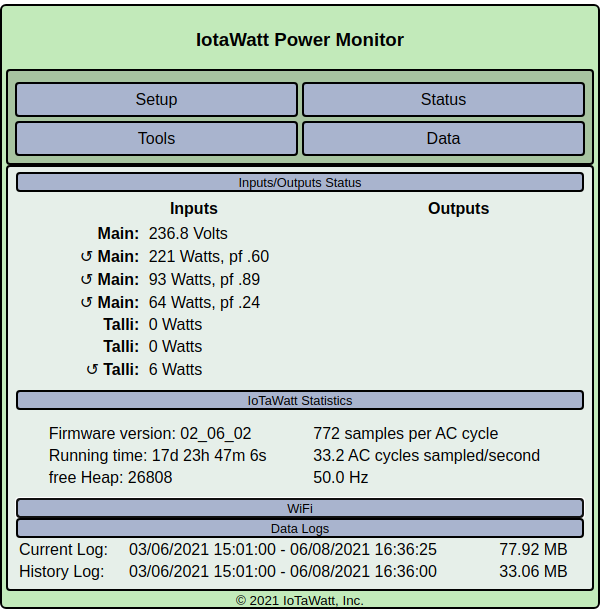
This is a new IotaWatt installation Firmware version: 02_06_02, with six current measurement for two three phase systems and one voltage measurement. The nominal voltage between phases and the zero in the wye (Y) type system is 230V. The first of the systems measures currents for the whole site and the other system measures the currents for the carage only.
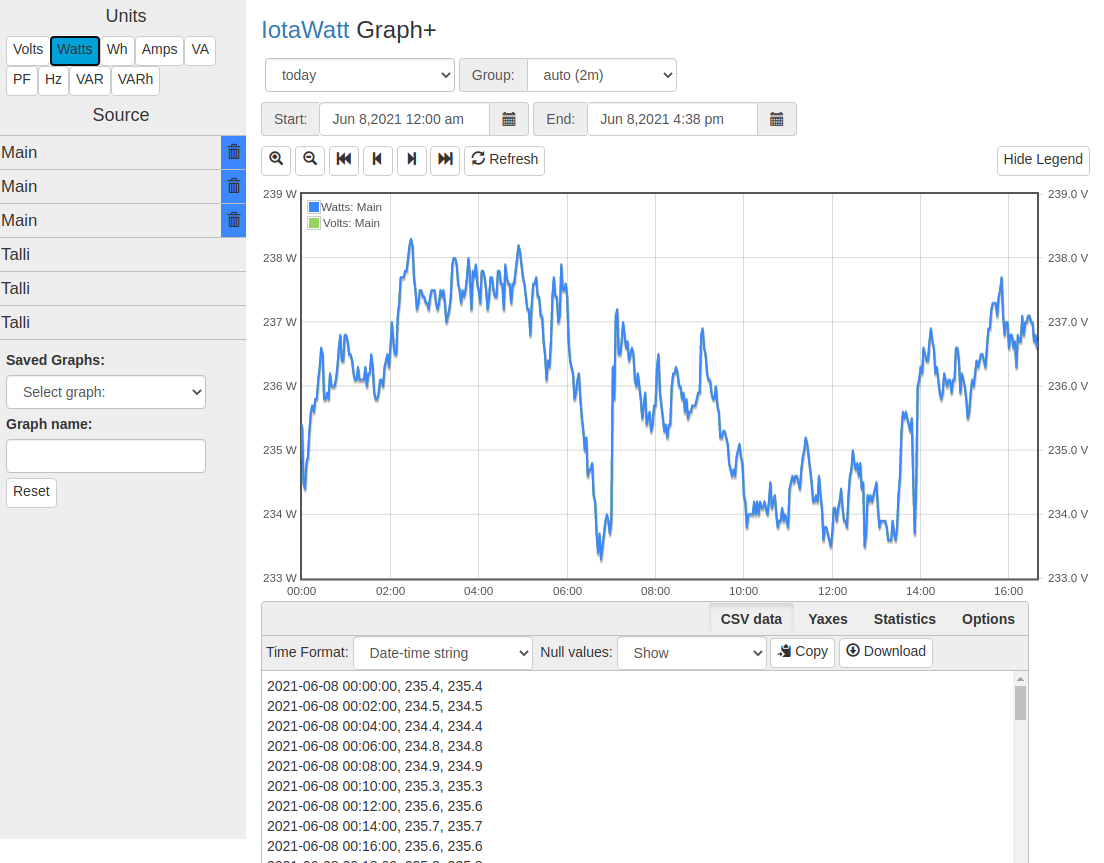
In the IotaWatt Power Monitor all the power consumptions and the voltage values seem to be ok but on the graphic visualizations (Graph+ and the Original Graph) the values for the power in Watts of the first system seem to display voltage values. I.e. it is all the time between 230 and 239. The Volt and Watt values are identical also in the CSV list.
The Watts for the second system seem to be ok in the graphic visualization.
Any ideas how to fix this?