So, I have had the IoTaWatt for about 8 months and I could not ask for a better supported product for my energy monitoring needs. Due to some of the storage and logging requirements, I send all my data from the IoTaWatt to a local EmonCMS server for dashboards and viewing; I also leverage the PVOutput tool.
I had a home battery installed about a month ago, but there was an issue with the transfer switch that needed to be replaced by the vendor. Nearly a month later they got around to fixing it and I have been three days without pulling any power form the grid. Yeah. The Powerwall 2 is about 14kWh of storage and can pull 7wh peak at a time. So I do not leverage my heavy loads while on battery (AC/Range) The house uses solar to power the home as well as top off the battery when I have sun. Once the house and battery have been satisfied, any remaining energy goes to the grid as an export. This is a limited home back battery system, so it required the new load panels be added which you can see in the image below.
The thin long panel on the left is my old main panel (load center). The install for a limited back required a new main breaker be added (middle center) along with a transfer switch (right top). The battery and solar inputs are brought into the lower left where you can see the Tesla connection.
With the new panels and the moving around of my mains, I had to mount a new box (lower center) which is for low-voltage cables and my IoTaWatt device. Here, because of the great CTs @overeasy provides, I can reach every location and have room to spare. Love the longer CT cables.
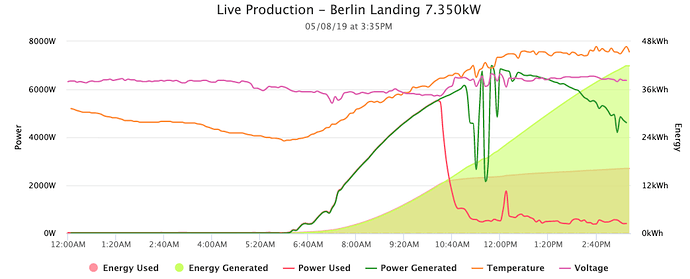
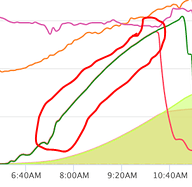
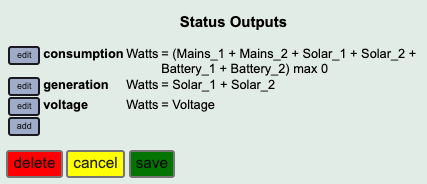
Today (~3:30pm) I have had a good day of sun and the battery which was at 25% when I woke up, we fully charged by 11:30am. I have few things I need to work out regarding the power for PV Output as you can see in the graph below. My “Power Used” seems to include my battery export (charging) and you can see the drop off around 10:30am where it begins to trickle charge the battery. But as you can see, the “Power Used” follows the “Power Generated” which I need to look at as it appears to include the battery export.
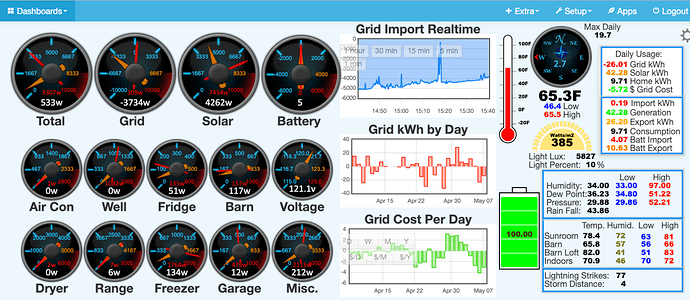
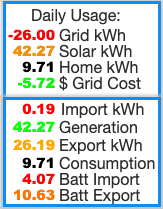
What I like to see below is the great day of Sun and how it is sent distributed. I would not be able to do this without the IoTaWatt unit. All numbers below are DAILY numbers which reset at midnight my time. So one can see that the home today has generated 42.27 kWhs so far. Home kWh and Consumption show the homes usage for the day. Grid cost shows the fee I pay to the grid, negative numbers are good.  I added the Battery Import (discharge) and Battery Export (Charge) values so I can track how much the battery is used and charged from my solar. The battery will not charge from the grid as some system may be configred. So, only the sun will maintain the battery volume. Export kWh is specific to Grid exporting.
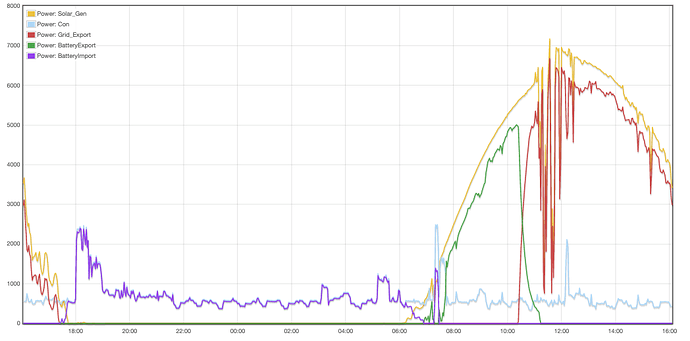
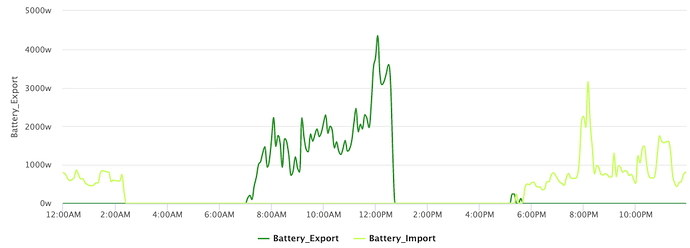
One more fun chart from the IoTaWatt as well.
Below is an image of my EmonCMS server dashboard with battery in the lower right showing a good 100% charge ready for the night I have also added a “Battery” dial in the top center to show negative (charge/export) or positive (discharge/import). All the data here updates every 10seconds which I love.

