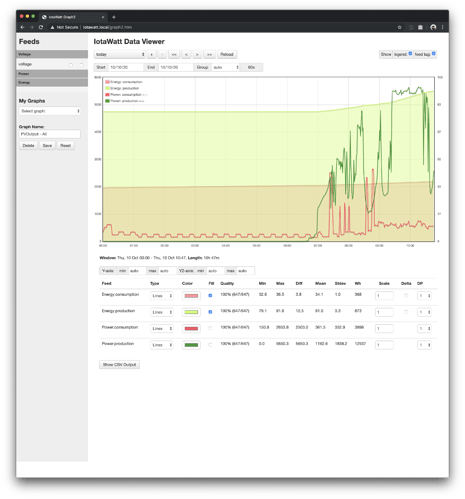
I’ve tried to replicate the PVOutput “Show All” graph in IoTaWatt enhanced graphs. But all the energy outputs seem to be cumulative (for all time), not cumulative for the graph window. How can I “reset” the energy feeds to 0 at the start of the “today” window?
Graph+ will do that. It’s in ALPHA right now and will go to BETA soon. The “enhanced graph” in 02_04_02 was an experimental front end to test the new query. It’s more or less like the classic Graph under in many ways.
Graph+ is about 90% rewrite. You should find it worth the wait.
Does Graph+ also have an option to show ALL feeds in the tooltip (like PVOutput) instead of just showing the single nearest feed? It’s currently quite difficult to see precise production and consumption for all circuits at a given moment. I have to move the cursor up or down through the various feeds, remember what the values were as I go, and with such high resolution data I’m almost certainly comparing each circuit to a time either before or after each other.
No, it does not. It’s not quite as convenient, but you can locate the moment of interest in the CSV data and get all of the values there.
