How many outputs can be defined?

It’s ok. I know I’ve been forcing the Iotas maybe beyond what is reasonable.

No problem.You’ve been helping a lot already.

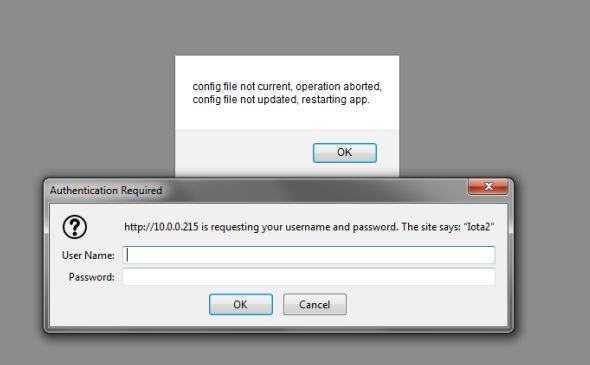
The graphs were working fine with all the 50 defined outputs. The list of Feeds failed to appear only after I added the 11 measurements. There was a restart, just like you said:


6/22/19 17:37:42 outputs: Json parse failed

** Restart **

SD initialized.
6/22/19 23:38:53z Real Time Clock is running. Unix time 1561246733
6/22/19 23:38:53z Reset reason: Exception
6/22/19 23:38:53z Trace: 15:1, 15:1, 15:0, 15:1, 15:1, 15:0, 15:1, 15:1, 15:0, 15:1, 15:1, 15:0, 15:1, 15:1, 15:0, 15:1, 15:1, 15:0, 15:1, 15:1, 15:0, 15:1, 15:1, 15:0, 15:1, 15:1, 15:0, 15:1, 15:1, 15:0, 15:1, 11:8
6/22/19 23:38:53z ESP8266 ChipID: 6910711
6/22/19 23:38:53z IoTaWatt revision 4.8, firmware version 02_03_21
6/22/19 23:38:53z SPIFFS mounted.
6/22/19 17:38:54 Local time zone: -6:00
6/22/19 17:38:55 device name: Iota1
6/22/19 17:38:55 MDNS responder started for hostname Iota1
6/22/19 17:38:55 LLMNR responder started for hostname Iota1
6/22/19 17:38:55 HTTP server started
6/22/19 17:38:55 WiFi connected. SSID=IoTaNetwork, IP=10.0.0.221, channel=9, RSSI -60db
6/22/19 17:38:55 timeSync: service started.
6/22/19 17:38:56 statService: started.
6/22/19 17:38:56 Updater: service started. Auto-update class is NONE
6/22/19 17:38:56 dataLog: service started.
6/22/19 17:38:57 dataLog: Last log entry 06/22/19 17:38:45
6/22/19 17:38:57 historyLog: service started.
6/22/19 17:38:58 historyLog: Last log entry 06/22/19 17:38:00

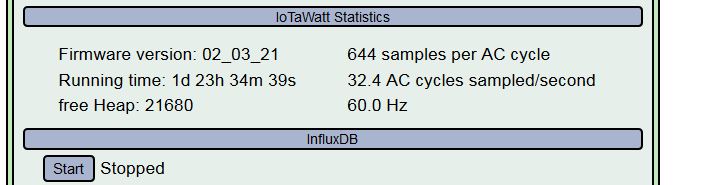
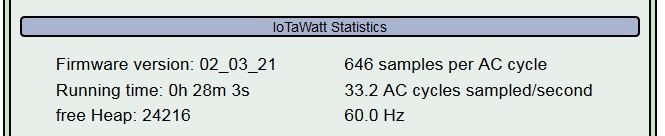
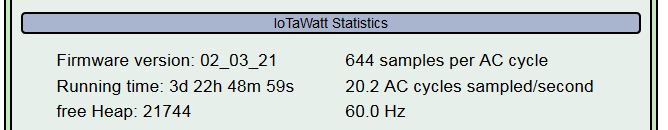
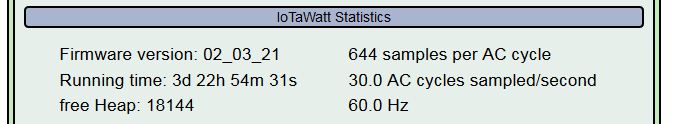
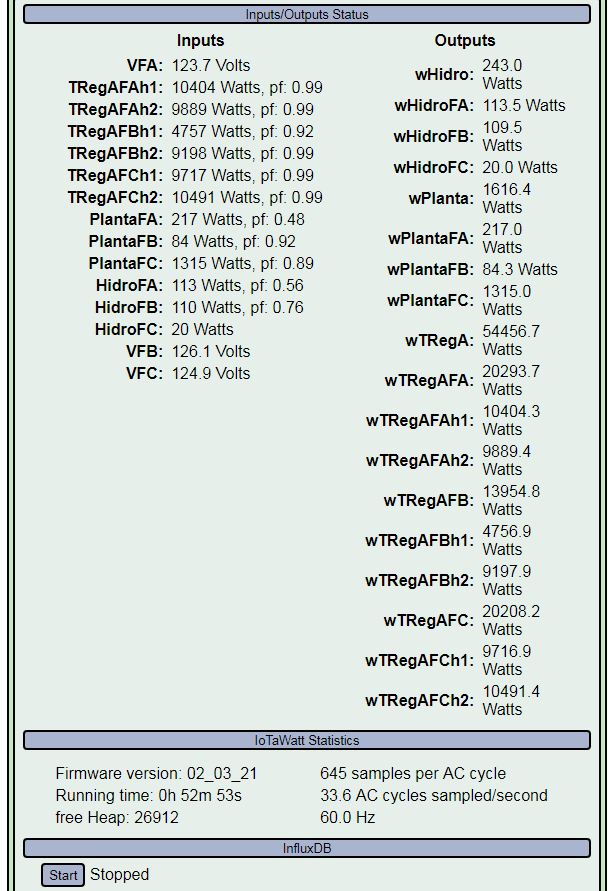
As for the heap, usually it has been at just above 25,000; except once last week were it was at just above 21,000 but I didn’t get a screenshot of it. That was after I increased the number of Outputs.
Right now the statistics are the following. As you can see the unit has not reset since Saturday, when the json error reset the IotaWatt.

Yet the feed/list doesn’t work. I’m at a loss, but if you upload your config.txt file, I can try to recreate it here. If it fails, I have tools to diagnose.

Here’s the file:

config.txt (8.4 KB)

I just made a backup of the microSD card

After power cycle I can now see the feeds and the graphs.

Here’s the message log of the restart:

** Restart **

SD initialized.
6/25/19 00:56:20z Real Time Clock is running. Unix time 1561424180
6/25/19 00:56:20z Power failure detected.
6/25/19 00:56:20z Reset reason: External System
6/25/19 00:56:20z ESP8266 ChipID: 6910711
6/25/19 00:56:20z IoTaWatt revision 4.8, firmware version 02_03_21
6/25/19 00:56:20z SPIFFS mounted.
6/24/19 18:56:21 Local time zone: -6:00
6/24/19 18:56:21 device name: Iota1
6/24/19 18:56:24 Connecting with WiFiManager.
6/24/19 18:56:27 MDNS responder started for hostname Iota1
6/24/19 18:56:27 LLMNR responder started for hostname Iota1
6/24/19 18:56:28 HTTP server started
6/24/19 18:56:28 WiFi connected. SSID=IoTaNetwork, IP=10.0.0.221, channel=9, RSSI -64db
6/24/19 18:56:28 timeSync: service started.
6/24/19 18:56:28 statService: started.
6/24/19 18:56:28 Updater: service started. Auto-update class is NONE
6/24/19 18:56:28 dataLog: service started.
6/24/19 18:56:30 dataLog: Last log entry 06/24/19 18:51:45
6/24/19 18:56:30 historyLog: service started.
6/24/19 18:56:30 historyLog: Last log entry 06/24/19 18:51:00

If it’s a heap issue I guess the problem may still happen. So I guess you still recommend I delete some of the outputs (even if will not affect the Influx uploading)?

Right now the Statistics are

2019%2006%2024%20Statistics%20After%20Power%20Cycle%20for%20SDbackup

I have your config loaded and can recreate the problem. It appears to be something with either arduinoJson or the String class. putting my money on the former. I’m trying some things out, will get back to you.

OK, at the end of the day it’s a heap problem. But I just learned a lot about ArduinoJson, which I use extensively to produce output like this.

It is consuming HUGE amounts of memory to do this. It has been a good tool for parsing input files, and for generating small output files, but I’m going to have to move away from it for some key functionality where I can produce Json more efficiently.

There is also the problem that the author has moved away from the low-memory objective in favor of elegant functionality. It happens. The new Version 6 does not support dynamic memory allocation so I would need to allocate worst-case-scenario buffers all over the place to switch to that. Not going to happen.

I’m surprised that you aren’t having problems with the status display as well. I suspect this may be the cause of the low-heap problems that have cropped up in a few systems with multiple server upload processes active. I’ll fix that first.

I don’t know why you were able to run after restarting. It doesn’t have anything to do with the SD card copy. I suspect it’s because something hasn’t started to allocate buffers and such.

Interesting. OK, so heap then. I will delete a bunch of the Outputs then. I don’t want to test my luck.
BTW: silly me. I asked you if I should copy the truncated json file from the SD card. Only later I realized that the json reply is generated on request.

Agree the dynamic memory should work best for the IotaWatt where configurations are not fixed. Plus the changes would be major.

As I said, I don’t wanna test my luck. I will reduce the number of outputs. What you think?
As for the number of measurements I believe that 11 should be fine. I’m assuming it should handle it well since probably 12 inputs (or 14 on single phase systems) should be common with other users.

What test do you recommend me to exercise the heap?

Well, since it’s related to the heap the restart (or power cycle) freed-up some heap. Actually it went from 21680 to 24216 after restart.
Right now, exactly 1 day aftee the restart the heap is at 24312.

Let me know if you want me to try something else.

Thanks again.

In case you were wondering… The IotaWatt has been uploading for 4 hours now.

Setup is:
Defined measurements: 11
Defined outputs: 20
Post interval: 5 seconds
Bulk send: 6

The upload rate has been about 77 backlog hours/hour or 609840 individual values/hr

1 Like

The IotaWatt keeps uploading the backlog at about 87 backlog hours/hr.

There are two things I’m concerned about from the statistics:

Sampled AC cycles
Sampling%20AC%20cycles%20while%20sending%20backlog%20to%20Influx

Heap

Low%20heap%20while%20sending%20backlog%20to%20Influx

Note that both metrics keep going up and down, and the values are never constant.
For the AC cycles, it loops randomly more or less as follows on each update 31 30 28 25 20 28.
The heap keeps oscillating between 21.7k and 18.4k but I’ve seen it drop to just below 17k.

Do you think this may hurt monitoring performance?

No, I don’t. It’s not optimal, but even in a fully loaded unit (14 inputs) that’s still close to 2 samples/sec/input.

The heap seems stable. It does use a lot of buffer to shovel all that data to influx. Even if it does trip a low-heap restart, it should pick right up where it left off.

One thing I discovered looking at your issues a few weeks ago is that generating json stresses heap with arduinoJson. I’m going to roll my own in the next release. I say this because the status display query in your case will use a lot of heap because of the outputs defined. So when you are monitoring status, heap will naturally be lower anyway. It would be best to refresh the app so it isn’t doing status, or even close the browser window when not checking in on progress.

Seems like it’s working hard but stable for the last 20 hours or so. No need to worry as far as I can see. That little ESP8266 is working fine.

Thanks!

OK. I was thinking a Restart through the UI of the webpage could help but maybe not.

Your own Json library ?

Since I’ve been closely checking progress I’m usually at the Message Log webpage, which is static I think, and go back to the status just to check Statistics. You think I should still close it ?

BTW. I would like to add the other 3 IotaWatt units and see if the Influx server can handle it. So I’ve been monitoring the upload rate. So far so good at around 80 backlog hours/hr, except at one point when it dropped a lot. Blue line is the uploaded backlog hours, black line is upload rate on the right vertical scale.

Any ideas on what could have happened when the upload rate went down? At that time the Status was refreshing quite slowly (every few seconds instead of every second) then I reloaded (I think) and it went back to once per second. It seems as if the Influx upload was slow or paused then it went to the normal rate (as you can see in the graph on the next point)

Thanks.

No, just generate the json text stream directly in a buffer.

No, that’s fine.

I suspect the limiting factor is the IoTaWatt, but I don’t know what you have for an influx server. You can certainly add one at a time and see what happens. You can stop one or more of them if influx seems to be choking.

I’m more interested in why it went up. I don’t understand that. Steady state was 90 or so and suddenly its 120. There can be a lot of things to slow it down, but you have to wonder what can cause a 33% increase in throughput. I’m dubious. Seems to me that if you lay a straightedge on the blue line the net slope is pretty constant.

Is it possible that you have a hole in your data, and you are counting that as if the missing data was uploaded?

You’re right that’s more puzzling. I checked and there are no holes, at least in this part. I just plotted the progress from last night and it’s still at around 90. But you’re right I’m counting time not data.
BTW, I noted the heap was much higher than normal this morning and yes indeed: it reset past midnight. Just in case it’s helpful to you, here it is:

7/03/19 00:52:31 Heap memory has degraded below safe minimum, restarting.

** Restart **

SD initialized.
7/03/19 06:52:33z Real Time Clock is running. Unix time 1562136753
7/03/19 06:52:33z Reset reason: Software/System restart
7/03/19 06:52:33z Trace: 1:3, 1:4, 1:5[7], 7:0, 7:9, 1:6, 1:1[3], 1:2[4], 9:0[4], 9:0, 9:1, 8:4, 8:6, 8:8, 8:9, 9:3, 9:5, 9:9, 1:2, 1:3, 1:4, 1:5[7], 7:0, 7:9, 1:6, 1:3, 1:4, 1:5[5], 1:6, 1:3, 1:4, 1:5[21]
7/03/19 06:52:33z ESP8266 ChipID: 6910711
7/03/19 06:52:33z IoTaWatt revision 4.8, firmware version 02_03_21
7/03/19 06:52:33z SPIFFS mounted.
7/03/19 00:52:34 Local time zone: -6:00
7/03/19 00:52:35 device name: Iota1
7/03/19 00:52:35 MDNS responder started for hostname Iota1
7/03/19 00:52:35 LLMNR responder started for hostname Iota1
7/03/19 00:52:35 HTTP server started
7/03/19 00:52:35 timeSync: service started.
7/03/19 00:52:35 statService: started.
7/03/19 00:52:35 dataLog: service started.
7/03/19 00:52:36 dataLog: Last log entry 07/03/19 00:52:30
7/03/19 00:52:37 historyLog: service started.
7/03/19 00:52:38 historyLog: Last log entry 07/03/19 00:52:00
7/03/19 00:52:40 influxDB: started, url=10.0.3.238:8086, db=iotawatt, interval=5
7/03/19 00:52:44 WiFi connected. SSID=IoTaNetwork, IP=10.0.0.221, channel=9, RSSI -59db
7/03/19 00:52:44 Updater: service started. Auto-update class is NONE
7/03/19 00:53:29 influxDB: Start posting at 12/28/18 00:23:20

Another issue. May be minor, I don’t know.

I was working on a second IotaWate deleting outputs to reduce the number before starting the Influx upload and the IotaWatt reset. It did it twice. Then as I tried to start the upload the server the server would not start (using Firefox) but it started from Chrome (this may be non-issue, I know how web browsers behave).

Here’s the relevant info:

Message Log:

7/03/19 14:16:24 Heap memory has degraded below safe minimum, restarting.

** Restart **

SD initialized.
7/03/19 20:16:26z Real Time Clock is running. Unix time 1562184986
7/03/19 20:16:26z Reset reason: Software/System restart
7/03/19 20:16:26z Trace: 1:3, 1:4, 1:3, 1:4, 1:3, 1:4, 1:3, 1:4, 1:3, 1:4, 1:3, 1:4, 1:3, 1:4, 1:3, 1:4, 1:1[8], 1:2[9], 9:0[9], 9:0, 9:1, 8:4, 8:6, 8:8, 8:9, 9:3, 9:5, 9:9, 1:2, 1:3, 1:4, 1:5[21]
7/03/19 20:16:26z ESP8266 ChipID: 7271267
7/03/19 20:16:26z IoTaWatt revision 4.8, firmware version 02_03_21
7/03/19 20:16:26z SPIFFS mounted.
7/03/19 14:16:27 Local time zone: -6:00
7/03/19 14:16:27 device name: Iota2
7/03/19 14:16:28 MDNS responder started for hostname Iota2
7/03/19 14:16:28 LLMNR responder started for hostname Iota2
7/03/19 14:16:28 HTTP server started
7/03/19 14:16:28 timeSync: service started.
7/03/19 14:16:28 statService: started.
7/03/19 14:16:28 dataLog: service started.
7/03/19 14:16:29 dataLog: Last log entry 07/03/19 14:16:20
7/03/19 14:16:29 historyLog: service started.
7/03/19 14:16:31 historyLog: Last log entry 07/03/19 14:16:00
7/03/19 14:16:33 WiFi connected. SSID=IoTaNetwork, IP=10.0.0.215, channel=9, RSSI -58db
7/03/19 14:16:33 Updater: service started. Auto-update class is NONE

** Restart **

SD initialized.
7/03/19 20:16:41z Real Time Clock is running. Unix time 1562185001
7/03/19 20:16:41z Reset reason: Exception
7/03/19 20:16:41z Trace: 1:3, 10:11, 15:1, 15:0, 15:1, 10:11, 10:11, 10:11, 10:11, 15:1, 15:0, 15:1, 1:4, 1:1[12], 1:2[13], 9:0[13], 9:0, 8:4, 8:6, 8:8, 8:9, 1:2, 1:3, 1:4, 1:3, 10:8, 11:0, 11:4, 11:5, 11:5, 11:6, 11:7
7/03/19 20:16:41z ESP8266 ChipID: 7271267
7/03/19 20:16:41z IoTaWatt revision 4.8, firmware version 02_03_21
7/03/19 20:16:41z SPIFFS mounted.
7/03/19 14:16:42 Local time zone: -6:00
7/03/19 14:16:42 device name: Iota2
7/03/19 14:16:43 MDNS responder started for hostname Iota2
7/03/19 14:16:43 LLMNR responder started for hostname Iota2
7/03/19 14:16:43 HTTP server started
7/03/19 14:16:43 WiFi connected. SSID=IoTaNetwork, IP=10.0.0.215, channel=9, RSSI -57db
7/03/19 14:16:43 timeSync: service started.
7/03/19 14:16:44 statService: started.
7/03/19 14:16:44 Updater: service started. Auto-update class is NONE
7/03/19 14:16:44 dataLog: service started.
7/03/19 14:16:45 dataLog: Last log entry 07/03/19 14:16:35
7/03/19 14:16:45 historyLog: service started.
7/03/19 14:16:46 historyLog: Last log entry 07/03/19 14:16:00
7/03/19 14:33:07 influxDB: started, url=10.0.3.238:8086, db=iotawatt, interval=5
7/03/19 14:33:09 influxDB: Start posting at 09/06/18 00:00:05

The error on web browser:

Iota2%20fail%20on%20outputs%20delete

That’s not a big problem. From its genesis as a simple IOT device, the config app operates almost exclusively by modifying the config file and uploading a new version. So there is a potential issue if the file you modified is not the same as the one currently in use. IoTaWatt uses hashes to determine if an updated config is based directly from its current config. If not, the update is rejected and the app is restarted with the current config.

This is most common with two copies of the config app running simultaneously, but the method is stressed by the start/stop mechanism which was really not intended to be an operational tool. That needs to be changed to a different mechanism.

But the error case is pretty harmless, albeit confusing.

1 Like

I stopped one of the IotaWatt units after it finished uploading the backlog of a group of measurements. I defined a new group of measurements to upload their backlog and now I noticed the status of the Influx server is missing the message "Last update xxxxxx " after the “Stopped” status. Is that normal?

I think so. Don’t have the whole scenario, but I can see that it was restarted less than on hour before, so if it was stopped when it restarted, it has no context yet.

Hi
I need some help thinking here…

I finished uploading all the backlog of measurements some days ago. It took a while but I basically uploaded all the 10-months backlog from 2 IotaWatt units up to the first days in July (from september to July). Downoading the CSVs from each measurement is still pending while I work on some Python scripts for handling and processing the files.

While doing so, a requirement came to make some demonstration dashboards. I’m using Grafana and Chronograf.

[Remember the upload of the backlog was made in groups so that the IotaWatts were not overloaded. A group uploaded up to July 5, another to July 2nd, etc depending on when I hit STOP for the Influx server.]

Since now I need to upload the rest of the backlog to have updated data in the dashboards (including real time values) I simply configured a few of the measurements (wattshours and watts of each circuit plus the voltage of the 3 phases)

Since the backlog of those specific measurements finished uploading up to different dates (because they were on different groups) when I restarted the Influx server it began uploading on the date of the newest measurement (July 20) and not the oldest (July 2nd). Note that I kept September 2018 as the “upload history from” date.

Now I’m stuck. I could upload again by groups, but it seems I would still be unable to ever get back on track with the real time data unless I want to accept gaps in the data depending on the precision of hitting the Stop button.

Please help.

Edit: I just realized at one thing while looking at the dashboards. All measurements are being uploaded since the date of the newest (most current) measurement. Now I have gaps on the rest of the measurements from the date they actually finished uploading to the date of the newest measurement. Now if I go back and try to upload those it won’t work, since now all this group of measurements have newer data in Influx…
Guess I’ll need to fix that manually on the Influx database by deleting data for all all measurements after some specific date?

If you used a unique tag for each group, each group should start where it left off. IoTaWatt will query influx at startup for the most recent measurement of all of the measurements configured. It will then begin posting all of the group from that point. If you feel it did not do that, then show me the specifics and I’ll look into it.

As far as contaminating the database with recent uploads that are not contiguous with the previous upload, take a look at the “drop” CLI command. You should be able to drop all of the measurements with a given tag and timestamped greater than a specified date. You get a do-over.

1 Like

Thanks.
No, silly me didn’t use any tag other than $device to id the IotaWatt unit since I rushed to upload everything for offline processing and let figuring out everything regarding tags for later depending on the actual requirements for the dashboards. I’ll try to delete the values of the measurements after a timestamp so they all will begin re-uploading at the same time. Thanks.

BTW, something not related. I’m trying to get the timestampo of the maximum value of a measurement but I believe that a timestampo should be a value in the influx DB for SELECT to return it in a query. However, I don’t know how to insert time as a tag from the influx configuration at the IotaWatt. For now, I’m using the Table visualization in Grafana since that returns both the maximum value and the timestamp. But what if I only want the timestamp?