Hi Everyone!
I am trying to create the following table in Grafana (v7.0) using influxdb. Would appreciate any help.
Hi Everyone!
I am trying to create the following table in Grafana (v7.0) using influxdb. Would appreciate any help.
Grafana is a rapidly evolving project. I put that dashboard together a couple of years ago and upon revisiting, I see that the way top go about it seems to have changed. So I just created a new panel that does the same thing.
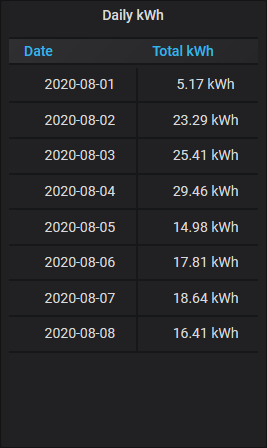
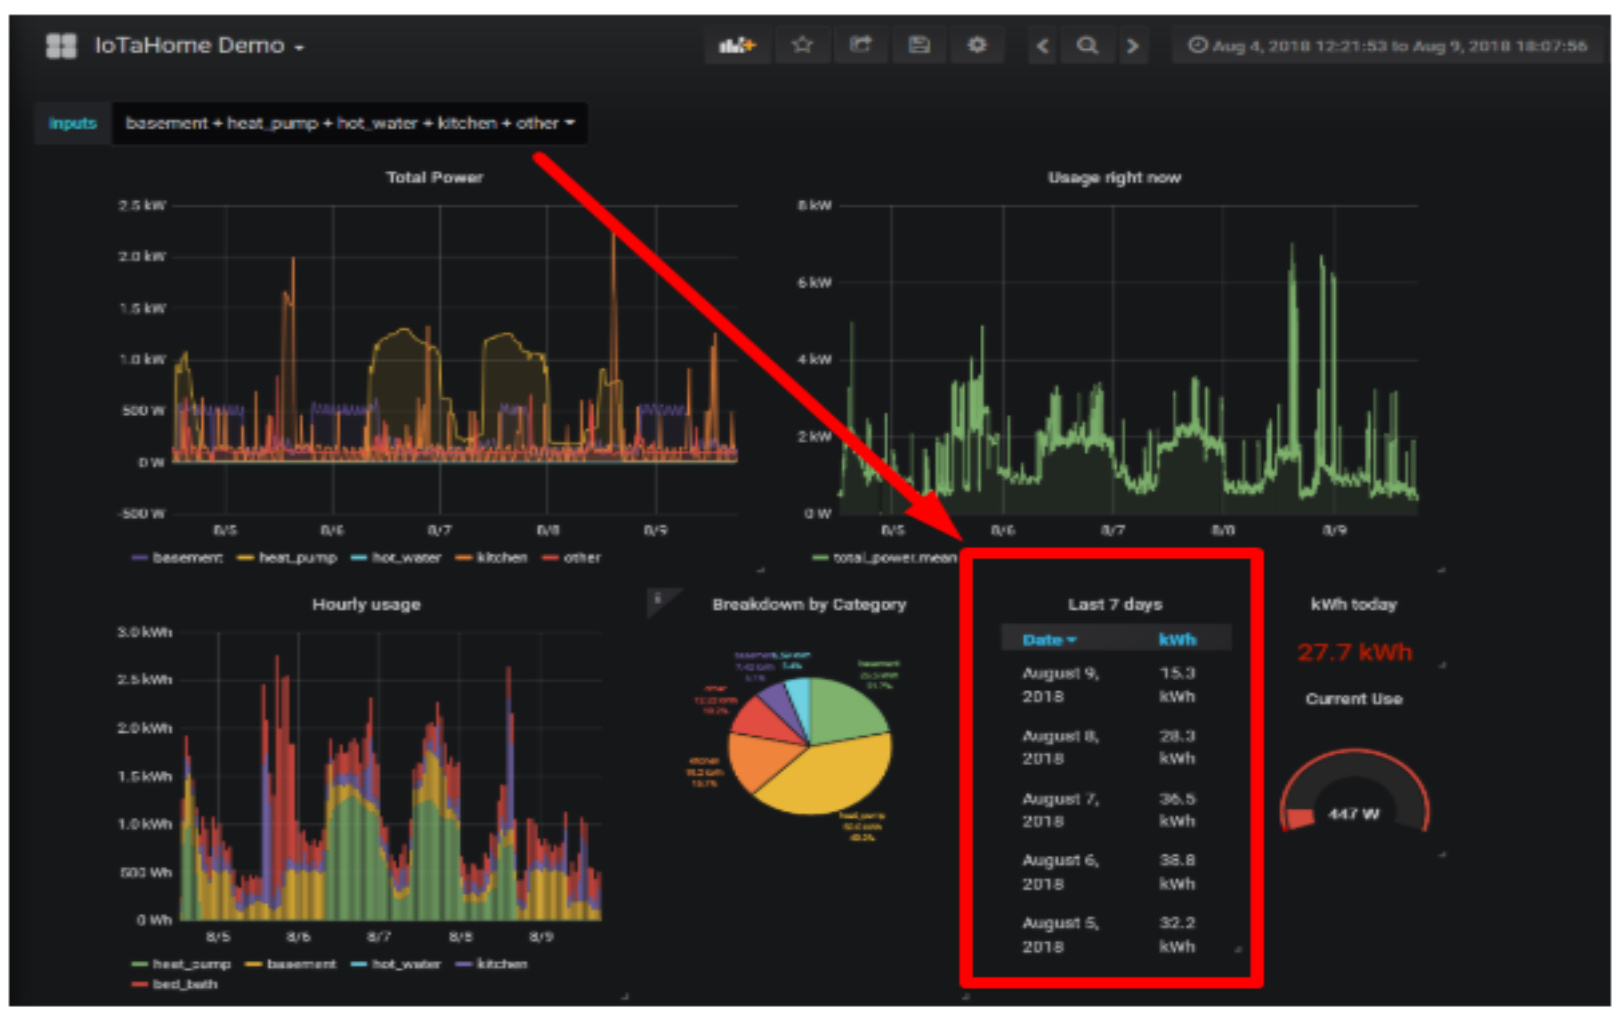
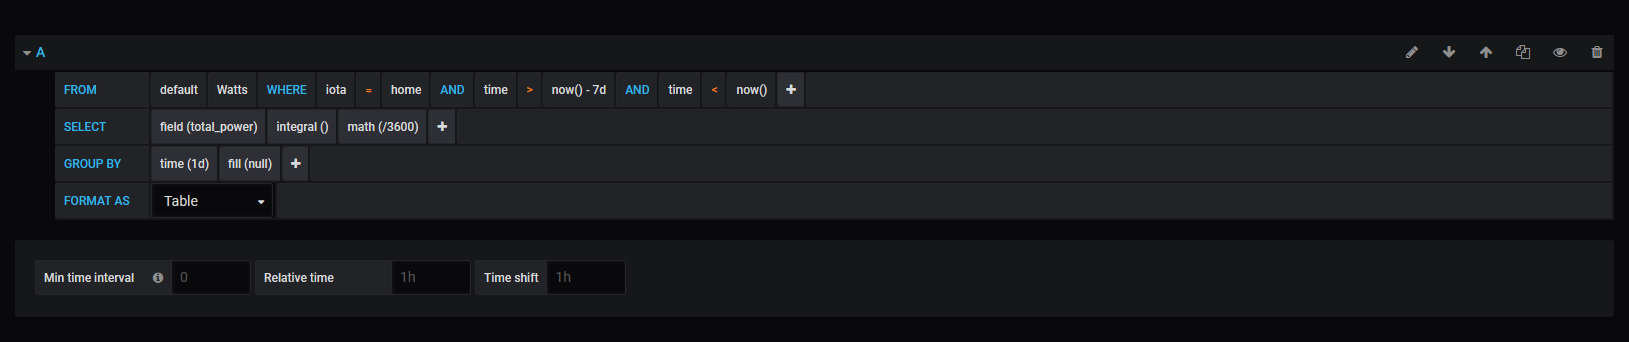
It shows the kWh for the past 7 complete days. To do this I created a new panel with visualization type “table”. Then I added a query to return Wh for each of the days:
So lets unpack this. First, you don’t want to use whatever time period is selected for the dashboard, you want this query to be for the last seven whole days. So modifying the “WHERE” clause in the “FROM” line to add ![]() . You can change that - 7d to however many days you want in the lookback window.
. You can change that - 7d to however many days you want in the lookback window.
Next I changed the SELECT line to select my total-power (Watts) data item and specified to integrate that (multiply each by it’s time period and add them up). That yield WattSeconds because my epoch is seconds, so I divide that by 3600 to get Wh.
Finally, in the Group By line I specify one day (1d).
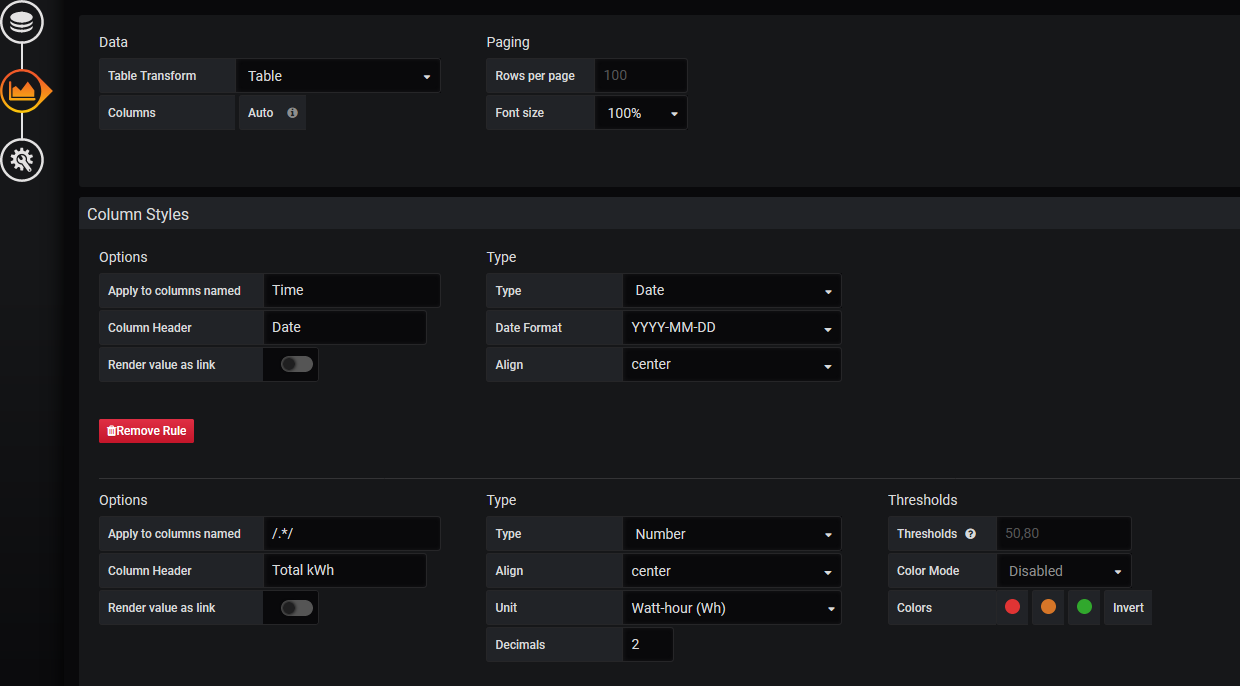
Now to format the table, I click the Visualization icon on the left and specify column headings, data format etc as indicated here:
Grafana is a very powerful tool. There are probably other ways to do this. To get this far took about 20 minutes of head-scratching and following help links. The farther you get, the easier the next one is. Power and ease of use are frequently antithetical, but a good product like grafana usually has a consistent and logical approach that gets easier as you learn the language.
Hi Bob -
First and foremost thank you so much for the reply and the amazing detail you have gone into to help me. So I followed your steps but it seems as if the time override isn’t working. Any thoughts? I am using Grafana v7.0
Hello @Haider,
I was playing with this last night and reconciling (trying) with Graph+ directly from IoTaWatt with mixed results. Grouping hourly seems to work, but daily seems to be grouping by UTC days rather than local time. I need to take a closer look at my influxDB setup (RPi) and make sure it knows what time zone it’s working in.
To your question, I have two instances of Grafana that I use. One is a limited free instance hosted by grafana, and the other is a port on my RPi. The example was done on the free grafana site. I cannot replicate on the RPi instance. I haven’t dug deeper to look at versions etc. Will do that over the next few days as time allows and post back then.
Thank you @overeasy. Posted the same issue on Grafan’s forum but haven’t gotten any replies yet. I will keep playing around myself as well. I have hosted my own instance on a Digital Ocean server, just FYI.
Regards,
Haider