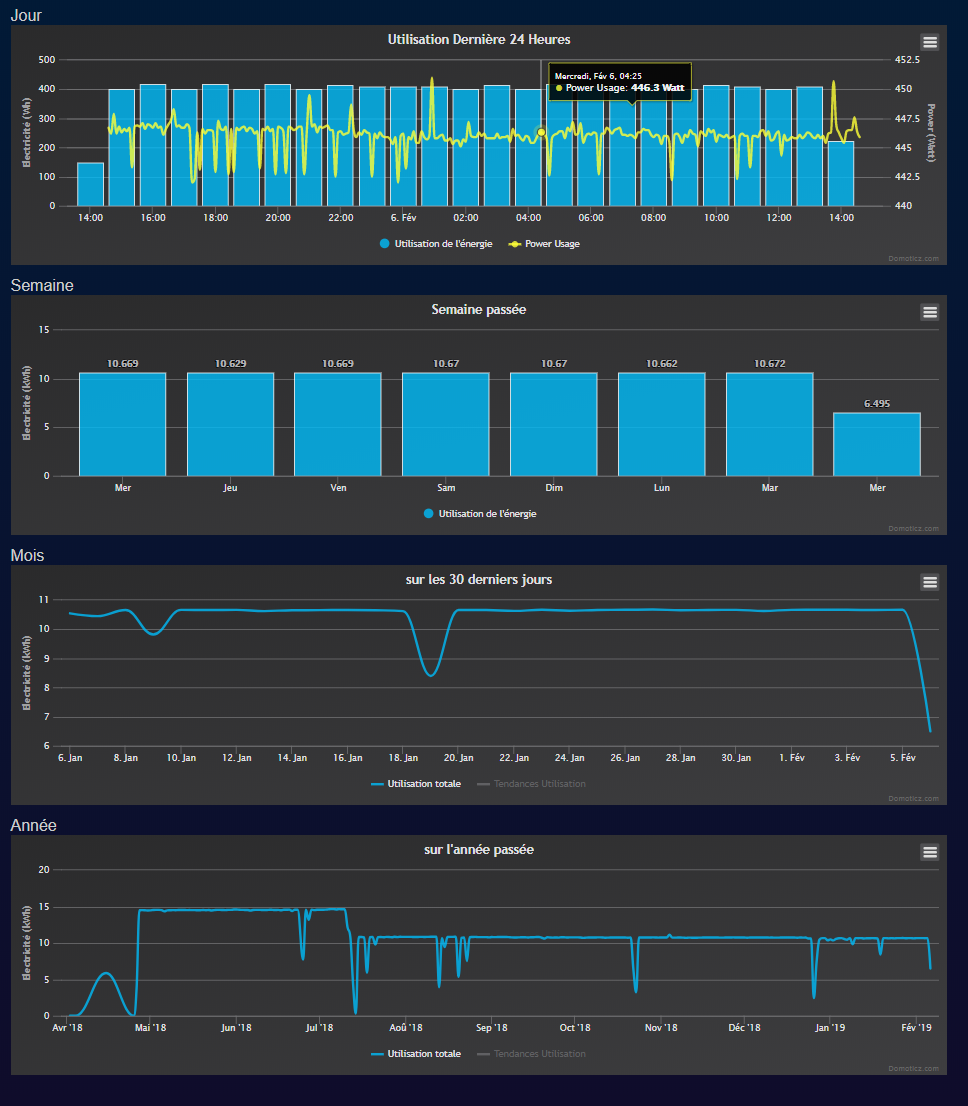
Here a view of my Zwave report meter i got, with the Domoticz application. How can i get this type of info with iotawatt ? Or someone know a method to see those view ? ( kw/day / weeks / month / year)
I was intend to use Emoncms, but it came with an annual cost. Did someone integrated the iotawatt in Domoticz ? (could be usefull to monitor from that interface, because i could also automate things from there based on some mesurement…)
You can get kWh/day,week, month and soon quite a few more selectableperiods using the integrated graphing application. It produces a single interactive graph. If you would like a “dashboard” as you have pictured, you can upload to influxDB and use telegraph or grafana to build dashboards.
I’m unfamiliar with the capabilities of Domoticz, so I don’t know if it has its own time series database or interfaces to an external database. I’m open to working with folks that want to integrate these tools with IoTaWatt, but don’t have the resources to lead a project to do it.
I think i found now…
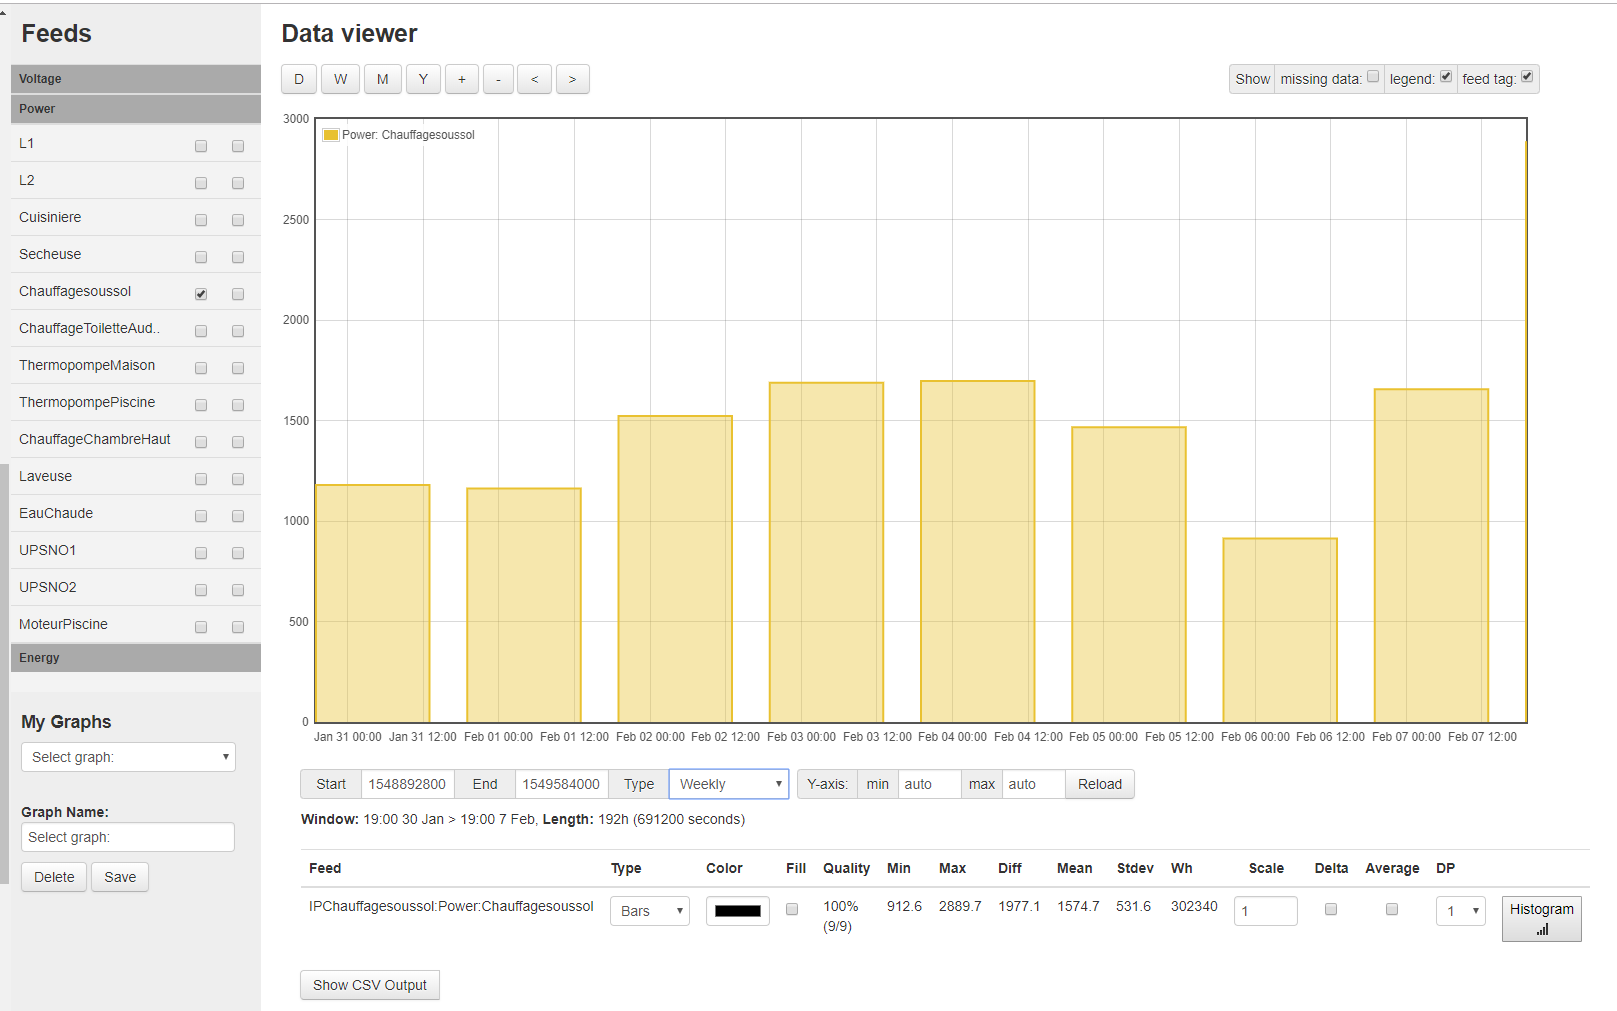
Click on “Power” and select the device i want.
Under the graph, choose “weekly” then under feeds, select “Bars” ?
but it seem to display only the maxim Watt mesure each day, not kwh. Can i see this in the actual graph ? (and how ?)
Seem now to display exactly what i want to see !
kWh are energy, so select the same input under the energy tab to get cumulative kWh at the end of each day, and then click “delta” then “reload” to see the kWh for each day.
Thanks !
It’s only the “Delta” that i had not selected. Now working exactly the way i want !
When i will install my Stove Pellet and start using it, i will be able to “see” the result in the energy